USDCHF broad falling wedge pattern and break and retestUSDCHF
Has managed to break the broad falling wedge pattern and retested once around 0.92500 level and bounced back towards 0.93000
And we can see a series of HH HL HH pattern here which is a clear sign of the bullish trend. The next possible upside target would be 0.93500 and 0.94000
In second quarter of the 2020 USDCHF has managed to fell below the 0.90000 major key psychological and reserve bank intervention level. Most of the time USDCHF
Has bounced from this level.Due to the broad weakness in USD is the main reason for the rapid selling in USDCHF. After start of this year we can see some bullish trend in DXY
which is reflecting in this pair and managed to back above 0.90000 level and currently trading near 0.93000 level.On monday market open the price might reach around 0.92500
and i am expecting bounce towards 0.94000.
The Exponential moving average was just below the current price level which is a clear sign of the bullish trend here.The bear has to contend with these Moving averages such as 50,100
In Ichimoku cloud the cloud has turned red and its broadening too and the middle line is currently acting as another support for the bullish trend. And in Bollinger bands the price has reached around
middle band which will give a short term buying pressure
RSI has reached around 50,MACD is still above the line and green and Stochastic has reached around 80(short term fall back was expected)
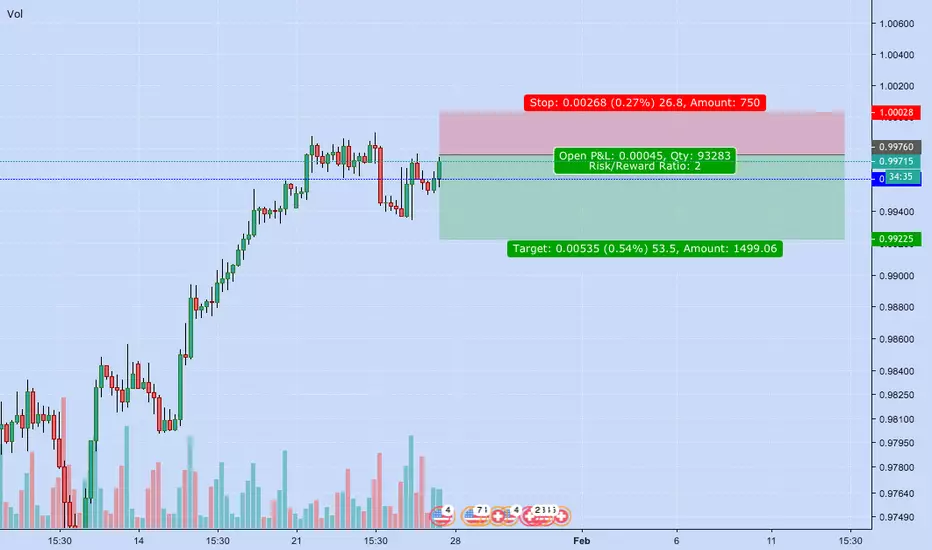
Trade call
Buy @ 0.92600
Take profit @ 0.94000
Stop lose @ 0.92100
Usdchfidea


USDCHFCurrent Trend Downside (Sell)
TG1 = 0.88923
TG2 = 0.88776
TG3 = 0.88536
STL= 0.89300
If Trends Breaks (Buy)
TG1 = 0.89208
TG2 = 0.89398
TG3 = 0.89689
STL = 0.89850

Learn To Trade the Triangle Exceptinal Risk:Reward Trade USDCHF
We have a 5 Wave upward Impulse complete; then we have the 3 Wave Correction forming where Wave A is a Flat structure complete and verified; Wave B is a Contracting Triangle complete and verified; after completion of the Triangle there is a massive move in the direction opposite to the Wave E also Wave C is in the direction of Wave A hence Wave C is expected to be a downward Zigzag hence two impulses; therefore justifies the Risk:Reward of 1:19 Enjoy the Trade;

VERY GOOD BUY TRADE IN USDCHF
We have a very beautiful opportunity to encash; This Trade has an exceptional Risk:Reward ratio; This is WAVE 3 Dream Wave of Every Trader.

USDCHF COMPLETE ANALYSIS AS PER THE WAVE THEORY
We have a downward 5 Wave Impulse complete; this is a WAVE 1 and now there is a Correction forming;
This Correction has Wave A comeplete and Wave B is forming; we need to verify the Wave A and B in the Lower Degree;
So here We have explained Wave As subdividions Wave A is a 5 Wave upward Impulse Wave B is a Triangle and Wave C is a Ending Diagonal;
Here we have Wave B forming now in the downward direction; Wave A is a Leading diagonal Wave B is a Zigzag and now Wave C is forming
So here the WAVE B ends and now we wil encash the WAVE C which will be an Upward Wave;
Here Wave 3 is a Zigzag (Zigzag is also an Impulse) hence
In Wave B we have a Wave A which is a downward Leading Diagonal; Wave B is a upward Zigzag; We see Wave B has retraced Wave A by 93.93%, hence as per the rule of Flat Wave C has to be a downward Impulse;
So then Wave B retraces Wave A 38.2% hence from here starts the WAVE C which will be an Upward Impulse
We have 2 Trades here One is a SHort Trade and then where we have the Target of the SHort trade we have a Buy Trade from there;
Long Trade

USDCHF- PREFER SHORTThe USDCHF counter’s price broke the support line of the ascending triangle. The bullish trend has come to an end. Short is suitable for this counter because of the current market conditions. The bearish trend may prolong for a couple of days and the price is expected to fall till S1.
If the price retrace back to the support trend line then square off your short positions in this counter and exit trading in this counter.

USDCHF multi time frame analysisHello Trader, Here is the full analysis of USDCHF:
1) Monthly - No significant price action found.
2) Daily - Forming big red candles which shows weakness in the prices.
2) 4Hourly - Currently testing the buy zone/support level and is in between 0 and 0.23 fib level(which is not an important level) .
3) Current retracement level is at 0.5 which is good level for prices to move up
Action
marubozu candles are formed on the daily chart which shows a weakness in the prices. If the support is broken with a marubozu candle then we can see a downfall below support. Wait for these levels to look for entry opportunity .
Technical Indicators:
Moving Averages - Strong Sell
Technical Indicators - Strong Sell
Moving Averages Crossovers - Strong Sell
COT data(Commitment of traders):
JUNE 06/02/2020
USD - Long(17877) Short(9619)
CHF - Long(13364) Short(4375)
JUNE 05/26/2020
USD - Long(21039) Short(6240)
CHF - Long(13246) Short(4507)
How can you support me :
1) Like my idea.
2) Follow me for more analysis
Feedback :
Please share your feedback in comments and this will help me to improve my drawing and analysis
Note : This is purely for educational purpose.


USDCHF sell trade @H4 chartUSDCHF
As CHF is considering as one of the safe heaven assets along with JPY its gained some strength during this financial crisis time
The Elliot wave is forming in this chart we can see that Wave 02 is almost completed and stated its run to complete the wave 03
It will form descending channel.
We can open short positions at this level which is 0.96400
0.94300 would be a resistance level we have keep eye on this level
Primary target would be 0.93100
And the final target would be 0.91900
Stop lose may placed above the 0.96900 level