Fall incoming? I don't think so.Hello traders!
Long time no see... With the Japanese elections just around the corner, there are certain speculations of an incoming fall. My analysis does not agree with that. I think JPY is heading for 159.500 buyside liquidity . Even if it is heading lower, it is highly unlikely that it goes now.
There are two scenarios here. If market consolidates around the weekly gap marked on the chart for few more days, we might see a fall. If it doesn't, we're going for higher targets. The two pink zones are daily support levels which can be expected to push prices higher.
Now, when I say two scenarios it doesn't mean I'm saying anything could happen. The major possibility is the 159.500 buyside. The second scenario is just a fail-safe.
Also, note that this is a directional analysis and NOT a trade idea. Trades require much more sophistication than this.
GLGT,
Satya.
USDJPY

USDJPY Pullback Explained: Trend Support in Focus!For me, USDJPY is still behaving like a healthy uptrend, not a market that is rolling over. Price has been respecting a clear rising channel structure, with buyers consistently defending higher lows.
The recent move lower looks more like a pullback into major trend support rather than a sign of weakness. This is exactly how strong trends usually behave, they pause, retrace, and then decide the next leg based on support reaction.
From a broader perspective:
On the fundamental side, currencies are currently adjusting to shifting rate expectations and global risk sentiment. In such phases, trends rarely reverse immediately. Instead, price often retraces into key levels before continuing or changing structure.
What I’m watching now:
As long as the rising channel and demand zone hold, the overall structure remains intact. The next move will largely depend on how price reacts at this support, not on short-term volatility.
This is not a trade call, it’s an observation of market behavior and structure.
Disclaimer: This analysis is for educational purposes only and does not constitute financial advice. Trading involves risk.

USDJPY – A Global Repricing Phase, Not a Random MoveWhen I look at USDJPY, this move doesn’t feel random to me. It looks like part of a broader global adjustment phase rather than something driven by this pair alone.
Price Context:
Price spent a long time reacting from a major supply zone before showing a clear structure shift. Since then, the market has been respecting an ascending channel, with higher highs and higher lows.
Why this move makes sense:
As global risk sentiment shifts and interest rate expectations change, currencies often move together. That’s why similar moves are visible across multiple FX pairs, this is a broad-based repricing, not a pair-specific reaction.
Current Structure:
The recent pullback into demand and trend support looks like a healthy retracement, not a breakdown. As long as this structure holds, the broader trend remains intact.
Disclaimer: This analysis is for educational purposes only and does not constitute financial advice. Trading involves risk.

USDJPYIt looks like price completed its objective just before Friday’s news release, after which USD dropped sharply. From a technical perspective, structure has flipped from bullish to bearish. A clean correction to the upside into the 148.0 supply zone followed by a drop would make perfect sense. I’ll be watching to see if this develops into a swing move.

USDJPY SELLS📉 USD/JPY – Bearish Trend With Clean Supply Rejection
As we can see, UJ is clearly in a bearish trend, confirmed by the red dots on the left chart, where price continues to create new lows.
Price recently retraced into a well-defined Supply zone around the 156.000 level. On the right chart, structure flipped after tapping the zone, giving a clean confirmation and creating a high-quality entry opportunity.
My first partials are placed at the 15-minute low, with the remaining targets marked by the red lines below.

USDJPY Breakdown Begins:Elliott Wave Points to Deeper CorrectionThe USDJPY 4H chart shows a completed five-wave impulsive structure, ending at the recent high marked as wave (5). After finishing this full wave cycle, the price has started to break down from the rising wedge pattern, which is a common sign of a trend reversal. The corrective structure from the top suggests the beginning of a larger A-B-C decline, targeting lower levels in the coming sessions. As long as price stays below the invalidation level near 157.68, the bearish outlook remains valid. This setup indicates that USDJPY has likely completed its bullish phase and is now preparing for a deeper corrective move downward.
Stay tuned!
@Money_Dictators
Thank you :)

USD/JPY – Weekly SMC Plan1. Weekly Bias
USD/JPY is showing signs of losing bullish momentum as multiple BMS (Break of Market Structure) events appear near the highs. The market keeps generating liquidity grabs, indicating potential distribution.
➡️ Weekly expectation: Bearish bias – priority is Sell from Premium zones.
2. Key Zones (based on your chart)
🔴 SELL ZONE (Primary)
155.000 – 155.300
This zone aligns with:
Premium pricing of the H4 structure
Repeated liquidity buildup
Bearish Order Block
➡️ Expect a rejection from this zone → BOS downward.
🟠 BUY ZONE (Temporary Pullback Zone)
154.000 – 153.800
This is not a trend-buy zone; it’s only for:
Imbalance fill
Short-term liquidity sweep
➡️ Only consider small intraday buys here.
3. Structural Notes
Multiple BMS at the top → strong distribution signal.
Liquidity pools & “Old Fail” zone sit around 153.300 – 153.000 → high probability target.
Final downside objective lies at the major SSL at 152.500 – 152.000.
4. Weekly Trade Plan
Trade 1 – Primary Sell (High Priority)
Entry: 155.000 – 155.300
SL: Above 155.400
Targets:
TP1 → 154.000
TP2 → 153.300
TP3 → 152.500 – 152.000 (Major SSL target)
Logic: Tap into premium → liquidity sweep → downside continuation.
Trade 2 – Pullback Buy (Secondary)
Entry: 154.000 – 153.800
SL: Below 153.700
TP: 154.700 – 155.000
Logic: Short-term retracement buy only; not for swing holding.
5. Weekly Summary
Main bias → Bearish
Only look for buys inside the small pullback demand zone.
The cleanest setup of the week:
Sell from 155.000 – 155.300 targeting the major SSL below.

USDJPY Vulnerable to Deep Pullback After Wave 5USDJPY has completed a full 5-wave rising structure inside a clear wedge pattern, which usually signals exhaustion. The final Wave (5) shows weakening momentum, and price is beginning to slip below the wedge support — an early sign that the trend may be reversing. This suggests the pair is likely entering a deeper corrective decline, potentially retracing toward 150 or lower in an impulsive A-B-C move. In simple terms: uptrend looks tired → wedge breakdown could trigger a strong downside correction.
Stay tuned!
@Money_Dictators
Thank you :)

USDJPY – Weekly Triangle Near a Big Decision !!The pair has been stuck inside a large weekly triangle formation, compressing price action after years of volatility. These types of structures usually lead to powerful breakouts, and the direction will depend on how the BoJ policy stance and the Fed’s rate cut cycle unfold.
Chart validation:
Price is coiling between lower highs and higher lows the classic look of a triangle consolidation.
Resistance sits around 162, with the upper bound of the triangle capping rallies.
Support near 137–138 has been holding the downside so far.
The breakout path points to two extremes:
Upside projection: A clean break could open a run towards 175–176.
Downside projection: A bearish resolution could drag it back to 127, the lower long-term support.
Key takeaway:
For now, USDJPY is neutral but building energy.
The next decisive move will be sparked by central bank divergence if the Fed cuts faster than the BoJ tightens, the yen could strengthen and break lower; if the BoJ holds back and the Fed stays cautious, the pair could rip higher.
We should wait for confirmation outside this triangle before positioning for the next trend. Trade safe !

USD/JPY pair and asking for a target...USD/JPY pair and asking for a target, here’s what the technicals suggest — but keep in mind: this is not financial advice — my responsible for my trades.
---
✅ What the technicals are showing
The pair is trading above its 50-week SMA, which suggests a longer-term bullish tilt.
A key resistance level is around 153.26. A breakout above that opens the way to higher targets.
If the breakout happens, one target cited is 158.80 (via a 161.8% projection).
On the flip side, if support fails (specifically ~145.47), the bullish case weakens.
---
🎯 My suggested target
Primary target: ~ 158.80 — with the caveat that my need a clean breakout above ~153.26 to justify it.
Alternate scenario: If the pair fails to break convincingly and support breaks ~145.47, the target becomes a drop toward the support zone instead.
---
🧠 Things to watch / trade‐management points
Confirm breakout: Look for a daily / 4-hour close above ~153.26 and increased momentum.
Risk management: If my entering now, consider placing your stop-loss below support (e.g. 145-147 zone) because a break there weakens the scenario.
Measure rewards vs risk: If my risk is large (large stop), the target must justify it.
Be aware of fundamentals: Events from the Bank of Japan (BOJ) or Federal Reserve (Fed) can shift this quickly.

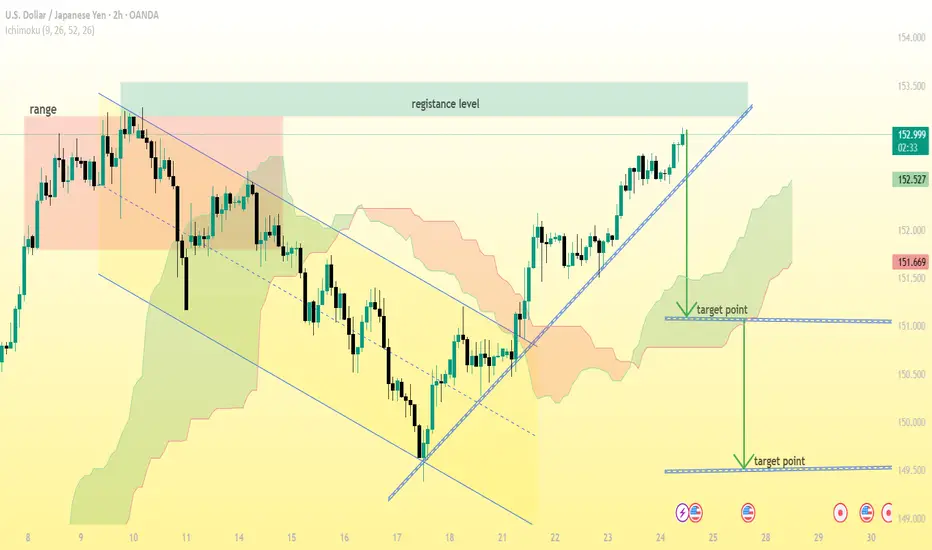
USD/JPY (2H chart)...USD/JPY (2H chart):
The current price is around 152.97, sitting at the upper resistance zone marked on my chart.
There’s a visible ascending trendline, and the price is currently testing or slightly above that line.
My marked two target points below — likely indicating a bearish correction setup if the trendline breaks.
Here’s the detailed breakdown:
---
📉 Bearish Scenario (if price breaks below trendline and 152.50 zone):
1. First Target:
Around 151.65 – 151.70
→ This aligns with my first “target point” label and Ichimoku cloud support.
2. Second Target:
Around 150.30 – 150.50
→ my lower target zone, near the previous consolidation support.
---
📈 Bullish Scenario (if resistance breaks and price sustains above 153.00):
Next resistance levels: 153.50 – 153.80, and then 154.20.
Only valid if there’s a strong close above 153.00 with volume.
---
🔹 Summary:
Scenario Condition Target 1 Target 2
Bearish Break below 152.50 151.65 150.30
Bullish Break & close above 153.00 153.50 154.20
USDJPY (Neowave Trading Idea)FX:USDJPY Namaskaram Everyone
Welcome to intelligent investor, we provide market insights by synchronising and combining all the price action waves from different time frames and gives you single trend.
Now Risk Reward is highly favourable
Trading with risk management, that is 1 percent rule with my charts.
How to Read My Charts-

USDJPY Becoming BearishFX:USDJPY
Namaskaram Everyone
Price is currently at very good structure and price to sell
If stop loss is big for you, than dont trade. Mean do not take more than 1 percent, on my charts. If you really wants to grow your capital.
I think price will easily go towards the febnachi .61 and further target will be seen after mc2 and mc3.
Additionally this structure will take some time, so you need to hold the trade for 15 days easily.
Still if you have a query, than leave a comment plz.
For How To Read My Charts.....Click Below

USD/JPY WEEKLY ANALYSIS: AIM BUY TO SWEEP FVG IN D1Market Structure Analysis
Trend: The overall market structure of USD/JPY is in an uptrend. This is confirmed by the higher highs and higher lows that have been established previously. However, the price has recently been trading sideways and consolidating within a wide range.
Order Blocks and Liquidity:
Sell Zone: The price has repeatedly failed to break above the recent high, creating a strong resistance zone from ~149.000 to ~149.200, which contains large sell-side Order Blocks. Above this zone is a large FVG (Fair Value Gap) and a key liquidity zone, making it an attractive target for buyers.
Buy Zone: Below the current low, there are two crucial support zones:
Imbalance & OB Buy: The price range from ~146.500 to ~146.900 contains an Imbalance (liquidity void) and a potential Order Block. This is a high-probability area that will attract the price to retrace and potentially trigger a bounce.
Lower OB Buy: Below the Imbalance, there is an even stronger buy-side Order Block (OB) at ~146.000, identified as a final strong support zone before the bullish structure is invalidated.
Breakout Points: A strong resistance line, referred to as "Break Davas Points," has been established at ~149.200. A definitive break and candle close above this level would be an extremely strong signal confirming the continuation of the uptrend.
Detailed Trading Plan
Based on the analysis above, there are two main trading scenarios:
Scenario 1 (Wait for Buy - Primary Plan)
Strategy: Wait for the price to correct lower to find a potential buy entry.
Entry:
Option 1 (Moderate Risk): Place a pending buy order in the Imbalance & OB Buy zone (~146.500 - 146.900).
Option 2 (Lower Risk): Place a pending buy order in the lower OB Buy zone (~146.000). This is the most ideal entry point.
Reasoning: These are strong support zones where "Smart Money" is highly likely to enter buy orders to push the price up.
Take Profit:
TP1: The FVG resistance zone at the top (~149.500).
TP2: The higher high (~150.500).
Stop Loss:
For Option 1: Place it below the Imbalance zone (~146.400).
For Option 2: Place it below the OB Buy zone (~145.800).
Scenario 2 (Breakout - Secondary Plan)
Strategy: Trade on the momentum of an upward breakout.
Entry: Wait for the price to break and close above the "Break Davas Points" (~149.200). You can wait for a retest of this zone before entering to increase safety.
Reasoning: A break of this resistance line confirms that buyers have fully regained control and are ready to push the price to higher levels.
Take Profit: Similar to Scenario 1, targeting the FVG zone and higher highs.
Stop Loss: Place it below the breakout point (below 149.200).
Note: The primary plan of waiting to buy at a strong support zone is safer and offers a better R:R (Risk-to-Reward) ratio. It's crucial to combine this plan with other confirmation signals (such as a reversal candlestick pattern) before entering a trade to maximize your probability of success.

USDJPY Sell entry 1::5 RnRUSDJPY is forming a beautiful day trade for selling side. It can be a very good intraday trade if everything goes as per plan.
1. Price kissed 4H Iceberg Block and showed sniper liquidity and left bearish FVGs at both 30m and 15m.
2. 15m FVG is inside 30m FVG and upper side of OTE area.
3. Now it is moving toward FVG areas after taking reversal from bullish 15m BPR
4. Most probably price will take liquidity of FVG and OTE zone and create MSS in LTF.
5. Order flow confirming bearish bias.
6. Price should show rejection/reversal in LTF (5m,1m) at FVG zone.
All these combinations are signalling a high probability and high Risk and Reward (1:5) trade scenario.
Note – if you liked this analysis, please boost the idea so that other can also get benefit of it. Also follow me for notification for incoming ideas.
Also Feel free to comment if you have any input to share.
Disclaimer – This analysis is just for education purpose not any trading suggestion. Please take the trade at your own risk and with the discussion with your financial advisor.

USD/JPY(20250905)Today's AnalysisMarket News:
The US August "Non-Farm Payrolls" report came in at 54,000, below the expected 65,000. The previous figure was revised up from 104,000 to 106,000. Initial jobless claims rose unexpectedly to 237,000 last week, the highest level since June.
Technical Analysis:
Today's Buy/Sell Levels:
148.34
Support and Resistance Levels:
149.32
148.95
148.71
147.96
147.73
147.36
Trading Strategy:
On a breakout above 148.71, consider a buy entry, with the first target price being 148.95.
On a breakout below 148.34, consider a sell entry, with the first target price being 147.96.

USD/JPY Bullish Continuation Towards 149.00This USD/JPY (1H) chart shows a bullish setup:
Price is respecting the ascending channel (support & rejection lines).
Currently, price is near the FVG (Fair Value Gap) zone between 147.257 – 147.526, suggesting a possible retracement before continuation upward.
Both EMA 70 & EMA 200 are aligned closely, acting as dynamic support.
A long entry is expected from the FVG zone with a target point at 148.975 – 149.002.
Stop-loss lies below the FVG around 147.251.
👉 Overall bias: Bullish continuation towards 149.00 after filling the FVG.

USD/JPY SD + OTE + PD Array AnalysisStandard Deviation Entry Model on FOREXCOM:USDJPY
1. Inducement on 15min TF
2. Targets + Mini reversal zones marked out
3. 1H PD Array (FVG) Equilibrium tapped
4. Entry Triggered
5. 1st Target HIT
6. Waiting for Standard Deviation ultimate target to hit
I'll like to know more your thoughts on this!
Share your analysis as well!

USD/JPY) LOGN TIME Analysis Read The captionSMC trading point update
Technical analysis of USD/JPY on the daily timeframe, highlighting a long-term downtrend reversal with potential for significant upside.
---
Analysis Summary
Pair: USD/JPY
Timeframe: Daily
Current Price: 147.442
Bias: Bullish breakout from a descending wedge structure.
---
Key Technical Insights
1. Descending Trendline Break:
Price has broken above the long-term downtrend line, signaling a reversal.
Breakout area is circled in yellow, confirming bullish intent.
2. Trendline & Structure Support:
Multiple rejections from the ascending support trendline (marked by green arrows) confirm accumulation and higher lows.
3. 200 EMA as Dynamic Resistance/Support:
Price is now above the 200 EMA (147.920) — a bullish signal, turning resistance into support.
4. RSI (14):
RSI at 62.99, approaching overbought territory, but still has room to push further.
---
Target Point
Target: 158.951
Based on measured move from wedge breakout and historical resistance level.
---
Trade Setup Idea
Direction Entry Stop-Loss Target
Buy 147.40–147.60 Below 145.80 158.95
Mr SMC Trading point
---
Summary
This chart signals a major bullish breakout on USD/JPY, with the break of a year-long downtrend structure, reclaiming the 200 EMA. If this breakout sustains, price could aim for 158.95 in the coming weeks.
Please support boost 🚀 this analysis)

USDJPY – Is the Downtrend Taking Shape?On the H4 chart, USDJPY shows signs of weakening as it repeatedly fails to break above the long-term descending trendline. Despite a recent recovery toward the 147.000 level, buying momentum appears to be fading. The price structure suggests the possibility of a false breakout before a reversal toward the 144.300 support zone—an area with multiple unfilled FVGs.
From a news perspective, traders are awaiting today’s upcoming U.S. CPI report. If inflation data comes in hotter than expected, the USD may gain short-term strength. However, a weaker CPI reading could trigger a quick reversal in USDJPY, confirming the bearish setup. The 147.000 level remains the critical zone to watch for any potential rejection or breakout.

USDJPY: Weak Rebound, High Downside RiskUSDJPY remains under bearish pressure as price continues to be rejected at the descending trendline resistance. The 145.000–145.100 zone acts as a strong resistance area where price has repeatedly reversed.
The recent upward move appears to be a weak pullback, lacking the momentum to break the previous bearish structure. If price continues to be rejected at this zone, a likely correction towards the 142.100 support area is expected.

USDJPY Trade Recommendation – Second SELL Entry (15-Min Chart)🔻 Strategy: Continue selling with the short-term downtrend, entering on technical pullback
🎯 Trade Setup:
Sell Entry Zone: 143.94 – 144.00
Stop Loss (SL): 144.45 (just above SMA89 and minor resistance zone)
Take Profit (TP): 143.28 – 143.36
Risk:Reward Ratio: Approx. 1:2.5 to 1:3
📊 Technical Analysis:
1. Trend Direction:
The market is clearly in a short-term downtrend on the 15-minute timeframe.
Price has been forming lower highs and lower lows, indicating strong bearish pressure.
2. Dynamic Resistance – SMA89:
SMA89 (red line) is acting as dynamic resistance, consistently rejecting price.
The entry zone aligns with previous minor resistance and the down-sloping SMA, making it ideal for re-entry short positions.
3. Target Zone – Technical Support:
TP zone (143.28 – 143.36) is a recent swing low/support level, likely to be revisited if bearish momentum continues.
=> Fl and tradding with me!

USDJPY – Momentum Fades Near 146 BarrierUSDJPY is approaching the significant resistance level at 146.020 following a parabolic rebound. This area previously triggered a sharp sell-off, and a minor double top pattern may be forming. If price gets rejected here, the support zone around 144.470 (EMA89 + demand zone) becomes a likely target for a pullback.
The recent upside was supported by hawkish comments from BoJ Governor Ueda, but the main market focus remains on the U.S.–China trade talks. If tensions ease, the USD could weaken, supporting the bearish scenario for USDJPY.
