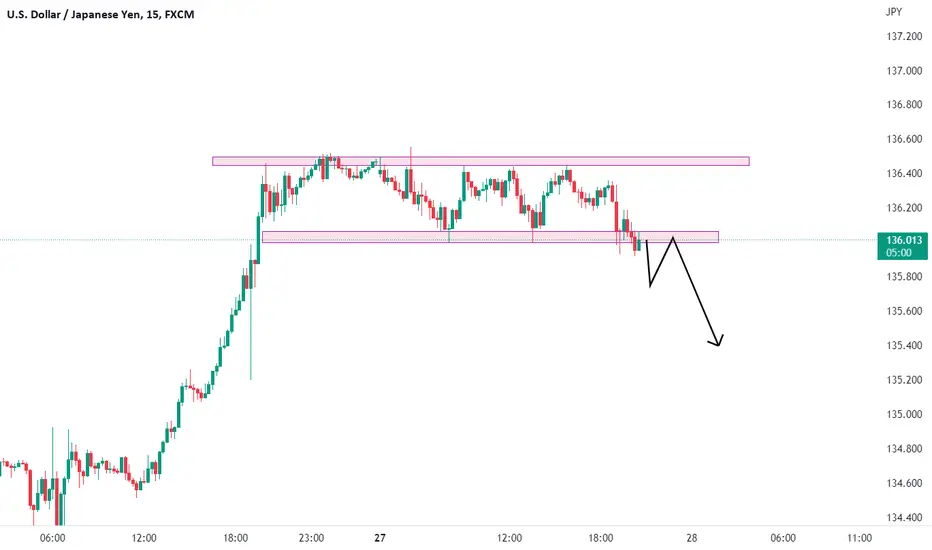
This is a trade idea for USDJPY.1. This idea is based on pure market structure and order flow.
2. Trade according to your risk tolerance.
Not an investment advise.
Usdjpyforecast

USD JPY Pullback expected !!!The price has cleared 151 lvl and halting near the resistance 151.950 or 152 as rd fig
this resistance is monthly high
expected the price to go sideways and make a build up before making the breakout
also as decided in the post of DXY, similarly here some fair value area are let behind after strong one side up move
149.700 to 149.550 there is good fvg to trade on
thereafter 148.300 148.900 which is little less probable to see upto next week
(only there is no breakout above 152 level)

USD JPY trade setup price is reversing from 149.578 without testing resistance which mean a lack of buying liquidity
the following previous green long candles left behind imbalance which have created fair value area
with applying fib to draw the PD area
149 to 148.781 is above discount zone which will hold less impact
whereas 148.500 to 148.300 is the zone where we can look for trade and for the target of 149.995 and stop loss based on risk taking capability

Usdjpy long possible Scalping usdjpy buy 148.296
Stop loss 147.610
Take profit 150.107
Lot size recommended 0.01 for 100 usd equity
Lot size recommended 0.10 for 1000 usd equity
Lot size recommended 1 lots for 10000 usd equity open this trade and thanks me later✌️✌️✌️✌️✌️

USDJPY R:R :1:4 FOMCThis is for short term
Marked Possible Buy zone
Wait for FOMC release
Once Reached Entry zone Look for Liquidity sweep and BOS in LTF then Enter
And this is risky too.
Please DYOR before entering the trade.

USD-JPY Trade Setupprice is at resistance zone of 151.144 and 151.380
after the recent break of structure there is open order block to restest
also there will be small liquid or inducement zone that need to be triggered
for next upside
150.432 and 150.246 is the buying area
with stop loss of 150 rd figure
and target of 151.500
with risk to reward 1:3
condition to avoid if price reach 151.500 first before coming towards our buying zone then the trade we be cancelled

USDJPY 1DUS dollar from past few months have been very strong , but finally it has reached to the 151 level in USDJPY pair also this is a psychological level which is a strong resistance zone for the price , can sell now and aim for 1:2RR

USDJPYFX:USDJPY
As you can see that, USDJPY has formed a good resistance in 15min Time frame, if it gives breakout then we can plan for buy side. Take retest entry and plan your trade accordingly.... This trade is for monday (25-09-23).....

USD JPY LONGSept #2 Trade :
Risk 0.5%
TP1 = 1:2 RR
Disclaimer:
The contents in this Idea are intended for information purpose only and do not constitute investment recommendation or advice. Nor are they used to promote any specific products or services. They serve as an integral part of a case study to demonstrate fundamental concepts in risk management under given market scenarios. A full version of the disclaimer is available in our profile description.

breakdown ?? real or fake usdjpy has been rallying all the way from april and a little bearish move during 6-13 jul 23
now the price has reached almost to the previous high and resistance zone on daily time frame
we noticed the price has created the evening star pattern (bearish)
and on medium time frame price a made impluse movement seems like liqudity grab
and with two candle previous 5-6 candles got overlapped from resistance (bearish)
price was forming a flag and pole like pattern and looked failed as price tried to breakout but it got rejected and came back into the zone of flag (bearish)
the actual breakdown will occur after the level of 144.500 is taken down
it is the higher low swing and closing below this level it will indicated selling pressure and change of trend

USDJPYFX:USDJPY
As you can see that, In 1Hr Time frame USDJPY has created a head and shoulder pattern. if it breaks the drawn neckline level then we can plan for sell side. This set-up is for monday (21-08-23) Plan your trade accordingly....

USD/JPY the two ways to trade (long and short) logic1. for pullback trader or people on short side will trade based on lower low and lower high formation
but price movement on down side is bit slow and steady
if price reacts on 2nd poi but,
does not break the recent (internal lower low) of 141.500
and makes higher low this make the short trade very choppy mind exhaustion
2. for long side trader price might defend the low of 141.500 well and breaks above the both POI wait for the retracement
or
let the price complete the chart pattern of CUP AND HANDLE
(well the chart pattern is just a assumption do not trade before the completion)
My Today's Learning
candle CLOSE & pattern COMPELETION is the key

USD/JPY Trade Setup1. Trade pullback ?
>>> let price get back to POI for entry with sl above POI
(offers good R:R)
>>> follow the lower high lower lows pattern
>>> exit on price switching to higher low
2. Conservative Trade ?
>>> wait for the price to get a DISCOUNTED ZONE
(fib 0.5 from recent swing low to high)
>>> long on swing making higher low and higher high
(avoid entering direct on 0.5 without confluence)
(previous trade got out with small SL, then we saw a parabolic upside this is why sl is important)

USDJPY – What's the intervention threshold? USDJPY – What's the intervention threshold?
In September of last year, the Bank of Japan (BOJ) made a move in the market to strengthen its currency when it reached 145 against the USD, marking the first such intervention since 1998. This action was taken following the BOJ's decision to maintain an extremely accommodative policy (a policy that is yet to change still). The BOJ intervened once more in October when the yen further plummeted to its lowest level in 32 years, reaching 151.94 against the dollar.
At present, investors hold a substantial short position in the yen, valued at $9.793 billion, representing the largest such position in the USDJPY since May 2022. This value has nearly doubled in just the past three months. Notably, former Japanese Vice Finance Minister Eisuke Sakakibara has suggested that the USDJPY could reach 160 before the BOJ intervenes once again.
However, the USDJPY has recently built a bit of a buffer between itself and whatever the intervention threshold is for the BoJ. Over the past two trading days, the US dollar has weakened, largely due to remarks made by Federal Reserve officials. These statements have strengthened the belief that the US central bank is nearing the end of its tightening phase.
It is widely anticipated that Fed policymakers will implement a rate increase during their upcoming meeting this month, which would set the policy rate range at 5.25% to 5.50%. However, the timing of any subsequent rate hikes remains uncertain. There are questions whether they will raise rates again in September, delay until November, or maintain the current stance and allow inflation to naturally subside over time.
Consequently, the US dollar has experienced a decline against the yen, reaching a low of 141.32 yen, the lowest level observed since June 21. Currently, it is down 0.5% at 141.328. This drop follows a decrease of nearly 1.3% seen last Friday when the US nonfarm payrolls for June fell short of market expectations at 209,000.

USDJPYFX:USDJPY
As you can see that, From past 1week USDJPY is in uptrend and now it is going to take some consolidation and pullback like SMC. Created a horizontal good support and it is good to scalp and capture some pips. take retest entries. plan your trade accordingly....

USDJPY longFX:USDJPY
As we can see that USDJPY has created an Inverted Head and Shoulders in 1HR Time frame, If it breaks the neckline and again it retest the level then we can plan for buy side. Plan your trade accordingly...

USDJPY Analysis wait for breakdown or rejection and candlestick USDJPY Analysis wait for breakdown or rejection and candlestick pattern

USDJPY Upward movement Potential with RISK:REWARD 4Symbol USD jPY
Time frame 2 hours
Analysis; Break out from the down Trend movement.
Buy at 131.023 stop loss 130.55 target is 132.8
risk 2 reward ratios 4.8
NOTE: Published Ideas are for ‘’EDUCATIONAL PURPOSE ONLY’’ trade at your own risk.
NOTE: RESPECT The risk. SL should not be more than 2% of the capital.
Happy Trading

USDJPY longFX:USDJPY
As you can see USDJPY has created a channel and it already given a breakout in 4HR timeframe, wait for pull back and taken entry on buy side. plan your trade accordingly...

USDJPY longFX:USDJPY
As we can see in usdjpy a strong trendline breakout happend in 1hr and we can plan for buy side if it retest. plan your trade accordingly.

USDJPY ShortFX:USDJPY
A Good Consolidation flag breakout has seen in USDJPY, if it gives breakout and retest then take entry.
plan your trade accordingly and manage your risk to reward ratio.
USDJPY NEXT MOVE ANALYSIS FOREX TRADINGUSDJPY FORECAST
its just an idea based on what i see in the chart
trade what you see not what you feel
follow the trend
good luck

#USDJPY Inverted Head and Shoulder formationAs seen in monthly chart of USDJPY, inverted head and shoulder is formed. Breakout above 127.50/128 with volumes will make it run to multi decade highs.
Likely scenario: With current global inflation, BOJ is forced to abandon its yield curve control strategy, that brings the yen devaluation option to the forefront.
God bless us all!!!
