USD/JPY Rising Wedge Forming – Watch for Possible Reversal AheadUSD/JPY is trading around 153.42 on the 4-hour chart, forming a rising wedge pattern, a structure that often signals a potential bearish reversal after an extended uptrend.
The pair has been climbing within this narrowing channel since mid-October, creating higher highs and higher lows. However, recent price action shows rejection near the upper trendline, followed by a pullback toward the lower support trendline. The 9-period SMA remains slightly upward but momentum appears to be weakening.
If price breaks below the lower wedge support near 153.00, we could see a deeper retracement toward 152.30 and 151.80. On the flip side, a strong bullish breakout above 154.50 would invalidate the wedge pattern and signal renewed buying interest, possibly targeting 155.00 and beyond.
Trading Plan:
📉 Sell below 153.00 → Targets: 152.30 / 151.80, Stop Loss: 153.70
📈 Buy above 154.50 → Targets: 155.00 / 155.40, Stop Loss: 153.90
Pattern: Rising Wedge
Bias: Cautiously Bearish unless price breaks above 154.50
Timeframe: 4H
📊 USD/JPY is approaching a critical point — stay alert for a confirmed breakout or breakdown before entering new positions.
Usdjpysetup

USD/JPY 4H Chart Analysis – Bullish Breakout Ahead?📈 USD/JPY 4H Chart Analysis – Bullish Breakout Ahead? 🚀💹
The USD/JPY pair is currently approaching a critical resistance zone (145.800 - 146.000), which has acted as a strong supply area in the past. The price has shown bullish momentum as it builds higher lows and heads toward this resistance.
🔍 Key Observations:
🔵 Resistance Zone: Clearly marked and tested multiple times. A breakout above this level could trigger a bullish continuation.
📊 Bullish Structure: The pair is forming a strong uptrend with higher highs and higher lows on the 4H timeframe.
🔄 Retest Scenario: Chart suggests a potential breakout above the resistance, followed by a bullish retest before continuing toward the target zone at ~148.900.
🟢 Upside Target: 148.900 (Previous swing high) – a potential gain of over 300 pips from breakout point.
📌 Trading Outlook:
✅ A confirmed breakout and retest of the resistance zone could offer a high-probability long setup.
❌ A failure to break and hold above the resistance may result in short-term consolidation or reversal.
📅 Watch Levels:
Resistance: 145.800 – 146.000
Support (breakout retest): 145.200 – 145.500
Bullish Target: 148.900
📢 Conclusion: Bulls are in control as long as price sustains above the resistance zone. A clean breakout followed by a retest could offer an attractive buying opportunity with a well-defined risk-to-reward setup. 🔥📊

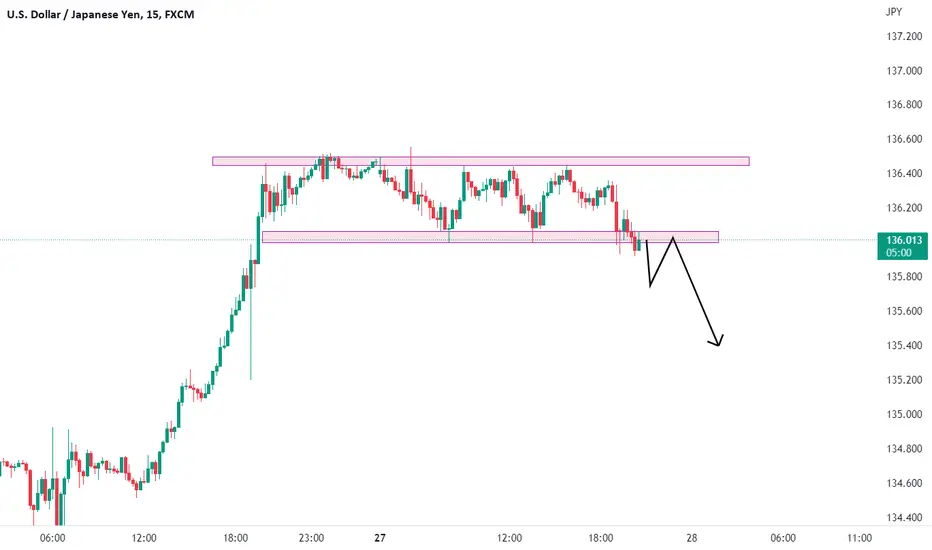
KEY SUPPORT IN FOCUS - CAN USDJPY HOLD THE LINE?Symbol - USDJPY
USDJPY is approaching a critical support level amid a prevailing local downtrend. Downward pressure on the US dollar continues to intensify, reinforcing the bearish momentum in the pair.
The US dollar index has begun to decline, which is mirrored in the weakening of USDJPY. Selling pressure is gaining momentum, and a local downtrend is clearly forming. The pair is currently testing key support at 144.82. A confirmed break below this level would likely pave the way toward lower support zones at 143.44 and 142.35, Sustained price action below 144.82 may act as a trigger for an extended sell-off.
Key Resistance levels: 145.34, 146.07
Key Support levels: 144.82, 143.44, 142.35
Both global and local trends remain bearish. The ongoing decline in the dollar may serve as an additional resistance factor, contributing to further downward momentum. A break and consolidation below the 144.82 support level would likely confirm the continuation of the bearish trend.
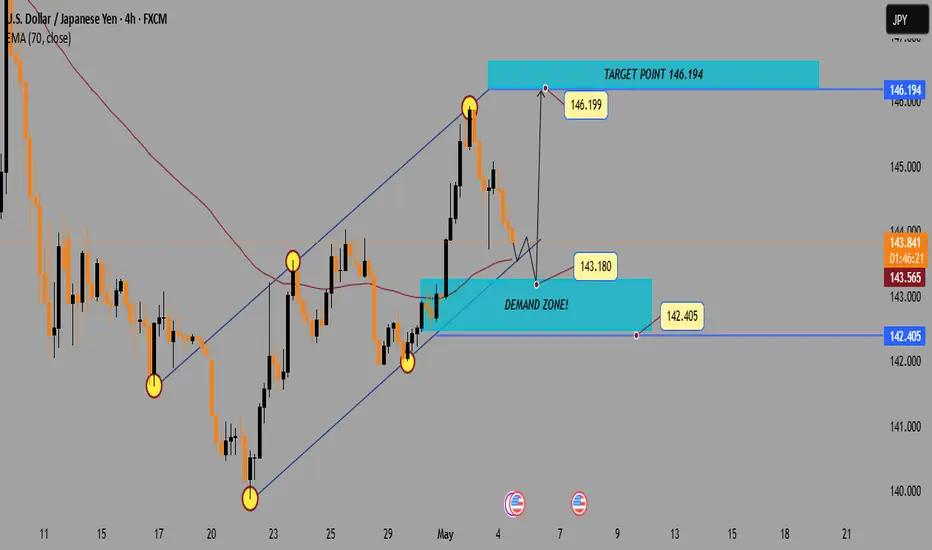
USD/JPY4H Analysis:Demand Zone ReTest Before Bullish Continuatio1. Trend Channel
🔼 Uptrend: The pair is moving inside an ascending channel.
▪️ Support: Lower boundary of the channel.
▪️ Resistance: Upper boundary of the channel.
2. Recent Price Action
🔴 Pullback: After reaching the top at 146.199, price is retracing.
📉 Price is now heading toward the Demand Zone.
3. Demand Zone
🟦 Demand Zone (142.405 – 143.180):
This zone could act as a strong support
Buyers might step in here
Watch for bullish patterns or rejections around this area
4. EMA 70
📏 EMA 70 (143.568) is slightly below current price (143.949) — this may offer temporary support/resistance.
5. Target
🎯 Target Point: 146.194
If price bounces from demand zone, this is the next bullish target.
Possible Scenario
1. 🔽 Price dips into the Demand Zone
2. 🟢 Bullish bounce → Confirm with candlestick signals
3. 🚀 Upside move targeting 146.194
USD/JPY Bearish Trade Setup – SBR + DBD Zone Rejection📉 Trend Analysis:
🔴 Downtrend confirmed by lower highs and lower lows.
📉 Descending trendline indicates continuous bearish pressure.
🔹 Key Levels & Zones:
🔵 Resistance Zone (SBR + DBD) – 144.123 📍 (Sell Entry Point)
🟠 Stop Loss – 145.209 🚫 (Above resistance to avoid fake breakouts)
🟢 Target Point – 139.694 🎯 (Strong support area)
🏹 Expected Price Action:
🔸 Scenario:
🔺 Price moves up toward the resistance zone (🔵 SBR + DBD Zone)
🔻 Bears take control (Rejection expected)
⚡ Drop towards target at 139.694
📊 Trade Plan:
✅ Entry – Wait for rejection at 144.123 (🔵)
✅ Stop Loss – Keep at 145.209 (🛑🔺)
✅ Take Profit – Aim for 139.694 (✅🎯)
💡 Risk-Reward Ratio: Good (More reward than risk)

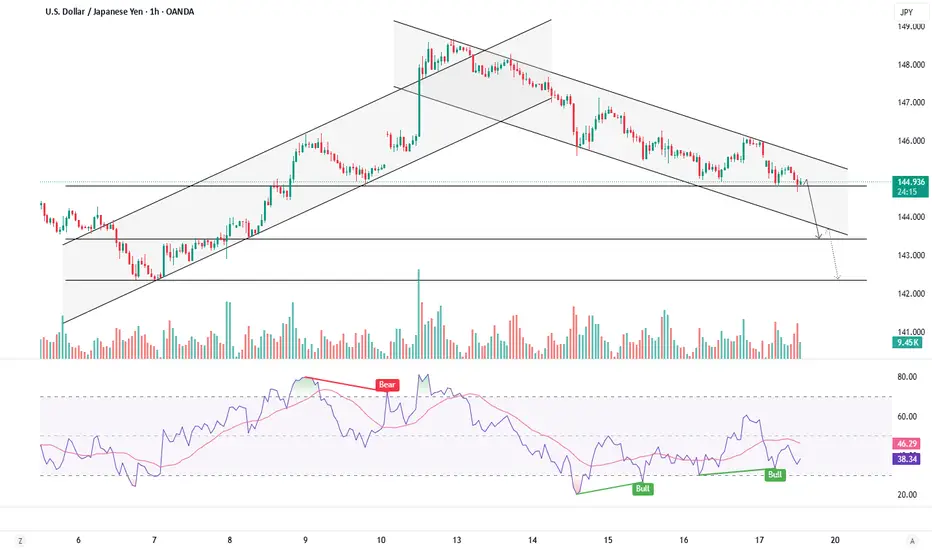
USDJPY- ATTEMPTING TREND REVERSALSymbol - USDJPY
CMP - 148.87
The USDJPY is currently in a corrective phase, retesting the previously breached downtrend boundary. The market is attempting to break this trend amidst a broader correction of the US dollar.
The dollar is facing significant challenges due to various economic and geopolitical factors in the United States, coupled with persistently high inflation. In light of these conditions, the US dollar Index may continue to experience a deeper correction, as expectations for interest rate cuts could be extended, potentially exerting further pressure on the markets.
Earlier, the currency pair attempted to overcome the resistance of the downtrend and succeeded, yet this move alone is insufficient to confirm a trend reversal; additional confirmation is required.
Support levels: 148.92, 148.21
Resistance levels: 150.16, 150.95
If the bulls manage to maintain support above the 148.92 - 149.5 range, there is a promising opportunity for a potential trend reversal. A move towards the 150.16 resistance level, followed by a breakout and sustained price action above this level, would serve as confirmation of the trend shift.
USDJPY - TRADING AT SUPPORT LEVELSSymbol - USDJPY
USDJPY has encountered support and appears to have staged a false breakdown of the lower boundary of the prevailing local trend. At present, the dollar is strengthening, which could present an opportunity for the currency pair to appreciate. The price is consolidating in a strong support zone, and the fundamental environment has been volatile recently, with a predominant influence from U.S. economic factors. Meanwhile, the prospect of interest rate hikes in Japan has largely been disregarded, with market participants focusing more on economic data from the West.
From a technical perspective, there are two potential triggers on the chart: one signaling a buy and the other signaling a sell. However, given the prevailing upward global and local trends, the preference is to take a long position. Should the currency pair manage to secure a close above the 151.90 - 151.95 range, we can anticipate further upward movement towards the target levels shown on the chart in both the short and medium terms.
Resistance levels: 151.95, 153.70, 154.00
Support levels: 151.00, 149.52
However, if the dollar continues its correction and the bulls fail to maintain the false support breakdown, a price return to 150.95 could trigger a support break, leading to a potential decline towards 148.60

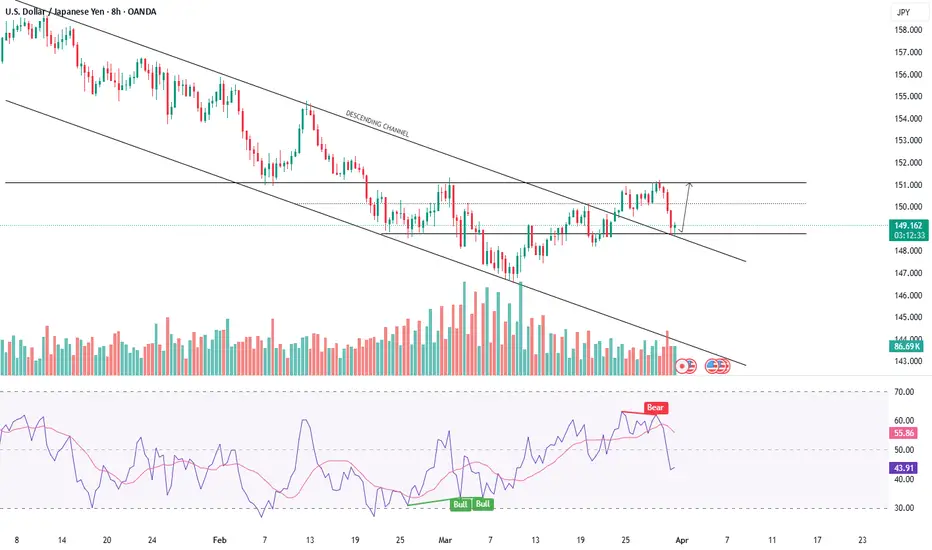
USDJPY - RETEST OF SUPPORT BREAKDOWN. SELLING AHEAD?Symbol - USDJPY
USDJPY is unable to maintain its uptrend for the time being. Speculation about potential actions from the Bank of Japan is expected to surface. Meanwhile, the US dollar continues to strengthen. The 158.45 level represents a significant resistance formed by bears, who are still exerting pressure on the market. This week, we anticipate active measures from the Bank of Japan, particularly an interest rate hike. While such actions are relatively rare, they could provide strong support for the currency pair. If Japan proceeds with this move, the pair may continue its correction from the 0.5 - 0.7 Fibonacci levels. In this case, key targets could include the zones at 153.25 and 152
Resistance levels: 156.55, 157.22
Support level: 155
A price drop below 155 could trigger aggressive selling. The rate decision in Japan is set for Friday, and until then, the price may remain in a consolidation phase.

USDJPY Trade SetupThis is for short term trade.
Reason for the trade
1.Its not break the demand.
2.Its respected the QML line.
3.Still the trend is in up in HTF
Please do your own research before entering the trade

USDJPYThis is for short term.
Its a counter trend trade.
Order block with imbalance.
Trendline liquidity.
Do your own research before entering the trade.

USDJPY 1H BUY PROJECTION 19.09.24Reason for Bullish
USDJPY Correlation
In fact, what drives the USD/JPY pair the most is monetary policy divergence between the Fed and the BoJ and risk sentiment. In normal times, when there's risk on sentiment you can see the USD/JPY appreciating all else being equal, while during risk off flows you can see the JPY gaining strength.

USDJPY Lastwave - Big Drop SoonUSDJPY 1D Timeframe Projection
DISCLAIMER: All labelling and wave counts are done by me manually and I will keep changing according to the LIVE MARKET PRICE ACTION. So don't be bias, hope on my trade plans...try to learn, and make your strategy... Following is not that easy...

USDJPY May 27, 2024 Has the price started to rise?Looking at the H1 chart we see that the price is in wave 4
- Wave 4 target at price range 156.55
- Then the price continues wave 5 with wave targets at 157.4 and 157.83
We watch to buy at 156.55 after the candlestick reversal signal appears
Note: Sufficient TP, SL to be safe and win the market‼ ️Change data plan will be updated later.
Deekop's analysis is only a personal opinion with a desire to share its views with the community. I'm not always right. But my analysis always reflects my meticulous evaluation of what is best for an investment.

USDJPY week 3, May 2024 Can the uptrend last long?Hello everyone, DEEKOP is ready to bring the most accurate signals and assessments to everyone.
Financial freedom is true freedom.
With the BOJ's intervention becoming increasingly clear, people are expecting the BOJ to increase interest rates 3 times this year and will begin the first increase in June.
We use the Elliot principle to analyze the USDJPY chart
We see both the big wave level in purple and the small wave level in blue, meaning the price is completing wave 5. Deekop measured the expected goal of completing wave 5 in two price ranges, the price range 159.2 and the price range 164.3. At these price zones, there may be a reversal zone, then the USDJPY price will enter the ABC correction wave.
This is my plan for next week, the order entry area will be updated daily based on market fluctuations next week.
Note: Sufficient TP, SL to be safe and win the market‼ ️Change data plan will be updated later.
Deekop's analysis is only a personal opinion with a desire to share its views with the community. I'm not always right. But my analysis always reflects my meticulous evaluation of what is best for an investment.

USD JPY Pullback expected !!!The price has cleared 151 lvl and halting near the resistance 151.950 or 152 as rd fig
this resistance is monthly high
expected the price to go sideways and make a build up before making the breakout
also as decided in the post of DXY, similarly here some fair value area are let behind after strong one side up move
149.700 to 149.550 there is good fvg to trade on
thereafter 148.300 148.900 which is little less probable to see upto next week
(only there is no breakout above 152 level)


USDJPYFX:USDJPY
As you can see that, USDJPY has formed a good resistance in 15min Time frame, if it gives breakout then we can plan for buy side. Take retest entry and plan your trade accordingly.... This trade is for monday (25-09-23).....

USDJPYFX:USDJPY
As you can see that, In 1Hr Time frame USDJPY has created a head and shoulder pattern. if it breaks the drawn neckline level then we can plan for sell side. This set-up is for monday (21-08-23) Plan your trade accordingly....

USD/JPY the two ways to trade (long and short) logic1. for pullback trader or people on short side will trade based on lower low and lower high formation
but price movement on down side is bit slow and steady
if price reacts on 2nd poi but,
does not break the recent (internal lower low) of 141.500
and makes higher low this make the short trade very choppy mind exhaustion
2. for long side trader price might defend the low of 141.500 well and breaks above the both POI wait for the retracement
or
let the price complete the chart pattern of CUP AND HANDLE
(well the chart pattern is just a assumption do not trade before the completion)
My Today's Learning
candle CLOSE & pattern COMPELETION is the key

USD/JPY Trade Setup1. Trade pullback ?
>>> let price get back to POI for entry with sl above POI
(offers good R:R)
>>> follow the lower high lower lows pattern
>>> exit on price switching to higher low
2. Conservative Trade ?
>>> wait for the price to get a DISCOUNTED ZONE
(fib 0.5 from recent swing low to high)
>>> long on swing making higher low and higher high
(avoid entering direct on 0.5 without confluence)
(previous trade got out with small SL, then we saw a parabolic upside this is why sl is important)

USDJPYFX:USDJPY
As you can see that, From past 1week USDJPY is in uptrend and now it is going to take some consolidation and pullback like SMC. Created a horizontal good support and it is good to scalp and capture some pips. take retest entries. plan your trade accordingly....

USDJPY longFX:USDJPY
As you can see USDJPY has created a channel and it already given a breakout in 4HR timeframe, wait for pull back and taken entry on buy side. plan your trade accordingly...

USDJPY ShortFX:USDJPY
A Good Consolidation flag breakout has seen in USDJPY, if it gives breakout and retest then take entry.
plan your trade accordingly and manage your risk to reward ratio.