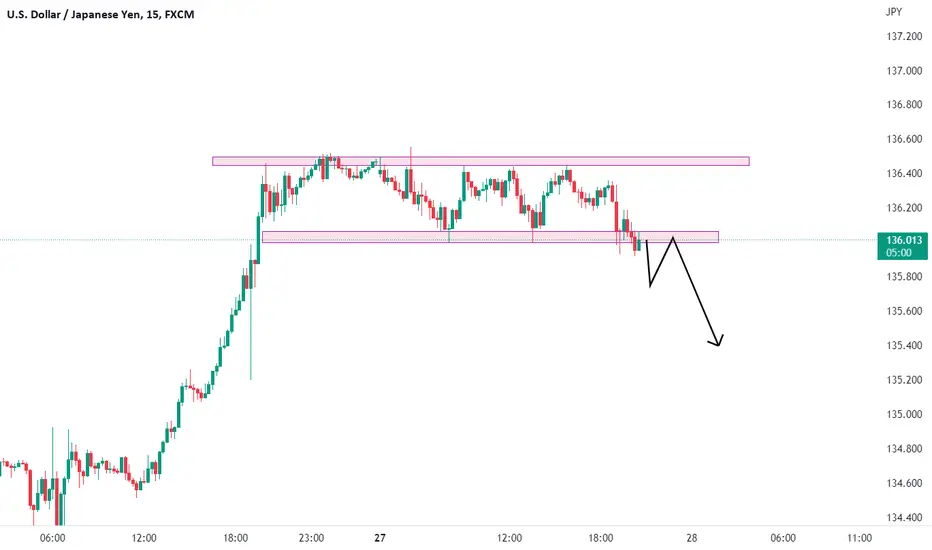
USDJPY Trade SetupThis is for short term trade.
Reason for the trade
1.Its not break the demand.
2.Its respected the QML line.
3.Still the trend is in up in HTF
Please do your own research before entering the trade
Usdjpysetup

USDJPYThis is for short term.
Its a counter trend trade.
Order block with imbalance.
Trendline liquidity.
Do your own research before entering the trade.

USDJPY 1H BUY PROJECTION 19.09.24Reason for Bullish
USDJPY Correlation
In fact, what drives the USD/JPY pair the most is monetary policy divergence between the Fed and the BoJ and risk sentiment. In normal times, when there's risk on sentiment you can see the USD/JPY appreciating all else being equal, while during risk off flows you can see the JPY gaining strength.

USDJPY Lastwave - Big Drop SoonUSDJPY 1D Timeframe Projection
DISCLAIMER: All labelling and wave counts are done by me manually and I will keep changing according to the LIVE MARKET PRICE ACTION. So don't be bias, hope on my trade plans...try to learn, and make your strategy... Following is not that easy...

USDJPY May 27, 2024 Has the price started to rise?Looking at the H1 chart we see that the price is in wave 4
- Wave 4 target at price range 156.55
- Then the price continues wave 5 with wave targets at 157.4 and 157.83
We watch to buy at 156.55 after the candlestick reversal signal appears
Note: Sufficient TP, SL to be safe and win the market‼ ️Change data plan will be updated later.
Deekop's analysis is only a personal opinion with a desire to share its views with the community. I'm not always right. But my analysis always reflects my meticulous evaluation of what is best for an investment.

USDJPY week 3, May 2024 Can the uptrend last long?Hello everyone, DEEKOP is ready to bring the most accurate signals and assessments to everyone.
Financial freedom is true freedom.
With the BOJ's intervention becoming increasingly clear, people are expecting the BOJ to increase interest rates 3 times this year and will begin the first increase in June.
We use the Elliot principle to analyze the USDJPY chart
We see both the big wave level in purple and the small wave level in blue, meaning the price is completing wave 5. Deekop measured the expected goal of completing wave 5 in two price ranges, the price range 159.2 and the price range 164.3. At these price zones, there may be a reversal zone, then the USDJPY price will enter the ABC correction wave.
This is my plan for next week, the order entry area will be updated daily based on market fluctuations next week.
Note: Sufficient TP, SL to be safe and win the market‼ ️Change data plan will be updated later.
Deekop's analysis is only a personal opinion with a desire to share its views with the community. I'm not always right. But my analysis always reflects my meticulous evaluation of what is best for an investment.

USD JPY Pullback expected !!!The price has cleared 151 lvl and halting near the resistance 151.950 or 152 as rd fig
this resistance is monthly high
expected the price to go sideways and make a build up before making the breakout
also as decided in the post of DXY, similarly here some fair value area are let behind after strong one side up move
149.700 to 149.550 there is good fvg to trade on
thereafter 148.300 148.900 which is little less probable to see upto next week
(only there is no breakout above 152 level)


USDJPYFX:USDJPY
As you can see that, USDJPY has formed a good resistance in 15min Time frame, if it gives breakout then we can plan for buy side. Take retest entry and plan your trade accordingly.... This trade is for monday (25-09-23).....

USDJPYFX:USDJPY
As you can see that, In 1Hr Time frame USDJPY has created a head and shoulder pattern. if it breaks the drawn neckline level then we can plan for sell side. This set-up is for monday (21-08-23) Plan your trade accordingly....

USD/JPY the two ways to trade (long and short) logic1. for pullback trader or people on short side will trade based on lower low and lower high formation
but price movement on down side is bit slow and steady
if price reacts on 2nd poi but,
does not break the recent (internal lower low) of 141.500
and makes higher low this make the short trade very choppy mind exhaustion
2. for long side trader price might defend the low of 141.500 well and breaks above the both POI wait for the retracement
or
let the price complete the chart pattern of CUP AND HANDLE
(well the chart pattern is just a assumption do not trade before the completion)
My Today's Learning
candle CLOSE & pattern COMPELETION is the key

USD/JPY Trade Setup1. Trade pullback ?
>>> let price get back to POI for entry with sl above POI
(offers good R:R)
>>> follow the lower high lower lows pattern
>>> exit on price switching to higher low
2. Conservative Trade ?
>>> wait for the price to get a DISCOUNTED ZONE
(fib 0.5 from recent swing low to high)
>>> long on swing making higher low and higher high
(avoid entering direct on 0.5 without confluence)
(previous trade got out with small SL, then we saw a parabolic upside this is why sl is important)

USDJPYFX:USDJPY
As you can see that, From past 1week USDJPY is in uptrend and now it is going to take some consolidation and pullback like SMC. Created a horizontal good support and it is good to scalp and capture some pips. take retest entries. plan your trade accordingly....

USDJPY longFX:USDJPY
As you can see USDJPY has created a channel and it already given a breakout in 4HR timeframe, wait for pull back and taken entry on buy side. plan your trade accordingly...

USDJPY ShortFX:USDJPY
A Good Consolidation flag breakout has seen in USDJPY, if it gives breakout and retest then take entry.
plan your trade accordingly and manage your risk to reward ratio.
USDJPY TRADING SETUPUSDJPY is trading at supply zone at all important time frames which is High Resistance Level.
At 4hr and 1D Double top pattern has been formed which is extremely bearish in nature.
A range has been formed in 1HR time frame.
Looking for breakdown of that range that I have marked in Rectangle. As range breaks, with confirmation of volume and candle, I will enter the trade with stop loss at Resistance i.e high of Rectangle.
With breaks upside then wait for price action to form. No buy trade in USDJPY.
ENTRY=138.33
TARGET=136.34
SL=138.90
COMMENT BELOW YOUR IDEA
GIVE A LIKE IF YOU AGREE WITH MY SETUP

USDJPY potential mark down phase starting we have got extended move to the downside, + we have even achieved 3x ADR + 3(psychological no.) pushes to the upside market makers have formed sweet M which tells we are going to mark down phase

USDJPY ForecastUSDJPY Forecast
IMO
Give a Like and Feel free to share your opinions in the comment!
Happy Trading 😊

USDJPY longUSDJPY long
Risk/Reward: 1:3
Give a Like and Feel free to share your opinions in the comment!
Happy Trading 😊


USDJPYDear traders,
As I have been accustomed to in recent months and this time my technical analysis had an accuracy rate of over 95% and I will try to continue to keep this percentage as long as possible
As I said in the last weeks ..,UJ forced the Fibonacci 0.5 zone from where it rejected and re-entered the range zone we were talking about in the past weeks!
I still bet on a descent to the 108,460 area and from there UP AGAIN
however ... a closure even for 1 day over the 111,000 area makes me think again of BUY up to the 12,800 area which is my final target for this period!
THIS WEEK...as I said last week, the UJ is forcing the 0.5 Fibonacci zone, which it could retest in the next period.
now it is in a period of range and I will wait to see how it closes this month!
A monthly closure over Fibonacci 0.5 even for 1 day will make me think of BUY up to the Fibonacci 618 undfe area ... DOWN AGAIN!
a rejection from the Fibonacci 0.5 area and a close below this area will keep my idea of SELL for at least 150-200 pips
NOTE: Please, give a LIKE if you find this idea useful!
GREAT ATTENTION:
*This information is not a Financial Advice.

USDJPY
Dear traders,
As I have been accustomed to in recent months and this time my technical analysis had an accuracy rate of over 95% and I will try to continue to keep this percentage as long as possible
As I said in the last weeks .., UJ has forced the trend line formed in recent years and strongly rejected!
UJ is in a range area between 110,200 and 108,200 but as you can see from the trend line for 1 week and from the Fibonacci for 1 month ... it is a lowering range reason why I will continue to look for SELL even if UJ will test the trend line again! |
However ... a close even for 1 day above the trend line forces me to think of BUY until the Fibonacci 0.5 area from where ... DOWN AGAIN
THIS WEEK...UJ forced the Fibonacci 0.5 zone from where it rejected and re-entered the range zone we were talking about in the past weeks!
I still bet on a descent to the 108,460 area and from there UP AGAIN
however ... a closure even for 1 day over the 111,000 area makes me think again of BUY up to the 12,800 area which is my final target for this period!
NOTE: Please, give a LIKE if you find this idea useful!
GREAT ATTENTION:
*This information is not a Financial Advice.
