#USD/JPY Buy Trade Scenario.Here’s an up-to-date USD/JPY Buy trade outlook (technical + fundamental) to help you assess whether positioning for a Upside makes sense right now.
Thank You......
Usdjpysignal

USD/JPY Rising Wedge Forming – Watch for Possible Reversal AheadUSD/JPY is trading around 153.42 on the 4-hour chart, forming a rising wedge pattern, a structure that often signals a potential bearish reversal after an extended uptrend.
The pair has been climbing within this narrowing channel since mid-October, creating higher highs and higher lows. However, recent price action shows rejection near the upper trendline, followed by a pullback toward the lower support trendline. The 9-period SMA remains slightly upward but momentum appears to be weakening.
If price breaks below the lower wedge support near 153.00, we could see a deeper retracement toward 152.30 and 151.80. On the flip side, a strong bullish breakout above 154.50 would invalidate the wedge pattern and signal renewed buying interest, possibly targeting 155.00 and beyond.
Trading Plan:
📉 Sell below 153.00 → Targets: 152.30 / 151.80, Stop Loss: 153.70
📈 Buy above 154.50 → Targets: 155.00 / 155.40, Stop Loss: 153.90
Pattern: Rising Wedge
Bias: Cautiously Bearish unless price breaks above 154.50
Timeframe: 4H
📊 USD/JPY is approaching a critical point — stay alert for a confirmed breakout or breakdown before entering new positions.

USD/JPY) LOGN TIME Analysis Read The captionSMC trading point update
Technical analysis of USD/JPY on the daily timeframe, highlighting a long-term downtrend reversal with potential for significant upside.
---
Analysis Summary
Pair: USD/JPY
Timeframe: Daily
Current Price: 147.442
Bias: Bullish breakout from a descending wedge structure.
---
Key Technical Insights
1. Descending Trendline Break:
Price has broken above the long-term downtrend line, signaling a reversal.
Breakout area is circled in yellow, confirming bullish intent.
2. Trendline & Structure Support:
Multiple rejections from the ascending support trendline (marked by green arrows) confirm accumulation and higher lows.
3. 200 EMA as Dynamic Resistance/Support:
Price is now above the 200 EMA (147.920) — a bullish signal, turning resistance into support.
4. RSI (14):
RSI at 62.99, approaching overbought territory, but still has room to push further.
---
Target Point
Target: 158.951
Based on measured move from wedge breakout and historical resistance level.
---
Trade Setup Idea
Direction Entry Stop-Loss Target
Buy 147.40–147.60 Below 145.80 158.95
Mr SMC Trading point
---
Summary
This chart signals a major bullish breakout on USD/JPY, with the break of a year-long downtrend structure, reclaiming the 200 EMA. If this breakout sustains, price could aim for 158.95 in the coming weeks.
Please support boost 🚀 this analysis)

USD/JPY 4H Chart Analysis – Bullish Breakout Ahead?📈 USD/JPY 4H Chart Analysis – Bullish Breakout Ahead? 🚀💹
The USD/JPY pair is currently approaching a critical resistance zone (145.800 - 146.000), which has acted as a strong supply area in the past. The price has shown bullish momentum as it builds higher lows and heads toward this resistance.
🔍 Key Observations:
🔵 Resistance Zone: Clearly marked and tested multiple times. A breakout above this level could trigger a bullish continuation.
📊 Bullish Structure: The pair is forming a strong uptrend with higher highs and higher lows on the 4H timeframe.
🔄 Retest Scenario: Chart suggests a potential breakout above the resistance, followed by a bullish retest before continuing toward the target zone at ~148.900.
🟢 Upside Target: 148.900 (Previous swing high) – a potential gain of over 300 pips from breakout point.
📌 Trading Outlook:
✅ A confirmed breakout and retest of the resistance zone could offer a high-probability long setup.
❌ A failure to break and hold above the resistance may result in short-term consolidation or reversal.
📅 Watch Levels:
Resistance: 145.800 – 146.000
Support (breakout retest): 145.200 – 145.500
Bullish Target: 148.900
📢 Conclusion: Bulls are in control as long as price sustains above the resistance zone. A clean breakout followed by a retest could offer an attractive buying opportunity with a well-defined risk-to-reward setup. 🔥📊

USDJPY Bearish Continuation SetupTrend Analysis
The market is in a clear downtrend, evidenced by the sequence of lower highs and lower lows.
The descending trendline has been respected multiple times, acting as dynamic resistance.
🧠 Key Technical Factors
Rejection Zone (Supply Area):
The marked “Rejection Point” aligns with the confluence of the trendline resistance, 50 EMA (red), and historical supply.
Price attempted to break above but faced a strong rejection—signaling institutional sell interest.
EMA Confluence:
50 EMA (142.993) and 200 EMA (144.063) are both sloping downward.
Price is trading below both EMAs, confirming bearish momentum and trend continuation bias.
BOS (Break of Structure):
Multiple BOS levels marked, showing a consistent pattern of structure breaks to the downside.
Each rally is met with selling pressure, failing to create new highs.
🧩 Projected Price Action
Current retracement could retest the trendline/50 EMA before a potential continuation move downward.
Expectation is a lower high formation near the descending trendline followed by a bearish impulse.
🏹 Bias: Bearish
Traders might consider short opportunities around the 142.90–143.00 zone, targeting 142.00 and below, with stops just above the trendline/supply zone.
⚠️ Risk Note
A clean break and close above the trendline and 50 EMA would invalidate this setup and could lead to a shift in structure.

USD/JPY Bullish Setup – Demand Zone Buy Opportunity Toward 151.5🔍 Chart Overview (4H Timeframe):
Currency Pair: USD/JPY
Trend: 📈 Uptrend
EMA 70: 🔴 (144.776) – Price is trading above it = Bullish Bias
---
🟦 Demand Zone
📌 Zone: 144.804 – 146.324
💡 What it means: Strong buying interest expected here
🟢 Support line + EMA = Confluence zone!
---
✅ Entry Point:
📍 Between: 146.324 – 146.423
🎯 Best area for long (buy) position
📊 Wait for a pullback to this area before entering
---
❌ Stop Loss:
📉 Below demand zone
🔻 Range: 144.705 – 144.776
🛡️ Helps protect against unexpected drop
---
🎯 Target Point:
📈 151.500
🟩 Big reward area
🔥 Previous resistance zone = Ideal profit-taking point
---
🧭 Summary:
✅ Entry: 146.324
❌ Stop: 144.776
🎯 Target: 151.500
Risk-to-Reward: Excellent!

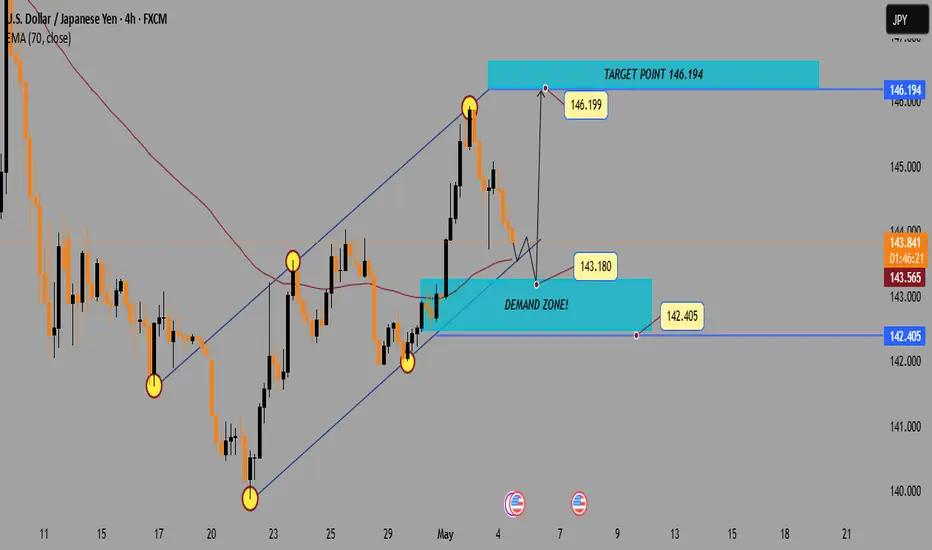
USD/JPY4H Analysis:Demand Zone ReTest Before Bullish Continuatio1. Trend Channel
🔼 Uptrend: The pair is moving inside an ascending channel.
▪️ Support: Lower boundary of the channel.
▪️ Resistance: Upper boundary of the channel.
2. Recent Price Action
🔴 Pullback: After reaching the top at 146.199, price is retracing.
📉 Price is now heading toward the Demand Zone.
3. Demand Zone
🟦 Demand Zone (142.405 – 143.180):
This zone could act as a strong support
Buyers might step in here
Watch for bullish patterns or rejections around this area
4. EMA 70
📏 EMA 70 (143.568) is slightly below current price (143.949) — this may offer temporary support/resistance.
5. Target
🎯 Target Point: 146.194
If price bounces from demand zone, this is the next bullish target.
Possible Scenario
1. 🔽 Price dips into the Demand Zone
2. 🟢 Bullish bounce → Confirm with candlestick signals
3. 🚀 Upside move targeting 146.194
USD/JPY) Bullish reversal analysis Read The ChaptianSMC Trading point update
Technical Analysis USD/JPY suggests a bullish outlook based on the following key technical components:
1. Buying Zone: The chart identifies a green rectangular area labeled "BUYING ZONE" just above the 200 EMA (blue line at 144.079). This implies that price retracement into this zone could be an opportunity to go long (buy).
2. Support & Resistance:
Support Level: Clearly marked around 143.00, showing a previous demand area.
Resistance Level: Around the 145.800–146.000 region, price previously rejected here.
3. Bullish Pattern: The curved arrow suggests the formation of a bullish continuation pattern (possibly a cup & handle or flag), with the expectation of a breakout toward the upside.
4. Target Point: The target is projected at 148.153, implying a potential move of approximately 291.7 pips from the buying zone—suggesting a favorable risk-reward ratio.
5. RSI Indicator: The RSI (Relative Strength Index) is currently around 55, not in the overbought zone, indicating more room for upside movement.
Mr SMC Trading point
Summary of Idea:
Strategy: Buy near 145.00–145.20 (Buying Zone).
Stop Loss: Just below the 200 EMA or the lower bound of the green zone.
Take Profit: Near the 148.153 target.
Confirmation: Wait for bullish confirmation/candlestick reversal in the buying zone.
Pelas support boost 🚀 analysis follow)

USDJPY Cup & Handle – Eyes on 147.883Entry Point: 143.525 (unchanged)
Stop Loss: 141.847 (unchanged)
Target Point One (TP1): 145.063 (unchanged)
Final Target (TP2): Now refined to 147.883 instead of 147.894 — a small, precise update.
📈 Pattern and Structure:
Cup-and-handle formation still intact, indicating a continuation pattern.
Support confirmation at the 143.5 zone, showing a potential base for a bullish reversal.
The chart shows strong upside projection toward the resistance band near 147.8–148.0, highlighted with the upper purple zone.
📊 Risk-Reward Profile:
Risk (Entry to SL): 143.525 – 141.847 = 1.678
Reward (Entry to TP2): 147.883 – 143.525 = 4.358
Reward-to-Risk Ratio: 4.358 / 1.678 ≈ 2.6R — a favorable risk/reward setup.
🧠 Trade Notes:
Entry is slightly above a demand zone.
First target is conservative, near a known resistance.
Final target aligns with prior highs and the broader ascending wedge’s upper bound.
Timing suggests the bullish push may unfold over the next few sessions (likely May 6–8 range, as curved arrow indicates a rounded retest/bounce scenario)

USD/JPY) bearish Technical AnalysisHELLO 👋 Dear friend USD JPY Traders
Technical Analysis represents a bearish analysis setup on the USD/JPY 1-hour timeframe, with the following key elements:
1. Ascending Channel: Price was previously moving inside an ascending channel, indicating bullish momentum.
2. CHoCH (Change of Character): A break below the channel support and structure level, marked as a change in market direction (from bullish to bearish).
3. Support Level: The price is currently testing a support zone around 142.400. The annotation suggests, "IF BREAK OUT", meaning a break below this support could trigger further downside.
4. Bearish Target: If support breaks, the projection is for the price to drop to the 139.872 zone, marked as "POINT".
5. EMA Bearish Crossover: The 50 EMA (red) has crossed below the 200 EMA (blue), adding confluence to the bearish bias.
Idea Summary:
Short Bias: Upon confirmation of the support level break (below 142.400).
Target: Around 139.872.
Confirmation: Look for bearish price action or retest/rejection from the support-turned-resistance area.

USD/JPY) Bullish trand analysis Read The ChaptianSMC Trading point update
Technical analysis of USD/JPY on the 2-hour timeframe, and it presents a bullish continuation setup. Here's a breakdown of the key elements and the idea behind the analysis:
---
1. Ascending Channel Formation
The price is trading within an ascending channel, suggesting a controlled uptrend.
Higher highs and higher lows confirm the trend structure.
2. Key Support and Fair Value Gap (FVG)
There’s a well-identified support level where price has bounced before (highlighted in yellow).
A Fair Value Gap (FVG) zone is marked slightly above the support level, which could act as a short-term demand area.
Price is currently pulling back into this zone, potentially setting up a buying opportunity.
3. EMA 200 Support
The 200 EMA (~143.78) is acting as dynamic support just below the current price.
If price drops further, this level may offer strong technical support.
4. RSI Momentum
RSI is above 50 (currently 56.37), supporting the bullish trend and showing room for continued upside.
5. Target Point
The chart anticipates a bounce off the support/FVG zone and a rally toward the upper boundary of the channel, targeting 147.153.
Mr SMC Trading point
---
Summary of the Idea:
This is a bullish continuation setup within an uptrend channel. The analyst expects a potential long entry around the FVG/support zone, with a target at the channel top (147.15). Confluence from the EMA 200, RSI, and previous structure supports this bullish bias.
Pales support boost 🚀 analysis follow)

USD/JPY Bearish Breakdown: Trendline Breach and Retest TargetingChart Breakdown:
1. Rising Channel
⬆️ Uptrend inside a channel marked by a support line
Price moved up steadily within the boundaries
Support line = channel bottom (🔵 Blue line)
2. Trendline Breakout
⚠️ Bearish breakout occurred when price broke below the support
This is a sell signal as it invalidates the upward trend.
3. Retest Zone (Resistance)
After the breakout, price came back to test the previous support — now resistance
🔄 Retest happened inside the blue box zone
This zone is crucial — if price fails here, it confirms resistance.
4. EMA 70 (Exponential Moving Average)
🔴 Red curve = EMA 70, currently above price
This suggests downward momentum is building.
5. Target Point
🎯 Target = 139.869
Based on projected move from the breakout
🔽 Bearish target shown by vertical arrow.
Summary :
Trendline break: ✂️⬇️
Retest at resistance: 🔄❌
EMA direction: 🔴↘️
Final target: 🎯139.869
Current mood: 🐻 Bearish Bias

"USD/JPY Supply Zone Short Setup | High R:R Trade Plan (1H Chart📉 Short (Sell) Setup
🔵 Supply Zone (Resistance Area)
Marked in the blue box
⚠️ Price may reverse here
Sellers dominated this area before.
🔄 Expected behavior:
Price goes up to the zone and then drops
➡️🔼🔽
🔹 Entry Point: 142.841
✍️ Enter a sell trade here
Right in the supply zone.
🔴 Stop Loss: 143.371
⛔ Placed above the supply zone
To avoid stop hunts.
🟣 Target Point: 140.000
🎯 Take profit here
Strong support level
Good place to close the trade.
⚖️ Risk to Reward Ratio
❗ Risk: ~53 pips
✅ Reward: ~284 pips
⭐ R:R = 1:5.4 – Excellent setup!
📈 EMA (7)
Current price is below the EMA
Confirms bearish bias
🧭 Used as a trend guide.
Summary
🚨 Plan:
Wait for price to enter the supply zone
Enter a sell at 142.841
SL at 143.371 ⬆️
TP at 140.000 ⬇️

USD/JPY Bullish Reversal Setup – Long Entry at 141.964 Targeting ahemdsaeed25: USD/JPY Long Setup – Eyeing 150.537 Target"
"Potential Bullish Reversal on USD/JPY"
"Swing Trade Alert: USD/JPY Long from 141.964"
"USD/JPY Breakout Play – Buy Zone Identified"
Let me know your tone preference (technical, casual, professional, etc.) and I can tailor the title further.
ahemdsaeed25: This chart is for the USD/JPY (U.S. Dollar / Japanese Yen) pair on the 1-hour timeframe, and it's displaying a bullish setup with a clear trade idea. Here's a breakdown of the analysis:
Key Components:
Current Price: Around 142.574.
Entry Point: 141.964
Stop Loss: 140.547
Take Profit / Target Point: 150.537
Reward-to-Risk Ratio: Favorable (approximately 5.94% upside, large potential move).
Indicators:
EMA 50 (Red Line): 142.798 — acting as near-term dynamic resistance.
EMA 200 (Blue Line): 144.699 — major resistance and a trend filter (downward trend visible).
Zone Analysis:
Support Zone (Purple Box near 141.964 - 140.547): This is the accumulation/buy zone.

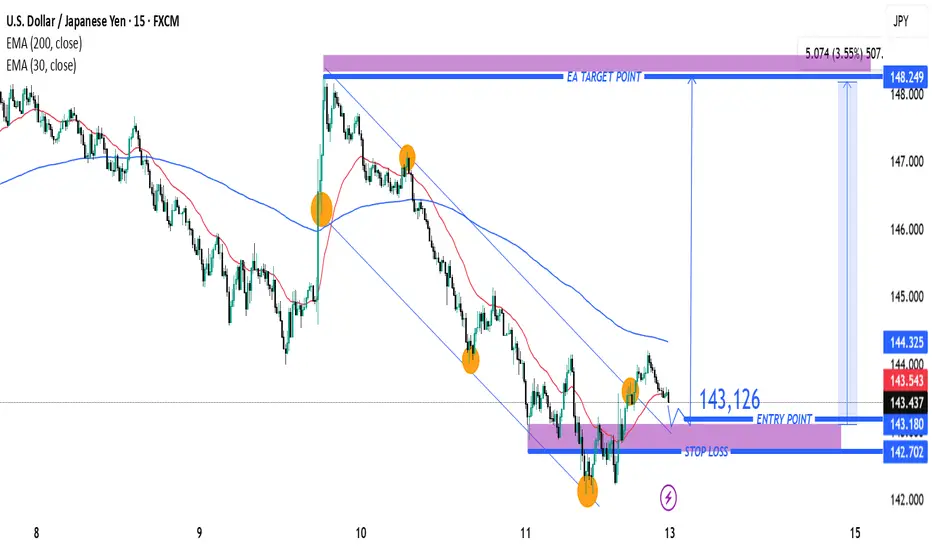
USD/JPY Bullish Breakout Setup – Entry, Stop Loss & Target AnalyPair: USD/JPY
Timeframe: 15 minutes
Indicators Used:
EMA (30-period) – Red line
EMA (200-period) – Blue line
Chart Features:
Downward channel (declining trendline)
Identified entry point, stop loss, and target
Key support/resistance zones shaded in purple
🟢 Trade Idea Summary:
🔹Entry Point: 143.126
🔹Stop Loss: 142.702
🔹Target (Take Profit): 148.249
🔹Risk/Reward Ratio: ~1:5 (Excellent R/R)
🔍 Technical Analysis:
✅ Bullish Breakout Signal
Price has broken above the descending channel and has retested the breakout area (highlighted purple zone) – a classic bullish breakout structure.
The breakout retest near 143.126 is acting as support, with potential to launch a new bullish move.
📈 Moving Average Analysis
EMA 30 is starting to flatten and curve up – indicating potential shift in momentum.
EMA 200 is still above price, but a breakout above it could strengthen the bullish case.
🔁 Support and Resistance
Strong support zone around 143.000 – 143.200 area (highlighted zone).
Major resistance and target zone is between 148.000 – 148.250.
🔔 Trade Plan Suggestion:
Go Long at or near 143.126
Place Stop Loss below support at 142.702
Target 148.249 for profit
Reasoning:
This setup offers a trend reversal potential from a downtrend to uptrend, with a clean breakout-retest-confirmation pattern. The wide take profit range gives room for extended upside as momentum builds.
⚠️ Watch For:
Reaction to the 144.325 (EMA 200) level
Increased buying volume to confirm breakout
Any re-entry into the channel (would invalidate setup)
USD/JPY Bearish Trade Setup – SBR + DBD Zone Rejection📉 Trend Analysis:
🔴 Downtrend confirmed by lower highs and lower lows.
📉 Descending trendline indicates continuous bearish pressure.
🔹 Key Levels & Zones:
🔵 Resistance Zone (SBR + DBD) – 144.123 📍 (Sell Entry Point)
🟠 Stop Loss – 145.209 🚫 (Above resistance to avoid fake breakouts)
🟢 Target Point – 139.694 🎯 (Strong support area)
🏹 Expected Price Action:
🔸 Scenario:
🔺 Price moves up toward the resistance zone (🔵 SBR + DBD Zone)
🔻 Bears take control (Rejection expected)
⚡ Drop towards target at 139.694
📊 Trade Plan:
✅ Entry – Wait for rejection at 144.123 (🔵)
✅ Stop Loss – Keep at 145.209 (🛑🔺)
✅ Take Profit – Aim for 139.694 (✅🎯)
💡 Risk-Reward Ratio: Good (More reward than risk)

USD/JPY) bullish trend analysis Read The ChaptianSMC Trading point update
This chart is an analysis of the USD/JPY currency pair on a 2-hour timeframe, and it presents a possible bullish scenario. Here’s a breakdown of the idea:
---
Key Points of the Analysis:
1. Support Level & Change of Character (ChoCH):
Price found strong support around 144.556.
A ChoCH (Change of Character) is noted, indicating a potential shift from a bearish to a bullish trend.
2. Bullish Reversal Setup:
The price is forming higher lows, suggesting the start of a "New Up Trend".
There's a clear zig-zag bullish projection, suggesting potential long opportunities.
3. Target Zones:
The first target point is in the range of 149.692 – 150.493.
This area is also marked with a resistance zone, making it a logical TP (Take Profit) level.
4. Risk/Reward Ratio:
The risk is around -3.75% (-564.8 pips), and the reward is around +3.94% (+569.2 pips), suggesting a 1:1.05 R/R ratio.
5. RSI Indicator (Below):
RSI is showing a bullish divergence (price made lower lows while RSI made higher lows).
This divergence supports the idea of a possible bullish reversal.
6. 200 EMA:
The 200 EMA is at 148.767, acting as a dynamic resistance. Price may react around that level before hitting the final target zone.
Mr SMC Trading point
---
Conclusion:
This analysis suggests a potential long trade setup on USD/JPY based on:
A support zone,
Bullish RSI divergence,
Market structure shift (ChoCH),
And projected movement toward 149.692–150.493.
Idea: Buy near the support zone (~144.556) and target the resistance zone (~150.493) while managing risk carefully.
---
Pales support boost 🚀 analysis follow)

USD/JPY 4H Chart Analysis:Trend Break & Support-Based Long Setup1. Previous Uptrend Channel
📈
Price moved in a rising channel
Lower trendline acted as support ✅
Then came the trend line break ⚠️ — signal of trend reversal
2. Major Drop
🔻💥
After breaking support, the price fell sharply
Strong bearish momentum took over
Sellers dominated the market
3. Support Zone Identified
🟦 Support Box (146.110 - 145.156)
Buyers stepped in at this level
Possible bounce or consolidation
Price currently at 147.014 — just above support
4. Trade Setup Idea
🛒 Buy Opportunity (if price holds support)
📌 Entry Zone: Around 146.110
🎯 Target: 150.260
🛑 Stop Loss: 145.156
📊 Risk:Reward = ~1:2 — solid R:R setup!
5. Indicators & Confirmations
🟠 DEMA (9): Sitting at 146.110 — aligns with support!
✅ Extra confluence for the bounce!
Summary
If price holds above support:
Buyers might push toward 150.260
If it breaks below 145.156:
Sellers may regain control

USD/JPY Bullish Reversal: Order Block & EMA 200 TargetSMC Trading point update
This chart presents a technical analysis of USD/JPY on the 1-hour timeframe. The key insights from this analysis are:
1. Order Block & Potential Reversal
The price has dropped significantly and reached a highlighted order block zone (a key demand area).
A potential inverse head and shoulders pattern is forming, indicating a possible bullish reversal.
2. Expected Bullish Movement
The price is expected to bounce from the order block, creating a bullish structure.
The projected move suggests a retracement toward a resistance zone, which aligns with previous price action.
Mr SMC Trading point
3. Target Zone & EMA 200
The target zone is around 148.946 - 149.178, aligning with the 200 EMA, a significant resistance level.
4. RSI Indicator
The RSI is currently low (~38.93), indicating potential for a reversal as the market may be oversold.
Conclusion
The chart suggests a bullish retracement after the recent drop, targeting the resistance zone near the 200 EMA. However, confirmation is needed (e.g., bullish price action, volume increase) before taking a trade. Keep an eye on fundamental news that may impact USD/JPY volatility.
Pales support boost 🚀 analysis follow)

USD/JPY Bullish Outlook – Targeting Key Resistance at 150.155USD/JPY Technical Analysis – Bullish Outlook Toward Resistance
Chart Insights:
The price is currently in a recovery phase after a significant drop.
A Fair Value Gap (FVG) zone has been identified, suggesting a potential pullback before further movement.
The target point aligns with the resistance level around 150.155, which acts as a key supply zone.
Potential Scenario:
Price may retrace into the FVG zone around 148.704 – 148.956.
A bullish rebound from this level could drive price toward the resistance at 150.155.
If price reaches the resistance level, further rejection or continuation will depend on market conditions.
Key Levels:
Support Zone: 148.167 – 148.315
FVG Area: 148.704 – 148.956
Resistance Zone: 150.007 – 150.155 (Target area)
Conclusion:
The current structure suggests a bullish bias if price respects the FVG zone for a push higher. However, a break below the FVG could signal further downside movement

USD/JPY Breakout Trade Setup – Bullish Potential Ahead!📉 Trend Analysis:
The pair has been in a downtrend 📉 since early February, following the descending trendline.
Now, price is breaking out above the trendline 📈, indicating a potential reversal or bullish move.
📊 Trade Setup:
🔹 Entry: Around 149.731 (current price)
🔹 Take Profit Targets:
🎯 TP1: 150.170 (First resistance)
🎯 TP2: 151.028 (Stronger resistance)
🚀 Final Target: 152.309 - 152.319 (Main bullish goal)
🔹 Stop Loss: 148.567 - 148.549 (Below recent support) ❌
⚖ Risk-Reward Ratio:
✅ Good reward-to-risk setup since stop-loss is tight, but the upside potential is higher.

USDJPY SHOWING A GOOD DOWN MOVE WITH 1:8 RISK REWARD USDJPY SHOWING A GOOD DOWN MOVE WITH 1:8 RISK REWARD DUE TO THESE REASON
A. its following a rectangle pattern that stocked the marketwhich preventing the market to move any one direction now it trying to break the strong resistant lable
B. after the break of this rectangle it will boost the market potential for breakC. also its resisting from a strong neckline the neckline also got weeker ald the price is ready to break in the outer region
all of these reason are indicating the same thing its ready for breakout BREAKOUT trading are follws good risk reward
please dont use more than one percentage of your capitalfollow risk reward and tradeing rules that will help you to to become a bettertrader
thank you
