USD/JPY Rising Wedge Forming – Watch for Possible Reversal AheadUSD/JPY is trading around 153.42 on the 4-hour chart, forming a rising wedge pattern, a structure that often signals a potential bearish reversal after an extended uptrend.
The pair has been climbing within this narrowing channel since mid-October, creating higher highs and higher lows. However, recent price action shows rejection near the upper trendline, followed by a pullback toward the lower support trendline. The 9-period SMA remains slightly upward but momentum appears to be weakening.
If price breaks below the lower wedge support near 153.00, we could see a deeper retracement toward 152.30 and 151.80. On the flip side, a strong bullish breakout above 154.50 would invalidate the wedge pattern and signal renewed buying interest, possibly targeting 155.00 and beyond.
Trading Plan:
📉 Sell below 153.00 → Targets: 152.30 / 151.80, Stop Loss: 153.70
📈 Buy above 154.50 → Targets: 155.00 / 155.40, Stop Loss: 153.90
Pattern: Rising Wedge
Bias: Cautiously Bearish unless price breaks above 154.50
Timeframe: 4H
📊 USD/JPY is approaching a critical point — stay alert for a confirmed breakout or breakdown before entering new positions.
Usdjpytrade

USD/JPY 4H Chart Analysis – Bullish Breakout Ahead?📈 USD/JPY 4H Chart Analysis – Bullish Breakout Ahead? 🚀💹
The USD/JPY pair is currently approaching a critical resistance zone (145.800 - 146.000), which has acted as a strong supply area in the past. The price has shown bullish momentum as it builds higher lows and heads toward this resistance.
🔍 Key Observations:
🔵 Resistance Zone: Clearly marked and tested multiple times. A breakout above this level could trigger a bullish continuation.
📊 Bullish Structure: The pair is forming a strong uptrend with higher highs and higher lows on the 4H timeframe.
🔄 Retest Scenario: Chart suggests a potential breakout above the resistance, followed by a bullish retest before continuing toward the target zone at ~148.900.
🟢 Upside Target: 148.900 (Previous swing high) – a potential gain of over 300 pips from breakout point.
📌 Trading Outlook:
✅ A confirmed breakout and retest of the resistance zone could offer a high-probability long setup.
❌ A failure to break and hold above the resistance may result in short-term consolidation or reversal.
📅 Watch Levels:
Resistance: 145.800 – 146.000
Support (breakout retest): 145.200 – 145.500
Bullish Target: 148.900
📢 Conclusion: Bulls are in control as long as price sustains above the resistance zone. A clean breakout followed by a retest could offer an attractive buying opportunity with a well-defined risk-to-reward setup. 🔥📊

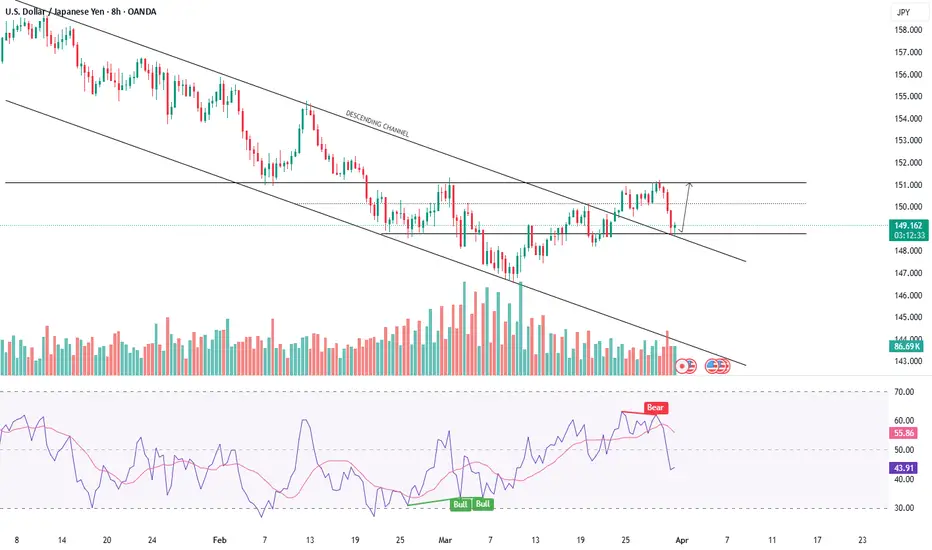
USDJPY Bearish Continuation SetupTrend Analysis
The market is in a clear downtrend, evidenced by the sequence of lower highs and lower lows.
The descending trendline has been respected multiple times, acting as dynamic resistance.
🧠 Key Technical Factors
Rejection Zone (Supply Area):
The marked “Rejection Point” aligns with the confluence of the trendline resistance, 50 EMA (red), and historical supply.
Price attempted to break above but faced a strong rejection—signaling institutional sell interest.
EMA Confluence:
50 EMA (142.993) and 200 EMA (144.063) are both sloping downward.
Price is trading below both EMAs, confirming bearish momentum and trend continuation bias.
BOS (Break of Structure):
Multiple BOS levels marked, showing a consistent pattern of structure breaks to the downside.
Each rally is met with selling pressure, failing to create new highs.
🧩 Projected Price Action
Current retracement could retest the trendline/50 EMA before a potential continuation move downward.
Expectation is a lower high formation near the descending trendline followed by a bearish impulse.
🏹 Bias: Bearish
Traders might consider short opportunities around the 142.90–143.00 zone, targeting 142.00 and below, with stops just above the trendline/supply zone.
⚠️ Risk Note
A clean break and close above the trendline and 50 EMA would invalidate this setup and could lead to a shift in structure.

USD/JPY Rebounds from Key Support – Eyes on 150.035 Target Support Zone:
The price is currently respecting a strong support area between 144.459 - 145.101. This zone aligns closely with the 200 EMA (145.101), increasing its validity.
EMAs:
50 EMA (146.059) is slightly above the current price.
200 EMA (145.101) is acting as dynamic support.
Price is currently trading just above the 200 EMA and below the 50 EMA — a neutral-to-bullish bias, especially since it bounced off support.
Bullish Signal:
The price has rejected the support zone and is attempting to break higher, supported by the bullish arrow projection.
Target Point:
Clearly marked at 150.035, which is a previous resistance level. This gives a potential upside of around 460 pips from the support area.
🧭 Trade Idea (if bullish bias is maintained)
Entry: Around 145.40–145.10 (current area)
Stop Loss: Below 144.459 (support base)
Take Profit: Around 150.035
Risk-Reward: ~1:3 or higher, depending on exact entry/exit.
⚠️ Caution
Watch for resistance at 146.059 (50 EMA); a clean break and retest would further confirm upside potential.
If price closes below 144.459, bullish invalidation could lead to a deeper correction

USDJPY Cup & Handle – Eyes on 147.883Entry Point: 143.525 (unchanged)
Stop Loss: 141.847 (unchanged)
Target Point One (TP1): 145.063 (unchanged)
Final Target (TP2): Now refined to 147.883 instead of 147.894 — a small, precise update.
📈 Pattern and Structure:
Cup-and-handle formation still intact, indicating a continuation pattern.
Support confirmation at the 143.5 zone, showing a potential base for a bullish reversal.
The chart shows strong upside projection toward the resistance band near 147.8–148.0, highlighted with the upper purple zone.
📊 Risk-Reward Profile:
Risk (Entry to SL): 143.525 – 141.847 = 1.678
Reward (Entry to TP2): 147.883 – 143.525 = 4.358
Reward-to-Risk Ratio: 4.358 / 1.678 ≈ 2.6R — a favorable risk/reward setup.
🧠 Trade Notes:
Entry is slightly above a demand zone.
First target is conservative, near a known resistance.
Final target aligns with prior highs and the broader ascending wedge’s upper bound.
Timing suggests the bullish push may unfold over the next few sessions (likely May 6–8 range, as curved arrow indicates a rounded retest/bounce scenario)

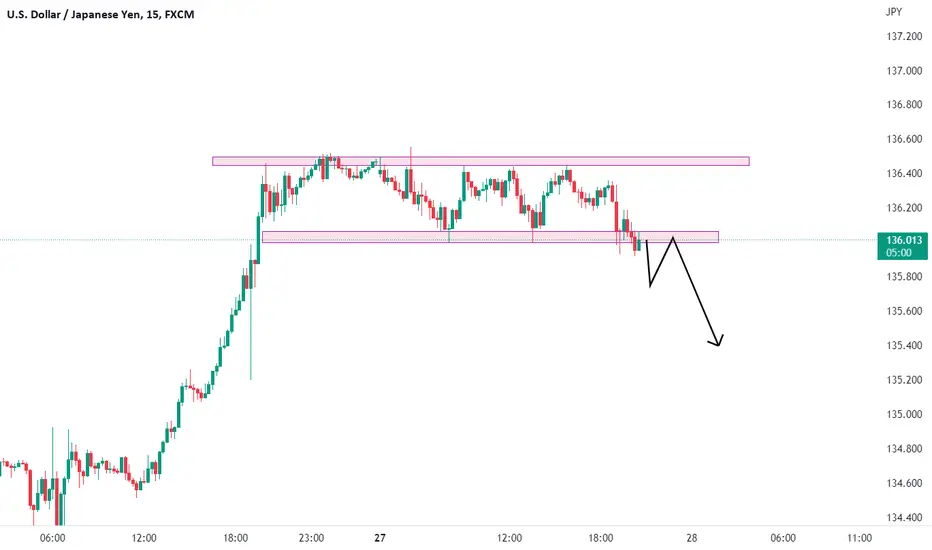
USD/JPY Bearish Breakdown: Trendline Breach and Retest TargetingChart Breakdown:
1. Rising Channel
⬆️ Uptrend inside a channel marked by a support line
Price moved up steadily within the boundaries
Support line = channel bottom (🔵 Blue line)
2. Trendline Breakout
⚠️ Bearish breakout occurred when price broke below the support
This is a sell signal as it invalidates the upward trend.
3. Retest Zone (Resistance)
After the breakout, price came back to test the previous support — now resistance
🔄 Retest happened inside the blue box zone
This zone is crucial — if price fails here, it confirms resistance.
4. EMA 70 (Exponential Moving Average)
🔴 Red curve = EMA 70, currently above price
This suggests downward momentum is building.
5. Target Point
🎯 Target = 139.869
Based on projected move from the breakout
🔽 Bearish target shown by vertical arrow.
Summary :
Trendline break: ✂️⬇️
Retest at resistance: 🔄❌
EMA direction: 🔴↘️
Final target: 🎯139.869
Current mood: 🐻 Bearish Bias

USDJPY- ATTEMPTING TREND REVERSALSymbol - USDJPY
CMP - 148.87
The USDJPY is currently in a corrective phase, retesting the previously breached downtrend boundary. The market is attempting to break this trend amidst a broader correction of the US dollar.
The dollar is facing significant challenges due to various economic and geopolitical factors in the United States, coupled with persistently high inflation. In light of these conditions, the US dollar Index may continue to experience a deeper correction, as expectations for interest rate cuts could be extended, potentially exerting further pressure on the markets.
Earlier, the currency pair attempted to overcome the resistance of the downtrend and succeeded, yet this move alone is insufficient to confirm a trend reversal; additional confirmation is required.
Support levels: 148.92, 148.21
Resistance levels: 150.16, 150.95
If the bulls manage to maintain support above the 148.92 - 149.5 range, there is a promising opportunity for a potential trend reversal. A move towards the 150.16 resistance level, followed by a breakout and sustained price action above this level, would serve as confirmation of the trend shift.
USDJPY - POTENTIAL REVERSAL FROM KEY SUPPORT LEVELSSymbol - USDJPY
CMP - 147.82
Following a significant decline in USDJPY, The price is approaching a strong support zone which is held since July 2024. The fundamental environment has been volatile recently, with a predominant influence from Trump's tariffs & US economic factors. Given the recent price action near support zone 148.00 - 147.00, there is a possibility that the pair could rebound from this level. The market’s current hesitation near this support zone suggests that the bulls may be preparing to defend this area.
The aggressive sell-off in US dollar, while exerting downward pressure, is also at oversold levels & creating a scenario where a potential reversal could take place, supported by the decline of Japanese Yen. Should the price manage to hold above the 147.20 support, it could signal the reversal.
From a technical perspective, there are two potential triggers on the chart: one signaling a buy and the other signaling a sell. However, given the prevailing global and local forex trends, the preference is to take a long position.
Resistance levels: 148.85, 150.00
Support levels: 147.25, 146.90
At present, the market is in a downtrend, with potential for a counter-trend correction. The direction of the price will depend on the US dollar's performance and upcoming economic news. If the outcome is favorable, the price could potentially reach to 150.00 & 152.15 levels.

USDJPY - TRADING AT SUPPORT LEVELSSymbol - USDJPY
USDJPY has encountered support and appears to have staged a false breakdown of the lower boundary of the prevailing local trend. At present, the dollar is strengthening, which could present an opportunity for the currency pair to appreciate. The price is consolidating in a strong support zone, and the fundamental environment has been volatile recently, with a predominant influence from U.S. economic factors. Meanwhile, the prospect of interest rate hikes in Japan has largely been disregarded, with market participants focusing more on economic data from the West.
From a technical perspective, there are two potential triggers on the chart: one signaling a buy and the other signaling a sell. However, given the prevailing upward global and local trends, the preference is to take a long position. Should the currency pair manage to secure a close above the 151.90 - 151.95 range, we can anticipate further upward movement towards the target levels shown on the chart in both the short and medium terms.
Resistance levels: 151.95, 153.70, 154.00
Support levels: 151.00, 149.52
However, if the dollar continues its correction and the bulls fail to maintain the false support breakdown, a price return to 150.95 could trigger a support break, leading to a potential decline towards 148.60

USDJPY - RETEST OF SUPPORT BREAKDOWN. SELLING AHEAD?Symbol - USDJPY
USDJPY is unable to maintain its uptrend for the time being. Speculation about potential actions from the Bank of Japan is expected to surface. Meanwhile, the US dollar continues to strengthen. The 158.45 level represents a significant resistance formed by bears, who are still exerting pressure on the market. This week, we anticipate active measures from the Bank of Japan, particularly an interest rate hike. While such actions are relatively rare, they could provide strong support for the currency pair. If Japan proceeds with this move, the pair may continue its correction from the 0.5 - 0.7 Fibonacci levels. In this case, key targets could include the zones at 153.25 and 152
Resistance levels: 156.55, 157.22
Support level: 155
A price drop below 155 could trigger aggressive selling. The rate decision in Japan is set for Friday, and until then, the price may remain in a consolidation phase.

USDJPY Trade SetupThis is for short term trade.
Reason for the trade
1.Its not break the demand.
2.Its respected the QML line.
3.Still the trend is in up in HTF
Please do your own research before entering the trade

USDJPYThis is for short term.
Its a counter trend trade.
Order block with imbalance.
Trendline liquidity.
Do your own research before entering the trade.


USD/JPY Trade Setup1. Trade pullback ?
>>> let price get back to POI for entry with sl above POI
(offers good R:R)
>>> follow the lower high lower lows pattern
>>> exit on price switching to higher low
2. Conservative Trade ?
>>> wait for the price to get a DISCOUNTED ZONE
(fib 0.5 from recent swing low to high)
>>> long on swing making higher low and higher high
(avoid entering direct on 0.5 without confluence)
(previous trade got out with small SL, then we saw a parabolic upside this is why sl is important)

USDJPY Short IdeaIn Daily and Weekly, TF shows weakness, so every bounce is a shoring opportunity.
There are two resistance on the chart in 4Hr TF, as marked in the chart.
The strong support zone near 138.500-139.200.

USDJPY ShortFX:USDJPY
A Good Consolidation flag breakout has seen in USDJPY, if it gives breakout and retest then take entry.
plan your trade accordingly and manage your risk to reward ratio.