USDJPY Trade SetupThis is for short term trade.
Reason for the trade
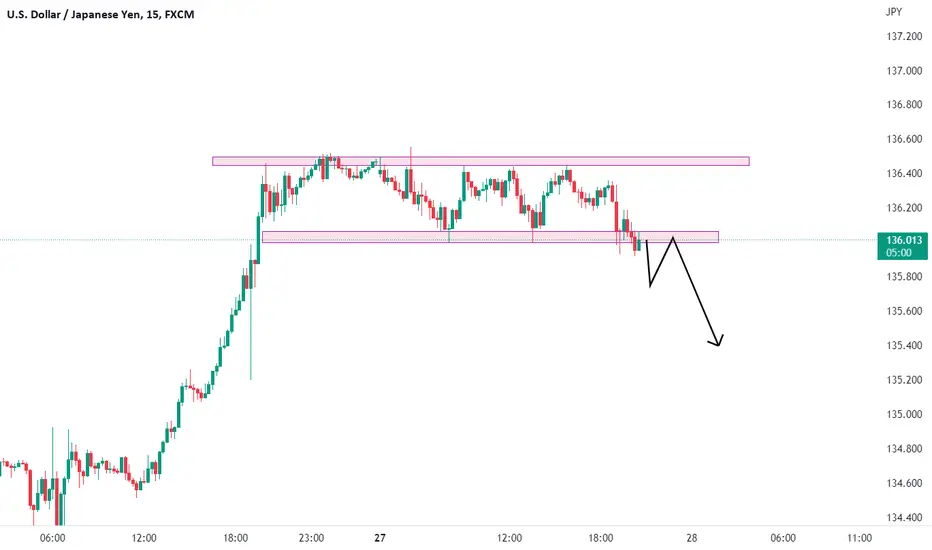
1.Its not break the demand.
2.Its respected the QML line.
3.Still the trend is in up in HTF
Please do your own research before entering the trade
Usdjpytrade

USDJPYThis is for short term.
Its a counter trend trade.
Order block with imbalance.
Trendline liquidity.
Do your own research before entering the trade.


USD/JPY Trade Setup1. Trade pullback ?
>>> let price get back to POI for entry with sl above POI
(offers good R:R)
>>> follow the lower high lower lows pattern
>>> exit on price switching to higher low
2. Conservative Trade ?
>>> wait for the price to get a DISCOUNTED ZONE
(fib 0.5 from recent swing low to high)
>>> long on swing making higher low and higher high
(avoid entering direct on 0.5 without confluence)
(previous trade got out with small SL, then we saw a parabolic upside this is why sl is important)

USDJPY Short IdeaIn Daily and Weekly, TF shows weakness, so every bounce is a shoring opportunity.
There are two resistance on the chart in 4Hr TF, as marked in the chart.
The strong support zone near 138.500-139.200.

USDJPY ShortFX:USDJPY
A Good Consolidation flag breakout has seen in USDJPY, if it gives breakout and retest then take entry.
plan your trade accordingly and manage your risk to reward ratio.