What? Bearish Plan of BTC to day and tomorrow go to 82.000 USDBearish Plan (Scenario as per the chart):
✅ Phase 1: Breaking support
BTC has broken below the short-term trendline.
Current price is around $84,500 - $84,700.
It is expected to continue falling towards the support zone at $83,250 – $83,000, lying along the longer-term black trendline.
✅ Phase 2: Drop to strong support zone
If selling pressure continues and volume increases (which is currently indicated in the volume chart), BTC could fall further to a stronger support zone:
$82,262 (yellow support line)
$82,107 is the final support level in this scenario.
✅ Phase 3: Potential bounce
After hitting this strong support area, the chart shows a rebound arrow.
BTC may bounce slightly, retesting the $83,000 – $83,500 zone.
3. Chart Implication:
This is a short-term swing trade plan, aiming to capitalize on a strong downward move towards support.
The risk-reward ratio looks favorable with entry around $84,500, take-profit target below $82,500, and stop-loss above $85,000.
4. Conclusion:
The chart outlines a bearish expectation for today (April 18, 2025) and a continuation of the drop into tomorrow morning (April 19, 2025), targeting the $82,100 - $82,300 support zone before a potential bounce.
DJ FXCM Index

Trump’s Trade Tensions Fuel Safe Haven Demand Amid USD WeaknessGold Analysis: Trump’s Trade Tensions Fuel Safe Haven Demand Amid USD Weakness 💰📈
On April 15, U.S. President Donald Trump ordered an investigation into potential tariffs on critical mineral imports, marking a further escalation in the trade dispute with global partners, especially China. This new wave of tension between the world's two largest economies has caused market sentiment to weaken, pushing investors towards safe-haven assets like gold.
Meanwhile, the U.S. Dollar (USD) has weakened, dropping to its lowest level in three years last week, making gold more attractive for holders of other currencies.
Fed's Stance on Market Volatility: Fed Chairman Jerome Powell indicated that the Federal Reserve will not intervene to "rescue" markets amid heavy volatility, emphasizing that the market is reacting to several uncertainties, particularly the ever-changing trade policies under Trump. Powell believes it's too early to determine what is really causing the volatility, and in the short term, instability could persist, partly driven by hedge funds reducing leverage.
Gold Outlook: Bullish Trend Continues:
Given the current market conditions, it’s evident that gold is likely to continue its upward momentum and reach new all-time highs (ATH). With global financial markets offering little hope for immediate monetary stimulus, as announced by the Fed, gold remains an appealing choice.
Trading Strategy:
Current View: Focus on BUY positions as the market continues to push higher. While we’re trading at ATH levels, sharp pullbacks are normal and can be expected without major news triggers.
Trade Plan: We won’t look for SELL entries at this point, but instead wait for strong market pullbacks to buy. If significant drops occur, we’ll enter BUY positions based on continuation patterns (CP) and key support levels on M15 and M30 charts.
Expected Pullback: After a strong push early in the Asian session today, the price is expected to return to the 331x - 3300 range for potential buy entries.
Key Support Levels:
3314, 3300, 3284, 3266
Key Resistance Levels:
3380, 3396, 3410
Trade Zones:
BUY ZONE: 3300 - 3298
SL: 3264
TP: 3304 - 3308 - 3312 - 3316 - 3320 - 3324 - 3330 - ???
SELL ZONE: 3396 - 3398
SL: 3402
TP: 3392 - 3388 - 3384 - 3380 - 3376 - 3370
Important Reminder:
Focus on securing BUY entries today. Although there could be sudden drops for potential SELL opportunities, they aren’t part of the plan for now. Wait for key resistance levels or psychological barriers set by other traders for potential shorting.
Always adhere to TP/SL levels to ensure your account remains safe. 🛡️

DXY Building Momentum — "Cash is King" Narrative Returns?📌 DXY is showing clear signs of recovery on the H4 timeframe — and that tells us something deeper: risk sentiment is shifting. Investors are pulling capital from risk-on assets and moving to cash. Yes, "Cash is King" might be making a comeback.
🔍 What’s Driving the Move?
As fear ripples through global markets:
📉 Equities are shaky.
🟡 Gold dropped sharply under profit-taking pressure.
🪙 Crypto lacks new capital.
Now, capital is rotating back into USD — not necessarily because of strong fundamentals, but due to defensive positioning.
🔺 On the geopolitical side, Trump’s aggressive tariff threats are shaking confidence. As import/export tension rises, the global appetite for USD-denominated assets (especially U.S. bonds) is also climbing.
🧭 Key Technical Levels (4H Chart)
Support Zones:
🟦 101.467 – historical structure low
🟦 102.113 – minor intraday demand
🟦 102.660 – neckline & retest zone (key area to hold)
Resistance Zones:
🟧 103.803 – consolidation top
🟥 104.506 – key resistance and EMA crossover zone
🟥 105.632 / 106.157 / 106.622 – higher-timeframe targets if momentum continues
🔮 Outlook by AD | Money Market Flow
The market is on the edge right now.
If U.S. equities fail to bounce and global risk sentiment continues to deteriorate, we could see: ✅ A strong USD breakout ✅ DXY bottoming and reclaiming the 104–106 zone ✅ Major asset correction across risk-on markets (Gold, Stocks, Crypto)
“When markets panic, smart money rotates to USD. It’s not bullishness — it’s protection.”
— AD | Money Market Flow
🔁 What to Watch:
Fed’s next steps (Will they ignore Trump’s tariffs and focus on growth?)
Global equity market reactions
Bond yields (demand for U.S. debt could rise again)
📌 Stay sharp and follow the money. DXY is giving early signals — don’t ignore the shift.
🧠 Manage risk. Protect capital. Let the market come to you.

GOLD CRASHES HARD — BUT THE BIG SHORT VIEW WAS ALREADY 🟡 GOLD CRASHES HARD — BUT THE BIG SHORT VIEW WAS ALREADY IN PLAY
Gold dropped — and dropped even harder than expected.
But for those following closely, this wasn’t a surprise.
From the start of April, we had been watching for signs of reversal after gold kept printing new ATHs. The candlestick behavior on the higher timeframes was already hinting at exhaustion — and today’s move validated that broader view.
🔍 Why I’ve Been Calling for a BIG SHORT — Not Just in Gold
This isn’t just about XAUUSD.
Zoom out and you’ll see the signs across the board:
US, EU, and Asian stock markets are in a steep decline
Crypto is stagnant, with no new capital inflow and little investor interest
And gold — after a historic run — is now facing intense profit-taking pressure, especially under growing geopolitical and global trade risks
In this environment, many investors are moving to cash and staying on the sidelines.
📉 DXY: A Potential Comeback?
The USD Index (DXY) has been heavily sold off in recent months.
But if you look closely — it's now testing a multi-year support zone that's held strong for nearly 3 years.
AD’s view?
If this level holds — and if recent tariff policies + international pressure from Trump continue — we could see a real USD recovery in the coming weeks.
Trump appears to be playing hardball — not just for his own benefit, but strategically for the U.S.
His aggressive trade moves are forcing nations to reconsider tariff terms. And in the short term, that puts Trump in a position of power — globally.
🤔 The Fed’s Dilemma
Even as Trump escalates trade pressure, the Fed remains cautious.
They’ve held back from rate cuts — waiting for clearer outcomes from these global negotiations.
All eyes are now on Trump’s next moves — and how other major economies will respond.
🔮 Strategy Moving Forward
Many investors are still in risk-off mode, hoarding cash and waiting for further declines.
AD still expects further downside in gold next week, alongside a potential short-term bounce in DXY.
→ After that, once the trade talk dust settles, we could very well see Gold resume its climb, while USD retests major supports on the D1 timeframe.
📌 I’ll be back with a full weekly outlook tomorrow, but for now — absorb this Gold/USD landscape and build your strategy for the new week.
Stay sharp & protect your capital.
— AD | Money Market Flow

USD/JPY BREAKS DOWN USD/JPY BREAKS DOWN – SAFE HAVEN YEN STRENGTHENS AS GLOBAL MARKETS REACT
After the latest U.S. tariff announcement, global financial markets went into risk-off mode, with U.S. Treasury yields dropping sharply. As investor fear rises, money quickly rotates into safe-haven assets — and the Japanese Yen is taking the spotlight.
🔻 USD/JPY just hit its lowest level in over 3 weeks, reflecting both global sentiment shifts and domestic tailwinds for the Yen.
🔍 What's Fueling Yen Strength?
Risk-off sentiment:
Global equities declined after the U.S. tariff update. Investors are fleeing risky assets, favoring traditional safe havens like the Yen.
Yield dynamics:
U.S. bond yields fell, dragging the dollar down.
If the Fed begins cutting rates to counteract trade impacts, it would further narrow the U.S.–Japan yield gap, supporting JPY.
BoJ policy outlook turning hawkish:
With inflation on the rise, expectations are growing that the Bank of Japan (BoJ) may continue rate hikes, reinforcing the Yen’s appeal.
Japan’s political stance:
Prime Minister Shigeru Ishiba announced intentions to revisit tariff policy negotiations with the U.S., potentially shaping Japan’s economic roadmap and investor confidence.
📈 Market Outlook:
If trade tensions persist and the Fed moves toward rate cuts, we could see further downside on USD/JPY, with JPY demand accelerating in both fundamental and technical terms.
This setup offers key opportunities for traders watching:
Safe-haven flow dynamics
Central bank divergence (Fed vs BoJ)
Potential macro breakout zones on JPY crosses
💬 What’s your view on USD/JPY heading into the next Fed and BoJ meetings?
Drop a comment and let’s discuss the bias!
✍️ Follow @MoneyMarketFlow for daily macro + technical insights across majors and metals.

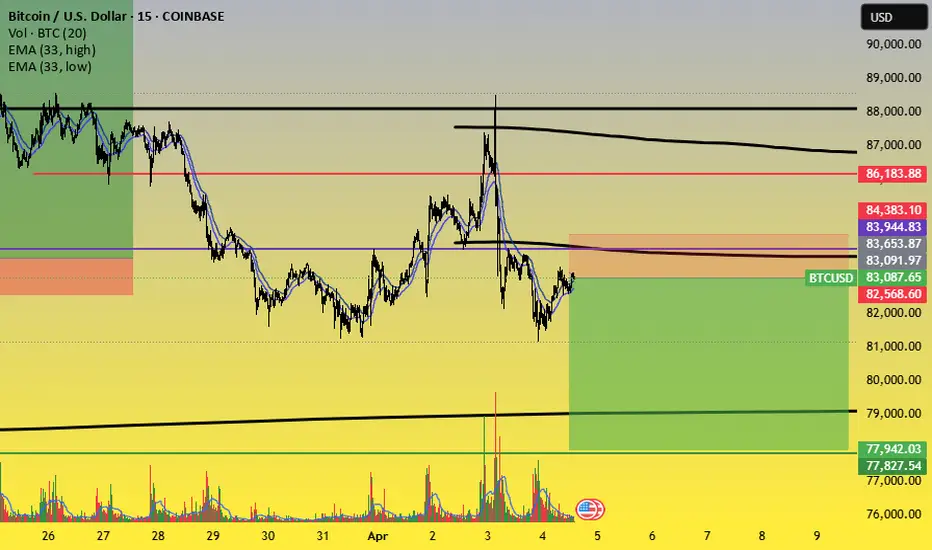
BTC Trading Recommendation (2nd Short Position)BTC Trading Recommendation (2nd Short Position)
📌 Pair: BTC/USD
📌 Timeframe: 15-Minute (M15)
📌 Exchange: (Hidden as requested)
Technical Analysis
Key Resistance Levels:
83,944 - 84,383 USD (Orange Zone)
86,183 USD (Strong Resistance)
Key Support Levels:
82,568 USD
77,827 - 77,942 USD (Strong Support)
EMA Indicators:
Price is currently hovering near EMA 33 and EMA 89, indicating a consolidation phase before the next move.
Trading Volume:
Slight increase but no clear breakout direction yet.
Trading Strategy
🔻 2nd Short BTC Recommendation: Enter a sell position when the price approaches 83,944 - 84,383 USD (minor resistance zone).
🎯 Target Prices (Take Profit - TP):
TP1: 82,568 USD
TP2: 77,827 - 77,942 USD
🚨 Stop Loss (SL):
Place SL above 84,400 USD to avoid stop-hunting.
📊 Risk-Reward Ratio (R:R) is favorable (~3:1) if price follows the plan.
⚠️ Note: Manage risk properly and observe price action at resistance zones before executing the trade.
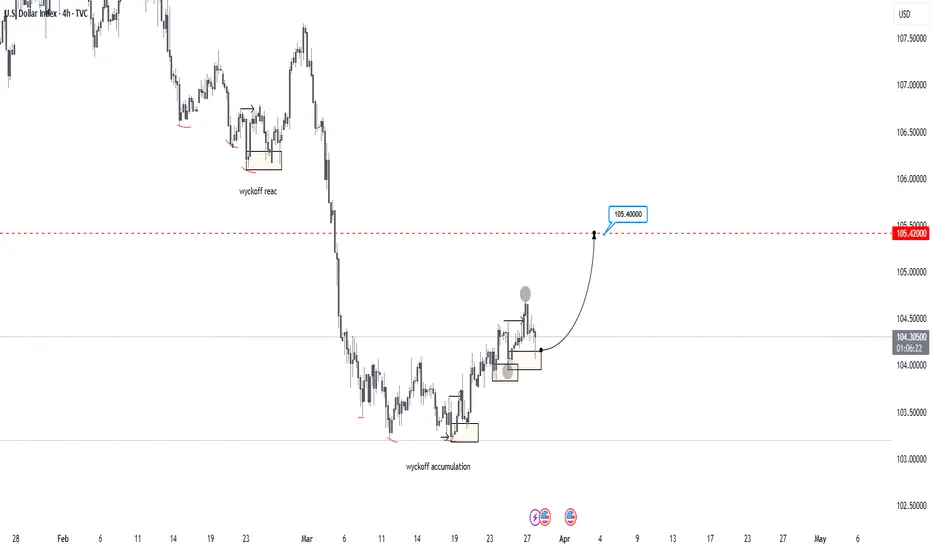
BULLISH ON US DOLLAR!As you can see on the chart, I am bullish on DXY. If you look at it from a technical perspective, you can see that after the accumulation schematic was complete, the dollar started gaining value. Price now needs to enter the markup phase. Looking at the current structure, price has formed a new trading range while breaking the high/structure to the left. A sharp reaction from that zone is a good sign. If the 4H candle closes bullish like this, it could be a strong indicator of bullish momentum building. Let's see. Overall, a pretty straightforward read.
Blessings, T
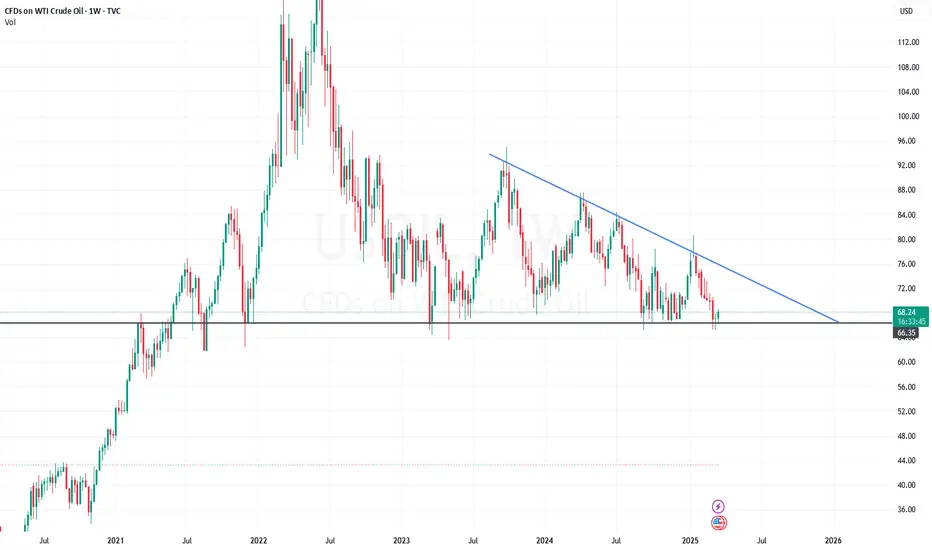
US OIL ALERTSo, I've been checking out the oil market, and it seems like US oil seems to have good support right now, with solid support below $66 and resistance around $75. It could be a good time to buy if you trade with a minimal stop loss. Check out the chart and see if it fits your risk appetite!
USDINR By KRS Charts 11th March 2025 / 7:24 PM
Why USDINR?
1. Wave Count is Clearly showing that USDINR is in Correction Wave.
2. FVG - Fair Value Gap is Visible + Price is also reacting as per both the theory.
3. 1:3 Risk/Reward
TARGET - Impulsive 4th Wave Level Depth
SL - FVG is Upper Band Closing Basis

US Dollar Index (DXY) – Pre-FOMC Update💥 US Dollar Index (DXY) – Pre-FOMC Update: Expert Analysis and Trading Strategies 💥
In just a few hours, the Federal Reserve (Fed) will announce its interest rate decision and update its economic projections in the Summary of Economic Projections (SEP). This is a highly anticipated event that will shape trading decisions in the coming weeks. The US Dollar Index (DXY) is currently fluctuating within the 103.00 - 104.00 range, reflecting investor caution ahead of the critical updates.
1. Interest Rate Decision and Its Impact on DXY
The policy rate is expected to remain unchanged at 4.25% - 4.50%. However, the market is more focused on signals about future rate cuts, particularly in 2025.
Chair Jerome Powell's post-meeting speech will be the key driver. The market will closely watch for hints on monetary policy, inflation, and the US economic outlook.
If the Fed adopts a hawkish tone (indicating sustained high rates or even further hikes), the DXY could rally strongly. Conversely, a dovish signal could weaken the USD.
2. Technical Analysis of DXY
🔴 Key Support: 103.18
The DXY is currently under pressure at the 103.18 support level. A break below this level could push the index further down to 103.00 or even 102.50.
This is a crucial zone, as failure to hold here would signal continued USD weakness in the short term.
🟢 Major Resistance: 105.00 and 105.57
If the DXY rebounds from current support levels, the next challenges will be the resistance zones at 105.00 and 105.57.
The 50-day and 200-day Moving Averages (MA) on the daily chart are also key indicators to watch. A break above these MAs could reinforce the bullish trend.
📉 Short-Term Trend:
On the 4H chart, the DXY is in a downtrend, with lower highs and lower lows. However, upcoming macroeconomic factors (the rate decision and Powell’s speech) could trigger a reversal or increased volatility.
Technical indicators like the RSI and MACD are in neutral territory, suggesting the market is awaiting clearer signals.
3. Trading Strategy Before and After the FOMC Decision
🔍 Before the Fed Announcement:
Caution is key. The market may experience mild fluctuations during the wait. Traders should avoid large positions and wait for clearer signals.
Closely monitor key support and resistance levels: 103.18 (support) and 105.00 (resistance).
🔥 After the Fed Announcement:
Scenario 1: Fed Holds Rates and Signals Hawkish Tone
The DXY could rally strongly, targeting resistance levels at 105.00 and 105.57.
Strategy: Look for buy opportunities when the DXY bounces off support or breaks above resistance.
Scenario 2: Fed Signals a Dovish Tone
The DXY could drop sharply, breaking below 103.18 and heading toward 102.50.
Strategy: Look for sell opportunities when the DXY breaks support or fails to surpass resistance.
Scenario 3: Fed Holds Rates Without Clear Signals
The DXY may continue to fluctuate within the 103.00 - 104.00 range.
Strategy: Trade within the range, using identified support and resistance levels.
4. Advice for Investors and Traders
📊 Risk management: Always set appropriate stop-loss and take-profit levels to protect your capital. Post-FOMC volatility can be intense, so prepare mentally and have a solid trading plan.
📰 Stay updated: Keep a close eye on Fed updates and market reactions. Jerome Powell’s speech could create significant trading opportunities.
🛠️ Use technical tools: Combine indicators like RSI, MACD, and Fibonacci to identify precise entry points.
5. Conclusion
Tonight’s FOMC meeting will be a decisive factor for the DXY’s short-term direction. With clear support and resistance levels identified, traders should prepare their strategies to capitalize on market movements.
🚨 Stay tuned for the latest updates on TradingView to ensure you don’t miss any trading opportunities!
Wishing you successful trades and profitable outcomes! 💪💰

USDJPY EA MAN UPDATE > READ THE CHAPTIAN Key Observations:
Resistance Level: The price is testing a key resistance zone around 150.026, where selling pressure could emerge.
EMA Confluence: The price is currently above both the 30 EMA (149.639, red) and 200 EMA (149.339, blue), indicating an overall bullish trend.
Projected Bearish Move: A rejection from the resistance zone could lead to a pullback towards the 149.117 support level, aligning with the potential short-term bearish scenario.
If price fails to break above the resistance and starts forming lower highs, a move towards the target point at 149.117 could unfold.

BTC AT CRITICAL LEVEL – BREAKOUT OR PULLBACK?🚀 BTC/USD – KEY BREAKOUT LEVELS AHEAD!
📌 Market Overview
Bitcoin (BTC/USD) is currently trading around $84,593, rebounding strongly from support. The price is approaching a major resistance zone at $87,049 - $89,748, where a crucial reaction is expected.
Overall sentiment remains influenced by market psychology, institutional activity, and macroeconomic factors. BTC is still trading within a descending wedge pattern, signaling that the corrective phase is not over unless a breakout occurs.
📈 Technical Analysis – Key Levels to Watch
🔹 Major Resistance Levels:
🔺 $87,049 - $89,748: A strong supply zone; a breakout here could trigger a bullish move toward $92,000+.
🔺 $90,005 - $92,000: The next target if BTC successfully clears resistance.
🔻 Major Support Levels:
🔹 $82,000 - $80,000: A short-term support zone where buyers might step in.
🔹 $78,935 - $78,000: A critical support area—losing this level could lead to a sharp sell-off.
📌 Key Observations:
If BTC fails to break $87,000, a retracement toward $80,000 - $78,000 is likely.
A confirmed breakout above $87,000 - $89,000 could signal further upside momentum toward $92,000 or higher.
🌍 Fundamental Analysis – What’s Driving BTC?
🔥 1. Institutional Demand & Market Sentiment
Market sentiment remains positive, but BTC needs stronger institutional buying to sustain further gains.
On-chain data indicates whales are accumulating BTC at lower price ranges, but resistance remains strong at $87,000.
Bitcoin ETFs are seeing steady inflows, providing fundamental support for long-term bullish momentum.
📊 2. Macroeconomic Factors & USD Impact
The DXY (US Dollar Index) is weakening, which is generally bullish for BTC.
The Federal Reserve’s monetary policy remains a key factor—interest rates are expected to stay high until mid-2025, which could slow BTC’s momentum.
Recent CPI and PPI data indicate persistent inflation concerns in the US, boosting demand for BTC as a hedge.
💰 3. Whale Activity & Institutional Moves
On-chain data reveals significant BTC withdrawals from exchanges, signaling long-term accumulation.
If large buyers continue accumulating, BTC could push above $90,000.
However, if whales take profits near resistance, BTC may retrace toward $80,000 - $78,000 before another move higher.
⚡ Trading Scenarios
✅ Scenario 1: Bullish Breakout Above $87,000
If BTC closes above $87,000 with strong volume, expect a rally toward $90,000 - $92,000.
A further push could target $95,000 if bullish momentum sustains.
❌ Scenario 2: Rejection at $87,000 - $89,000
If BTC faces resistance, expect a pullback toward $82,000 - $80,000.
A deeper correction could test $78,000, where strong support lies.
📢 Conclusion – Watch for a Critical Breakout!
📌 BTC is testing a major resistance zone ($87,000 - $89,000)—a breakout could fuel further upside.
📌 Market sentiment remains positive, but a rejection could trigger a pullback toward $80,000 - $78,000.
📌 Monitor Fed policies, institutional activity, and on-chain trends for better trade positioning.
📌 Traders should wait for confirmation before committing to a breakout or short position.
💬 Do you think BTC will break above $87,000, or is a deeper pullback coming? Share your views below! 🚀🔥

USD PLUNGES – IS THIS THE START OF A VOLATILE YEAR?📌 MARKET OVERVIEW
The US Dollar (USD) is experiencing a sharp decline, with the DXY index dropping by 3.5% in the past week, marking its second-largest drop since the 2020 pandemic. More importantly, USD is now on a three-month losing streak, sending ripples across global financial markets.
👉 The Euro is the primary driver behind USD’s weakness, surging 4.7% against the USD, the biggest jump since 2009.
📌 DXY weakness amid escalating trade wars is a crucial signal – it indicates that major shifts are about to unfold in the financial markets!
📊 WHY IS THE USD DROPPING?
🔹 1. The Euro’s Strong Recovery
The Euro is benefiting from the European Central Bank (ECB) maintaining stable monetary policies, while the US Federal Reserve (FED) leans towards rate cuts.
This policy divergence has reduced the appeal of the USD, pushing the Euro to its highest level in over a decade.
🔹 2. Market Expectations of Fed Rate Cuts
Recent US economic data shows weaker inflation, increasing the likelihood that the FED may ease monetary policy soon.
Lower interest rates diminish the attractiveness of the USD, encouraging investors to shift capital into alternative assets like gold and the Euro.
🔹 3. Trade War & Economic Uncertainty
Tensions between the US and China continue to escalate, with Trump’s aggressive tariff policies adding to global trade instability.
However, instead of strengthening the USD, these policies are creating negative market sentiment, leading investors to pull away from USD-based assets.
📌 USD is now in a difficult position:
✔️ The FED may loosen monetary policy, weakening USD further.
✔️ The ongoing trade war is eroding confidence in the USD.
📉 HOW USD WEAKNESS AFFECTS GLOBAL MARKETS
🔸 Gold Surges as USD Declines
Gold prices rally whenever USD weakens, as investors move funds into safe-haven assets.
If USD continues to drop, gold could break its all-time high (ATH) and surge towards $2,970 - $3,000.
🔸 Stock Markets Could Benefit
Lower interest rates and a weaker USD generally support the US stock market, especially export-driven companies.
However, if recession fears intensify, investors may move towards safer investments like gold and government bonds.
🔸 Other Global Currencies May Strengthen
A weaker USD boosts major currencies like the Euro (EUR), British Pound (GBP), and Japanese Yen (JPY).
This could shift global trade dynamics, influencing economic trends in the coming months.
⚡️ CONCLUSION – IS USD IN FREE FALL?
📌 The USD’s three-month decline is a major warning sign, signaling potential shifts in global financial markets.
📌 If USD continues its downtrend, gold could hit new highs, while stocks may see increased volatility.
📌 Traders must closely monitor FED decisions on monetary policy and ongoing trade tensions between the US and China.

U.S. Job Growth Slows: Impact on USD and Indian InvestorsIn the first two months of 2025, the U.S. economy experienced a notable slowdown in job creation, as reflected in consecutive Nonfarm Payroll (NFP) reports falling short of expectations. According to the U.S. Bureau of Labor Statistics, February saw an addition of 151,000 jobs, below the anticipated 160,000, though an improvement from January's revised 125,000.
reuters.com
+1
tradingeconomics.com
+1
Impact on the U.S. Dollar Index (DXY) 📉
The consecutive underperformance in job growth has exerted pressure on the U.S. Dollar, leading to a decline in the U.S. Dollar Index (DXY), which measures the greenback against a basket of major currencies. As of March 10, 2025, the DXY stood near a four-month low at 103.59, reflecting diminished investor confidence in the U.S. economy.
reuters.com
Federal Reserve's Response 🏦
Weak labor market data often prompts the Federal Reserve to reassess its monetary policy stance. With two consecutive NFP reports missing expectations, the Fed may consider slowing the pace of interest rate hikes or even exploring economic stimulus measures to support growth and employment. However, any policy adjustments will also weigh factors such as inflation trends and overall GDP growth.
Implications for Indian Investors 🇮🇳
The U.S. labor market's performance holds significant implications for global economies, including India:
Currency Exchange Rates 💱: A weakening U.S. Dollar can lead to the appreciation of the Indian Rupee, affecting export competitiveness and import costs.
Gold Prices 🪙: Traditionally, a softer USD boosts gold prices. Indian investors, who have a cultural affinity for gold, might see increased returns on their gold investments.
m.economictimes.com
Stock Market 📈: Global equity markets, including India's, often react to U.S. economic indicators. A slowing U.S. economy might lead to cautious sentiment among Indian investors, influencing market dynamics.
Expert Insights 🧠
Economists note that while recent U.S. job data indicates a slowdown, it's essential to consider the broader economic context. Factors such as consumer spending patterns, international trade policies, and geopolitical developments play pivotal roles in shaping both U.S. and global economic landscapes.
Conclusion 📝
The recent underwhelming NFP reports serve as a cautionary signal regarding the U.S. economy's momentum. For Indian investors, staying informed about these developments is crucial, as they can influence currency valuations, commodity prices, and equity markets. A diversified investment approach, coupled with vigilance, can help navigate the potential ripple effects stemming from shifts in the U.S. economic environment.

U.S. Dollar Index (DXY) – Key Technical Levels & Market OutlookU.S. Dollar Index (DXY) Monthly Chart Analysis 📊💵
The U.S. Dollar Index (DXY) is currently navigating a critical price structure, with key supply and demand zones influencing market direction. Here’s a professional breakdown of the chart’s technical outlook:
📍 Key Technical Insights
✅ Supply & Demand Zones
Supply Zone (Resistance): 109 - 114 📈 – A key area where selling pressure has historically emerged. A decisive breakout above this level could signal further upside potential.
Demand Zone (Support): 100 - 103 📉 – A strong accumulation zone where buyers have stepped in previously. A breakdown below could indicate a shift in market sentiment.
✅ Market Structure & Momentum
A Break of Structure (BOSS) has been identified, signaling a shift in trend dynamics.
The market is currently ranging between major resistance (~109) and support (~100).
✅ 200-Month Moving Average 📊
The long-term moving average (red line) is acting as dynamic support, reinforcing the bullish bias unless decisively breached.
📊 Potential Scenarios
🔹 Bullish Outlook: If DXY maintains support above 100-103 and breaks past 109, the index could aim for 114+ in the coming months. 🚀
🔹 Bearish Risk: A sustained drop below 100 may open the door for further downside towards 95-89, signaling a broader correction. ⚠️
📌 Conclusion
The DXY remains in a consolidation phase, with key inflection points around 103 (support) and 109 (resistance). A breakout or breakdown from this range will determine the next major trend. Traders should monitor these levels closely for potential trading opportunities.

Monstrous Volatility following Tariffs and NFP ForecastsHello Traders, It's that time of the month! :D Not what you are thinking.. But It's NFP Week! What an eventful week it's been already for the Euro. 450 Pips and we still have 3 more trading sessions to complete. I looked back two years and still did not find a week of matched volatility. A Major upside push has seen EurUsd tear it's way back from the depths of near Par (1.04) to well back inside the Monthly range between 1.104 and 1.056.
Trump Tarriff speeches, and fueled further by weak U.S. ADP data on Wednesday has given the Euro a monstrous exscuse to gain more value than it's seen in Years aginagst the dollar. Prepare for a wild end of the week with Jobs data forecasted to improve slighlty across the past data point.
What prices do we like moving into NFP day?
-Bullish targets are a tap into 1.08740, Weekly Resistaance Level
-Bearish targets could be 1.074
Otherwise we have some 1hr and 4hr Zones in the middle which could provide good risk/reward trade ideas.
Please leave a Rocket if you enjoyed and Follow for more Analysis.

USDJPY - A REBOUND FOLLOWING DOLLAR STRENGTHSymbol - USDJPY
CMP - 150.25
USDJPY pair is experiencing an upward movement in line with the performance of the US dollar. A temporary reversal is currently unfolding, driven by domestic political and economic factors in the United States.
The price is consolidating in the range of 149.40 - 148.60 after a significant decline. This long-term consolidation is creating a reversal pattern, further supported by the reversal and strengthening of the US dollar. Consequently, the Japanese yen is losing ground.
Key resistance is located at 150.30, should the bulls manage to maintain support above this level, there is potential for further price appreciation toward trend resistance in the short to medium term.
Resistance levels: 150.30, 150.95
Support levels: 149.40, 149.15
At present, the market is in a downtrend, with potential for a counter-trend correction. The direction of the price will depend on the US dollar's performance and upcoming economic news. If the outcome is favorable, the price could potentially reach 152.30

Strategy: Short US30 from 44,000 to 42,100 – Weekly Trade Plan1. Market Overview & Context
US30 (Dow Jones) is recovering but still faces pressure from macroeconomic factors:
U.S. bond yields: The 10-year yield is slightly rising, putting pressure on stocks.
Monetary policy: The Fed maintains a cautious stance on rate cuts, limiting strong market rallies.
Investor sentiment: Signs of profit-taking after the recent rebound.
Given these factors, the strategy of shorting US30 from the 44,000 - 44,484 zone down to 42,100 is highly feasible.
2. Trading Strategy
Entry Point:
Sell in the 44,000 - 44,484 zone, a key resistance area likely to trigger strong selling pressure.
Stop Loss (SL):
Above 44,850, as a break above this level could invalidate the short setup.
Take Profit (TP):
Target 1: 43,664 - 43,765 (Take 50% profit to secure gains).
Target 2: 42,100 - 42,132 (Fully close the trade to capitalize on the expected drop).
Risk Management:
Minimum Risk/Reward (R:R) ratio of 1:3, ensuring an effective trade setup.
Use a trailing stop to maximize profits if the price moves in the desired direction.
Alternative Scenarios
If US30 breaks above 44,850, the short setup is invalid. Wait for a new confirmation signal.
If the price drops quickly to 43,664 before entry, wait for a rebound near 44,000 before shorting again.

USDJPY - RETEST OF RESISTANCE BEFORE FURTHER FALLSymbol - USDJPY
The USD/JPY pair has disrupted the previous bullish market structure, with the U.S. dollar currently in a correction phase, which positively impacts the market. The pair is approaching a retest of the trendline that was recently broken, following a strong impulse move.
On Thursday, the Japanese yen reached a 10-week high, causing the USDJPY pair to decline to 149.50 This move is attributed to increased demand for safe-haven assets amidst escalating trade tensions, driven by U.S. President Donald Trump's aggressive tariff policies. Additionally, the yen has gained further strength, bolstered by market expectations of a potential interest rate hike by the Bank of Japan, making the currency more attractive to investors.
At present, attention is focused on the 0.5 Fibonacci retracement resistance zone at 150.95, as well as the previously broken upward support level.
Key Support Levels: 149.50, 148.64
Key Resistance Levels: 150.95, 151.40
It is likely that the price will first test the previously broken support zone, now acting as resistance between 150.95 and 151.40, before any potential decline. A false breakout of these critical Fibonacci zones could lead to further downward movement in the pair.

USD/INRI had a strong feeling about the USD/INR hitting 86. Back in March, I discussed it with a friend, and the chart pattern seemed to indicate a clear mirror level around 86. Now, it's incredible to see how close I was!

US10 Yrs. Bond Yield Form H&S pattern.As per H&S chart pattern, It may correct up to 4.24%, It means Nifty may bounce from here.

TRADE IDEA ON SHORT SIDE - US DOLLAR INDEX (DXY)Symbol - DXY
DXY is currently trading at 109.16
My reversal setup has formed in DXY & I'm seeing a trading opportunity on sell side.
Shorting DXY at CMP 109.16
I will add more position if 109.65 comes & will hold with SL 110.05
Targets I'm expecting are 108.00 - 107.30 & below.
Disclaimer - Do not consider this as a buy/sell recommendation. I'm sharing my analysis & my trading position. You can track it for educational purposes. Thanks!

Dow Jones: Ready for a Bull Run?! Dow Jones is testing critical levels as it approaches a descending trendline. With strong support below and bullish momentum building, the question remains—will it break out for a rally or face resistance again?
Key levels:
1. Resistance Zones:
- 43,400.00
- 43,346.03
- 43,063.60
2. Support Levels:
- 42,815.04
- 42,450.00
- 42,229.91
3. Current Setup:
- The price is moving within a defined structure and testing the trendline resistance.
- A successful breakout above the trendline could signal the start of a bullish run.
- On the flip side, rejection at the resistance might lead to a retest of lower support zones.
How to Trade This:
- Bullish Strategy:
- Watch for a breakout above 43,063.60 with strong volume.
- Targets: 43,346.03 and 43,400.00.
- Stop Loss: Below 42,815.04.
- Bearish Strategy:
- If the price gets rejected near 43,063.60, consider short positions.
- Targets: 42,815.04 and 42,450.00.
- Stop Loss: Above 43,063.60.
Bottom Line:
Dow Jones is at a critical juncture. A breakout could lead to a significant upward rally, while failure to clear the trendline resistance may bring the price back into its support range. Stay alert and trade the breakout or rejection based on confirmation! 📈📉
DJ:DJI BLACKBULL:US30 DJ:DJI TVC:DJI
