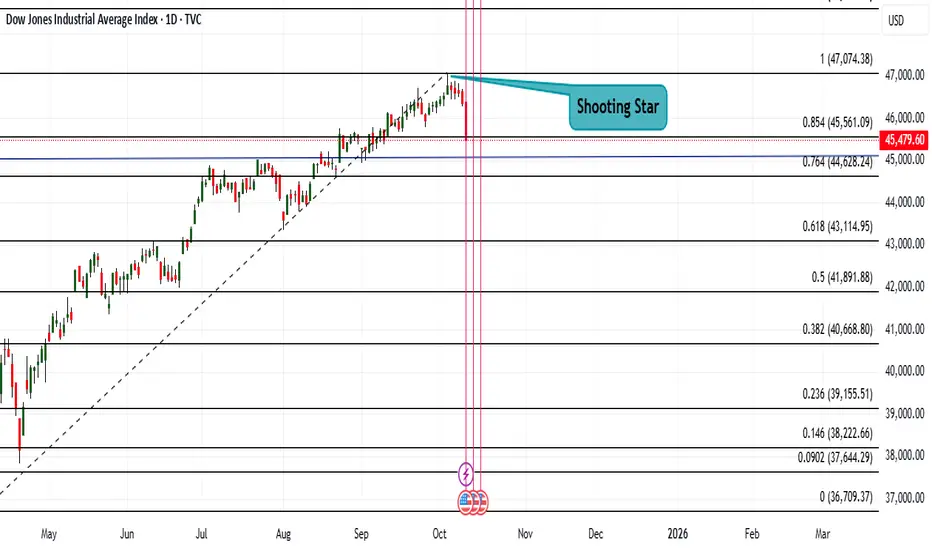
DJIA down by almost 900 points yesterdayDJIA fell down by 878points yesterday inspite of MCSI being above average.
Hint of the fall: Formation of Shooting Star Candle on 3rd Oct, and it facing hurdle at 47,074.
Usmarkets
Dow Jones: Ready for a Bull Run?! Dow Jones is testing critical levels as it approaches a descending trendline. With strong support below and bullish momentum building, the question remains—will it break out for a rally or face resistance again?
Key levels:
1. Resistance Zones:
- 43,400.00
- 43,346.03
- 43,063.60
2. Support Levels:
- 42,815.04
- 42,450.00
- 42,229.91
3. Current Setup:
- The price is moving within a defined structure and testing the trendline resistance.
- A successful breakout above the trendline could signal the start of a bullish run.
- On the flip side, rejection at the resistance might lead to a retest of lower support zones.
How to Trade This:
- Bullish Strategy:
- Watch for a breakout above 43,063.60 with strong volume.
- Targets: 43,346.03 and 43,400.00.
- Stop Loss: Below 42,815.04.
- Bearish Strategy:
- If the price gets rejected near 43,063.60, consider short positions.
- Targets: 42,815.04 and 42,450.00.
- Stop Loss: Above 43,063.60.
Bottom Line:
Dow Jones is at a critical juncture. A breakout could lead to a significant upward rally, while failure to clear the trendline resistance may bring the price back into its support range. Stay alert and trade the breakout or rejection based on confirmation! 📈📉
DJ:DJI BLACKBULL:US30 DJ:DJI TVC:DJI

Dow Futures Trading Levels and Strategy for 09th December 2024Dow Futures Trading Levels and Strategy
Market Context
Dow Futures is showing potential for a breakout, and this strategy focuses on confirmation by waiting for candle closures to minimize false signals. Adjust position sizing according to your risk tolerance.
Buy Setup
Entry:
Wait for a 15-minute candle to close above 44,900.
Place a buy order above the high of that candle.
Targets:
45,050
45,150
45,300
Stop Loss: Place a stop loss below the low of the breakout candle.
Sell Setup
Entry:
Wait for a 15-minute candle to close below 44,600.
Place a sell order below the low of that candle.
Targets:
44,450
44,300
44,100
Stop Loss: Place a stop loss above the high of the breakdown candle.
Market Context
Dow Futures is showing potential for a breakout, and this strategy focuses on confirmation by waiting for candle closures to minimize false signals. Adjust position sizing according to your risk tolerance.
Disclaimer
The above analysis is provided for educational purposes only and does not constitute financial or investment advice.
Trading in futures involves significant risks, including the loss of capital.
Always conduct your own research or consult with a certified financial professional before making trading decisions.
Use proper risk management, including stop-loss and position sizing, to safeguard your investments.

Dow Futures Trading Strategy 05th December 2024Trading Strategy for Dow Futures:
Buy Strategy:
Entry Point: Enter a long position (buy) above the high of the candle that closes above 45230 on a one-hour timeframe. This means if a one-hour candle closes above 45230, you will buy once the price exceeds the high of that candle.
Stop Loss: Set a stop loss slightly below the low of the breakout candle to manage risk. For instance, if the breakout candle has a low of 45100, you might set your stop loss at 45090 to protect your capital.
Target: Determine your target based on historical resistance levels or a risk-reward ratio. For example, if you're risking 140 points (45230 to 45090), aim for a reward of at least 280 points (e.g., a target of 45510).
Sell Strategy:
Entry Point: Enter a short position (sell) below the low of the candle that closes below 44870 on a one-hour timeframe. This means if a one-hour candle closes below 44870, you will sell once the price drops below the low of that candle.
Stop Loss: Set a stop loss slightly above the high of the breakdown candle. For example, if the breakdown candle has a high of 45000, you might set your stop loss at 45010 to mitigate risk.
Target: Determine your target based on historical support levels or a risk-reward ratio. For example, if you're risking 140 points (44870 to 45010), aim for a reward of at least 280 points (e.g., a target of 44600).
Risk Management:
Use Stop Losses: Always use stop losses to protect your capital and limit potential losses.
Position Sizing: Never risk more than a small percentage (e.g., 1-2%) of your trading capital on a single trade.
Regular Review: Continuously monitor the market and adjust your strategy based on evolving conditions and new information.
Market Context:
Economic Indicators: Pay attention to key economic indicators such as employment data, GDP figures, and interest rate announcements that can impact Dow futures.
Geopolitical Events: Be aware of geopolitical events and developments that can cause significant market volatility.
Disclaimer:
Trading in financial markets involves substantial risk of loss and is not suitable for every investor. The strategies and opinions expressed are those of the author and do not necessarily reflect the views of Microsoft. Users should perform their own research and consult with a financial advisor before making trading decisions. Past performance is not indicative of future results.

Dow Future Trading Strategy for 04th December 2024Trading Strategy:
Buy Strategy:
Entry Point: Enter a long position (buy) above the high of the candle that closes above 44980 on a one-hour timeframe. This means if a candle on the one-hour chart closes above 44980, you will buy once the price exceeds the high of that candle.
Stop Loss: Set a stop loss below the low of the breakout candle or a significant support level to manage risk. For instance, if the breakout candle has a low of 44850, you might set your stop loss slightly below this level to protect your capital.
Target: Determine your target based on historical resistance levels or a specific risk-reward ratio. For example, if you risk 100 points (from 44980 to 44880), aim for a reward of at least 200 points (e.g., a target of 45180).
Sell Strategy:
Entry Point: Enter a short position (sell) below the low of the candle that closes below 44670 on a one-hour timeframe. This means if a candle on the one-hour chart closes below 44670, you will sell once the price drops below the low of that candle.
Stop Loss: Set a stop loss above the high of the breakdown candle or a significant resistance level. For example, if the breakdown candle has a high of 44800, you might set your stop loss slightly above this level to mitigate risk.
Target: Determine your target based on historical support levels or a specific risk-reward ratio. For example, if you risk 100 points (from 44670 to 44770), aim for a reward of at least 200 points (e.g., a target of 44470).
Risk Management:
Use Stop Losses: Always use stop losses to protect your capital and limit potential losses.
Position Sizing: Never risk more than a small percentage (e.g., 1-2%) of your trading capital on a single trade.
Regularly Review: Continuously monitor the market and adjust your strategy based on evolving conditions and new information.
Market Context:
Economic Indicators: Keep an eye on key economic indicators such as employment data, GDP figures, and interest rate announcements that can impact Dow futures.
Geopolitical Events: Be aware of geopolitical events and developments that can cause significant market volatility.
Disclaimer:
Trading in financial markets involves substantial risk of loss and is not suitable for every investor. The strategies and opinions expressed are those of the author. Users should perform their own research and consult with a financial advisor before making trading decisions. Past performance is not indicative of future results.
Trade wisely and stay informed! 📈💼

Dow Futures Trading Strategy for 03rd December 2024Dow Futures Trading Strategy
Buy Strategy:
Condition: Look for the price of Dow futures to close above 45050 on a one-hour candle.
Entry Point: Identify the high of the candle that closes above 45050.
Action: Place a buy order above this high once the one-hour candle has closed above 45050. This confirms that the market is trending upward and you’re looking to ride the momentum.
Sell Strategy:
Condition: Look for the price of Dow futures to close below 44800 on a one-hour candle.
Entry Point: Identify the low of the candle that closes below 44800.
Action: Place a sell order below this low once the one-hour candle has closed below 44800. This confirms a downward trend, signaling a bearish market.
Current Price: The current price of Dow futures is 44880.
Disclaimer: This strategy is for informational purposes only and should not be considered financial advice. Trading involves risk, and you should do your own research or consult with a financial advisor before making any investment decisions.

Dow Futures Trading Strategy 29th November 2024Dow Futures Trading Strategy
Buy above the high of the one-hour candle which breaks and closes above 44980: Consider entering a buy position if the price breaks and sustains above the high of the one-hour candle and closes above 44980, indicating potential bullish momentum.
Sell below the low of the one-hour candle which breaks and closes below 44840: Consider entering a sell position if the price drops and closes below the low of the one-hour candle and breaks below 44840, indicating potential bearish momentum.
Example Analysis
Given the current price of 44930:
Buying above the high of the one-hour candle which breaks and closes above 44980: If the price breaks the high of the one-hour candle and closes above 44980, it suggests a potential upward trend.
Selling below the low of the one-hour candle which breaks and closes below 44840: If the price breaks the low of the one-hour candle and closes below 44840, it indicates a potential downward trend.
Disclaimer
Trading in financial markets involves significant risk and can result in the loss of your invested capital. It is crucial to conduct thorough research and consult with a financial advisor to understand the risks and develop a sound strategy.

Dow Trading Strategy for 28th November 2024Trade Strategy for Dow Futures
Buy: Enter a long position when the price moves above 45000 on a one-hour candle close.
Sell: Enter a short position when the price drops below 44780 on a one-hour candle close.
Current Price: 44879
Support and Resistance Levels
Support Levels:
44780: This is the first line of defense where the price might find support and potentially reverse upwards.
44500: If the price falls below 44780, 44500 acts as the next significant support level.
44000: This is a major psychological level that could provide strong support.
Resistance Levels:
45000: The initial barrier where the price might encounter resistance and potentially reverse downwards.
45200: If the price breaks above 45000, 45200 becomes the next key resistance level.
45500: This is a significant resistance level that could pose a challenge for further upward movement.
Disclaimer
Trading involves significant risk and it's important to do your own thorough research or consult with a professional financial advisor before making any investment decisions. The information provided here is for educational purposes only and should not be considered as financial advice. Always consider your risk tolerance and investment goals before engaging in trading activities.

DJI - Dow Jones Industrial Index by KRS Charts 16th October / 6:58 PM IST
What is next possible Move for DJI ❓Technically.
1️⃣ As we can see, DJI is in HHs and HLs upside trend. With recent high small Flag Target is achieved so profit booking is expected. ✅
2️⃣ Along with it, Index is above 100EMA again bullish trend it confirms. View wise Market is Bullish and new upside Target can unlock after its breakout from above Red Resistance zone as we can see in Chart.
3️⃣ In case of correction all the supports are marked in Charts will possibly help market to Bounce back from those levels.
4️⃣ Despite of all lower support my view on DJI will stay Bullish until it will break Green Support Zones and stay underneath of 100 EMA ⚠️⚠️

GOOD TIME TO SELL DOW JONES ?Symbol - DJI
Dow Jones is currently trading at 39850
I'm seeing a trading opportunity on sell side.
Shorting DJI at CMP 39850
I will be adding more if 40050 comes & will hold with SL of 40200
Targets I'm expecting are 39115 - 38585 - 38175 & beyond.
Disclaimer - Do not consider this as a buy/sell recommendation. I'm sharing my analysis & my trading position. You can track it for educational purposes. Thanks!

DJIA is entering a very dangerous period !!As per limited study April and May should reward bears.
Inittial signs of DJIA topping out is seen with my Time and Price study.
Rest market is supreme.
SL above 39889 (Weekly closing basis)
Downside 3000+ points positionally.

#DJIDJI started itd new impulsive wave from 30 oct 2023 .
Now its currently in its 5th wave and also from time analysis it took 18 days in 5th wave . So from time prospective DJI will continue its bull run for minimum 3 days .
So apply buy on dips with SL 38200

Q&A_ Why is Nifty50 still strong whereas SPX is in a bear grip?Namaste!
Currently, Nifty is trading near very important levels. This was the important resistance (because of lot of consolidation happening between Jun-July 2021), which became a support after the breakout. It has been tested twice since the July breakout.
S&P 500 fell into bear market yesterday as far as daily close is considered. But, I am not convinced 100% of this happening, because Dow Jones is still hasn't got into bear market yet. I will be convinced >90% if SPX closes below 3854.90 in weekly chart .
Q: Why is Nifty still strong as compared to US markets.
A: 1st reason is that, the fund houses, hedge funds, investors and FIIs may be moving money from weak US markets to comparably strong Indian markets. 2nd reason is that since it is a very strong support, market have to consolidate a little before moving below (15600 Nifty level).
Q: Will we see bear market in Nifty soon?
A: Well, if DJI slips into bear market too, then there is a very high probability that we will.
Q: Should we wait for a bear market to start investing?
A: NO. There are many stocks in Sensex and Nifty which became undervalued due to this bearish plunge. You should to find such stocks and get into it without waiting for more downfall.
Disclaimer: I am not an expert or professional degree holder into the field of investing. The views and analysis I have shared is of my own, based on my understanding. Please do your own due diligence before any activity.

DOWJONES - buy fear sell greedDOWJONES is trading at very good multiple support zone of 33600-33650, start accumulating at this levels to get most out of it.
Buy F.E.A.R dowjones heavyweights & hold with stoploss closing below 33600

Dow Jones Support & Resistance Daily ChartRange Bound Between 35200 to 35650.
Bullish to Sideways for Today in this range.
Strong Support from 35200 to 35000.
if break 35000 than only can see trend reversal till than Dow is in Up-trend.

SPX towards a new life high in sessions to comeCircle areas represent trendline support
strong reliable breakout in spx 500
it suggest US market to blast big from here and no surprise we can see all time high in month to come
the weekly breakout suggest continuation

US markets : A view of big move comingwatch chart. us market on verge of a big big move to 36500+++ or below 30000
Disc : for educational purpose

Dow Jones Technical Analysis - Will it go below 30,000Dow Jones, the widely followed stock market index, has experienced a decline in recent days after a strong upside rally from October to December 2022.
Technical analysis reveals that the index has broken an important support level and is showing a bearish trend. Additionally a Harmonic bat pattern has emerged, indicating a potential minimum target of around 29950.
As a result, caution is advised for traders, with a potential for selling pressure from above. Stay informed with our in-depth analysis of Dow Jones.

Russel 2000 Be watchful. Index is severally fall. Hourly time frame is showing mild recovery. Don't make any long position unless and until Index closed above 1794 aka 1800 level on daily closing basis.
For newbies , don't enter in the market. As, Market may not fall immediately from this level ( psychological level of 1700) and market may not sustain at higher level too.
This is only for education purpose.


Long term view on US MarketsFollow the trend always!! The markets globally are waiting to correct or rally upside more no one knows so just stay with the smart money and follow the trend and you'll make money!
My view could be wrong but we can see the markets are in a box for weeks and more the market spents time here more stronger will the breakout be!!
I would say it will probably go down but lets seee!!!

DJIA SUPERCYCLE DEGREE WAVE 5TVC:DJI
In Supercycle Degree Wave Five.
The Bull Market has long way to go for another 21 years.

S&P 500 Completed Correction/ Readying for New WaveOn Weekly Basis:
S&P 500 (SPY) completed its correction from 4800 to 3490 in its 5 Wave Down. Fibonacci 50% retracement from bottom 2300 to top 4800 ends at 3540, a support level. It fell 27% from top which looks quite healthy from long term point of view. Tech sector has taken a deep hit and looks like it has entered a bear market. It took a support at 3492 which is a long term horizontal support 3515 on weekly charts. It breached a strong support briefly, which was a false bear move and reversed the trend immediately. It looks like a fresh new Wave has just started. One can be cautiously optimistic and it provides a good choice to buy at current level as a downward trendline is broken on the up side. There is a chance pf golden cross over at 200 DMA, may happen soon for further confirmation in change of down trend. It has come out of oversold position (June, 2022) to neutral zone. RSI was deeply oversold and made a double bottom in June, 2022. Now it has broken the downward trendline and continuously going up, may give a chance for long position with change in sectoral leadership.
Warning and Disclaimer:
Above prediction should not be taken as financial advise, it is a personal opinion.
Consult your financial advisor.
Investment is subject to market risks.
Past performance is not the guarantee for future performance.
It is for educational purpose only.
