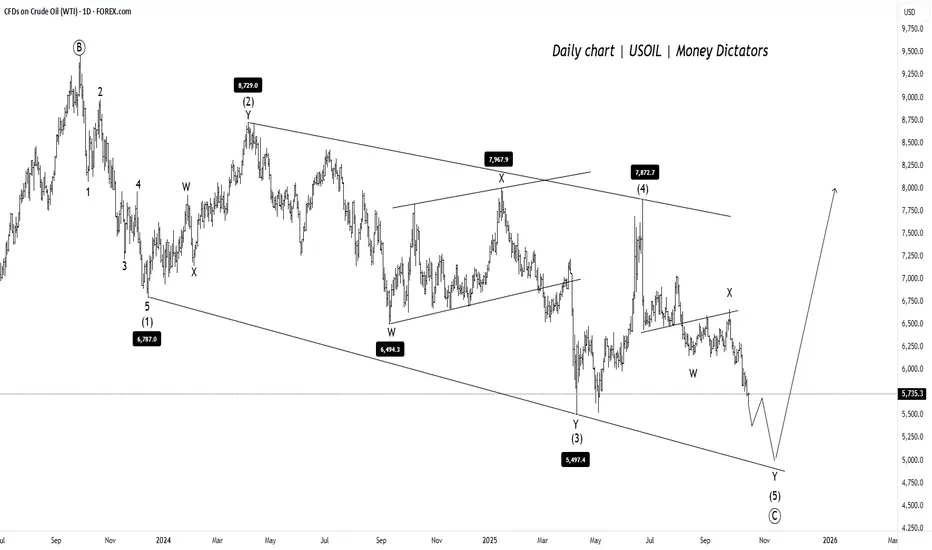
USOIL Near Final Leg USOIL is forming a clear corrective pattern inside a falling channel. Price is currently in the final leg of wave (5) of (C), suggesting one more dip is likely before reversal.
The downside target lies near 5,000–5,200 , where support from the channel base aligns. Once this level holds, a strong bullish reversal is expected, marking the end of the correction and the start of a new upward trend.
Stay Tuned!
@Money_Dictators :)
Usoilforecast
WTI Crude Oil TradeSetup:Demand Zone Reversal & Trendline Brkout📉 Trendline Resistance
🔴🔴🔴 (Multiple rejection points along the descending trendline)
📊 Demand Zone (Support Area)
🟦 Blue Zone (59.08 - 57.90) → Potential Reversal Area
✅ Entry Point: 59.08
🟡 (Marked in yellow) – Ideal buy zone
🎯 Target Point: 63.90
🔵 (Top Resistance Level) – Profit-taking zone
⛔ Stop Loss: 57.90
🟥 (Risk Management Zone) – To prevent big losses
📈 Possible Scenario:
1️⃣ Price drops into 🟦 demand zone
2️⃣ Bounces ⬆️ off support (bullish move 🚀)
3️⃣ Hits 🎯 target (63.90) ✅
⚠️ Alternative Scenario:
If price 📉 breaks below 🟥 stop loss, downtrend may continue.
This trade setup looks good with a 4:1 risk-reward ratio! 🏆

"WTI Crude Oil – Bullish Bounce from Demand Zone? "🔵 . Demand Zone:
⬇️ 60.53 – 59.71
This is the buy zone where bulls are likely to step in!
Price is currently testing this area. Watch closely!
🛑 . Stop Loss (Risk Zone):
📉 Below 59.66
If price falls below here, exit the trade – demand has failed.
🎯 . Target Point:
🚀 63.85
This is the take profit zone. A successful bounce could reach this level!
🟠 . EMA (9-period DEMA):
📉 Currently around 60.86
Price is slightly below EMA, showing short-term bearish pressure.
🟢 . Trade Idea Summary:
• Enter near the blue demand zone
• SL below 🔴 59.66
• TP at 🎯 63.85
• R:R ratio looks favorable (low risk, high reward)
Outlook:
As long as price holds above the demand zone, this setup remains bullish 📈
Let’s see if the bulls can push it to that 63.85 target! 🚀💰

WTI CRUDE OIL TRADE SETUP : BREAKOUT OR BREAKDOWN ?📊 Key Observations:
🔹 Trend:
🚀 Strong bullish move followed by a correction 📉
🔻 Price is testing a support zone
🔹 Pattern Formation:
📏 Descending channel or flag-like structure
📍 Price is near a breakout point
🔹 Trade Setup:
✅ Entry Zone: Around 70.77
🛑 Stop Loss: 70.44 - 70.49 (Risk limit ❌)
🎯 Target Point: 71.80 (Profit zone ✅)
🔹 Indicators & Confirmation:
📊 DEMA (9) at 70.92 → Price is slightly below short-term momentum
🔥 A breakout above resistance could confirm a bullish move 🚀
📌 Conclusion:
✅ If price breaks the trendline upwards → Buy 📈 aiming for 71.80 🎯
❌ If support at 70.44-70.49 fails → More downside possible ⚠️
🚀 Watch for volume & candlestick confirmation before entering!

USOIL - TRADING NEAR IMPORTANT DEMAND ZONE - TREND REVERSAL?Symbol - USOIL
CMP - 66.58
The USOIL has recently experienced a decent correction over the past few weeks, which has provided an opportunity for price consolidation near an important support zone before the potential upward price growth. This correction has allowed the market to stabilize, and the recent price action suggests that the price may show a reversal from the major support zone which has held since March 2023
Geopolitical tensions and OPEC production cuts continue to play a significant role in influencing oil prices, while global economic recovery, particularly in major consuming nations, provides further optimism for sustained demand. These factors are likely to continue supporting oil prices as market participants remain cautious about future supply disruptions. With the recent correction now completed, USOIL appears poised for further upward momentum, especially if these bullish fundamentals continue to hold.
Technically, the key support level to watch is $66.50 - $65.20 If this level is defended by the bulls, the price is likely to push towards the $69.00 - $70.20 range, which represents the next major resistance zone.
Resistance levels: $69.15, $70.20
Support level: $66.00, $65.20
The price has recently tested the $65.20 support zone. A potential false breakdown could occur here, aimed at capturing liquidity before prices resume their upward trajectory. With the correction phase likely behind us, renewed buying interest in USOIL could drive prices higher as the uptrend continues to unfold.

USOIL or CRUDEOIL Downtrend Movement upto 49SYMBOL USOIL or CRUDEOIL
Timeframe Day chart
Analysis: Breakout from the triangle pattern and we can expect a downtrend movement upto 49
We hope our analysis is adding value to your trading journey.
Please note: Published ideas are for educational purposes only. Trade at your own risk.
Also, please respect the risk - stop loss (SL) should not be more than 2% of the capital.
DISCLAIMER: We are not SEBI registered. All the videos uploaded in this channel are solely for educational purposes."

USOIL - BULLISH TREND WILL CONTNUE ?Symbol - USOIL
The USOIL has recently experienced a decent correction within its uptrend, which has provided an opportunity for price consolidation before the potential continuation of the bullish trend. This correction has allowed the market to stabilize, and the recent price action suggests that the uptrend is likely to resume, supported by a combination of supply constraints and growing demand expectations.
Geopolitical tensions and OPEC production cuts continue to play a significant role in influencing oil prices, while global economic recovery, particularly in major consuming nations, provides further optimism for sustained demand. These factors are likely to continue supporting oil prices as market participants remain cautious about future supply disruptions. With the recent correction now completed, USOIL appears poised for further upward momentum, especially if these bullish fundamentals continue to hold.
Technically, the key support level to watch is $72.50 - $73.00 If this level is defended by the bulls, the price is likely to push towards the $78.00 - $80.00 range, which represents the next major resistance zone.
Resistance levels: $78.00, $80.00
Support level: $73.00
The price has recently tested the $73.50 support zone. A potential false breakdown could occur here, aimed at capturing liquidity before prices resume their upward trajectory. With the correction phase likely behind us, renewed buying interest in USOIL could drive prices higher as the uptrend continues to unfold.

USOIL ORDER BLOCK | LONG TRADEUSOIL ORDER BLOCK | LONG TRADE
Hi Traders,
This is Usoil 1hr + 4Hr OB according to smc
we will see buying from this level.
Best time to take trade is 5 min CHoCH
Only for education Purpose
Give like, SHARE , FOLLOW FOR MORE UPDTAE

Crude oil trade:- As per chart crude oil break its previous low $70.142 and still trading below. Previous day candle made full of bearish candle it can also continue its lower side rally to $ 69 .
STAY TUNNED FOR MORE UPDATES FOLLOW ME

Crude oil trade:- As per chart crude oil break its previous low $70.142 and still trading below. Previous day candle made full of bearish candle it can also continue its lower side rally to $ 69 .
STAY TUNNED FOR MORE UPDATES FOLLOW ME

LONG TRADE IN CRUDE OIL - USOILSymbol - USOIL
USOIL is currently trading at 70.92
I'm seeing a trading opportunity on buy side.
Buying USOIL at CMP 70.92
I will be adding more if 69 comes & will hold with SL 67.50
Targets I'm expecting are 75.50 - 78
Disclaimer - Do not consider this as a buy/sell recommendation. I'm sharing my analysis & my trading position. You can track it for educational purposes. Thanks!

USOIL EmotionINTRO USoil
WTI holds below $73.50 amid slow China demand, halted Libyan exports
West Texas Intermediate (WTI), the US crude oil benchmark, is trading around $73.30 on Tuesday. Slowing manufacturing activity in China in August exerts some selling pressure on the WTI price. However, supply concerns surrounding Libya's oil output might cap its downside.
Price Tag
Buy 69.5 to 68.5 SL 67
TP 72 >>> 75 >>> 78

USOIL ORDER BLOCK | LONG TRADEUSOIL ORDER BLOCK | LONG TRADE
Hi Traders,
This is Usoil 1hr + 4Hr OB according to smc
we will see buying from this level.
Best time to take trade is 5 min CHoCH
Only for education Purpose
Give like, SHARE , FOLLOW FOR MORE UPDTAE

USOIL ORDER BLOCK | LONG TRADE [SWING TRADE]Hi Traders,
This is Usoil 1hr + 4Hr Order block trade we can see Buying from
this level..
At this level we can see some Liquidty pool.
Here we can take trade with 5 min CHoCH.
5 min CHoCH is best to take Long Trade
Note - Only for education Purpose
Follow for Daily Forex Update

USOIL ORDER BLOCK | SHORT TRADEUSOIL ORDER BLOCK | SHORT TRADE
Hi Traders,
This is Usoil 1hr Order block tarde we can see selling from
this level..
At this level we can see some Liquidty pool.
Here we can take trade with 5 min CHoCH.
5 min CHoCH is best to take Short Trade
Note - Only for education Purpose
Follow for Daily Forex Update

Bullish bias on OIL ( 10% - 15% upside)the price might sweep some liquidity before moving up
near around 74 level sweep
the target comes out as 82 and 88
which comes near about 10-15% upside potential
not a trading advice just my outlook
considering other factors fundamentally


Crude oil OR USOIL analysis . Crude oil analysis .
Symbol :Crude oil or USOIL
Time frame: 15 minutes
Analysis: There is a gap up in crude oil and from last 10 days, the price is in a consolidation.So, if the price crosses above 81,then we can expect a target up to 84 with MacD crossing above zero . If the price crosses below 79.3 then we can expect a target up to 76.3 with MACD crossing below
ZERO.so this is all about the analysis of crude oil.

usoil BuyCAPITALCOM:OIL_CRUDE
As you can see that usoil has formed Trendline and rejecting support level also breakout may happens Either side Wait for it, Take retest entry because to avoid fake breakout. plan your trade accordingly..

usoil BuyCAPITALCOM:OIL_CRUDE
USoil is at good support area and if it breaks we can go for sell side or if it breaks the trend line then we can plan for buying side, plan your trade accordingly.

usoil BuyTVC:USOIL
USOIL is in range bound and now it is rejecting at Strong support level here we can plan for buying side, plan your trade accordingly

usoil BuyCAPITALCOM:OIL_CRUDE
US_OIL is in good resistance with multiple rejections at 77.75 level and it is the major level.
If it breaks the price and retest the same level then we can go for long position.
