USOIL Bearish Reversal & Selling OpportunityUSOIL (WTI Crude Oil) – Bearish Setup Analysis
The chart shows a clear bearish structure with multiple confirmations:
Trendline Rejection & Break: Price rejected from the upper rejection line and later broke the rising trendline, confirming bearish momentum.
FVG (Fair Value Gap) Selling Zone: Price retested the imbalance zone (63.53–63.94), creating a strong selling opportunity.
EMA Confluence: Both the 70 EMA and 200 EMA are above the price, acting as dynamic resistance, supporting bearish bias.
Market Structure Shift (MSS): Breakdown of higher lows signals shift to bearish structure.
Target: Downside continuation expected towards 61.65, the next liquidity and support zone.
Stop Loss: Above 63.94 (selling zone invalidation).
📉 Strategy: Look for sell entries around 63.53–63.94 zone, with target at 61.65 and stop loss above 63.94.
Usoilsignal

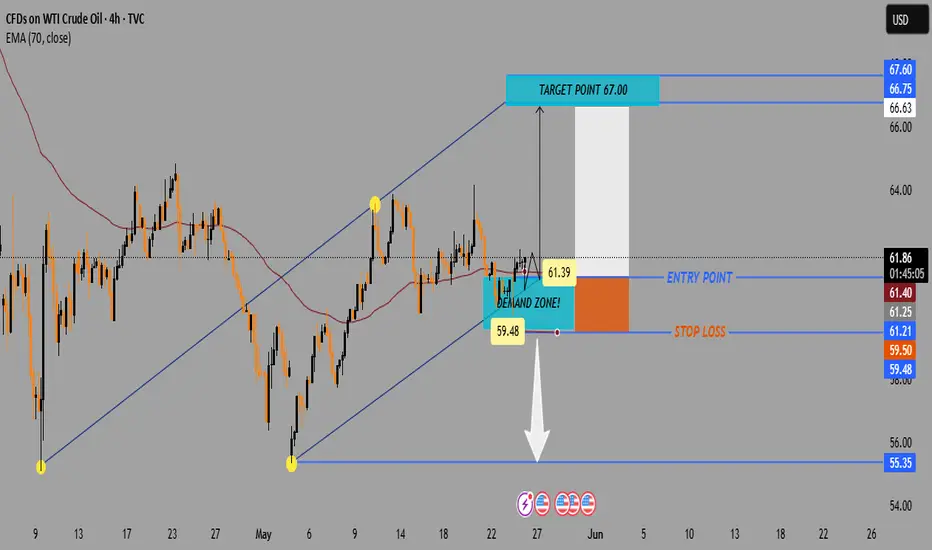
WTI Crude Oil 4H Chart – Bullish Setup from Demand Zone📈 Current Price: $61.74
🔵 Key Zones & Levels
🔹 Demand Zone (Buy Area):
🟦 $59.48 – $61.39
→ Price expected to bounce here
→ 🔄 Potential reversal zone
🔹 Entry Point:
🎯 $61.39
→ Ideal level to enter LONG
→ Just above demand zone
🔹 Stop Loss:
🛑 Below $59.48
→ Exit if price drops here
→ Protects capital
🔹 Target Point:
🚀 $67.00
→ Profit-taking zone
→ Strong resistance zone nearby:
* 66.63
* 66.75
* 67.60
📊 Indicators
📍 EMA (70): 🔴 61.40
→ Price trading above = bullish signal
→ EMA acting as support
📏 Trendline Channel:
🔼 Higher highs & higher lows
→ Supports uptrend continuation
📌 Trade Plan Summary
* Bias: 📈 Bullish
* Buy: At 61.39
* Stop: Below 59.48 🛑
* Target: 67.00 🎯
* Risk-Reward: ✔️ Favorable (~1:3)
🔍 What to Watch
* ✅ Bullish candles in demand zone
* 🔁 Retest of EMA or lower channel
* ❌ Avoid if it breaks below $59.48
WTI Crude Oil (USOIL) Bullish Pullback Setup – Targeting $66.70Entry Point: Around $62.30 - $62.26
Stop Loss: Set below the entry zone at $61.65, with a potential lower buffer at $60.90
Target Zone (EA TARGET POINT): Between $66.62 and $67.00
A projected gain of 4.22 points (~6.77%)
📈 Price Action & Indicators:
The price had a strong bullish run recently and is now consolidating or pulling back slightly.
The red and blue moving averages (likely short-term and medium-term MAs) show a bullish crossover and trend.
There's a potential bullish setup if the price pulls back to the entry zone and finds support.
The blue curved arrow indicates a projected bounce from the $62.30 support region back up toward the $66.70 target.
🛠️ Strategy Implied:
Wait for pullback to the entry zone (~$62.30).
Enter long at or around that level.
Set Stop Loss at $61.65 to limit downside risk.
Take Profit at $66.70 for a solid risk-reward ratio.
⚠️ Risks:
If support at $62.30 fails, price may head toward $61.65 or lower.
Market volatility (especially with crude oil) can invalidate setups quickly.
Economic events (e.g., U.S. inventory reports, OPEC news) can disrupt technical patterns.

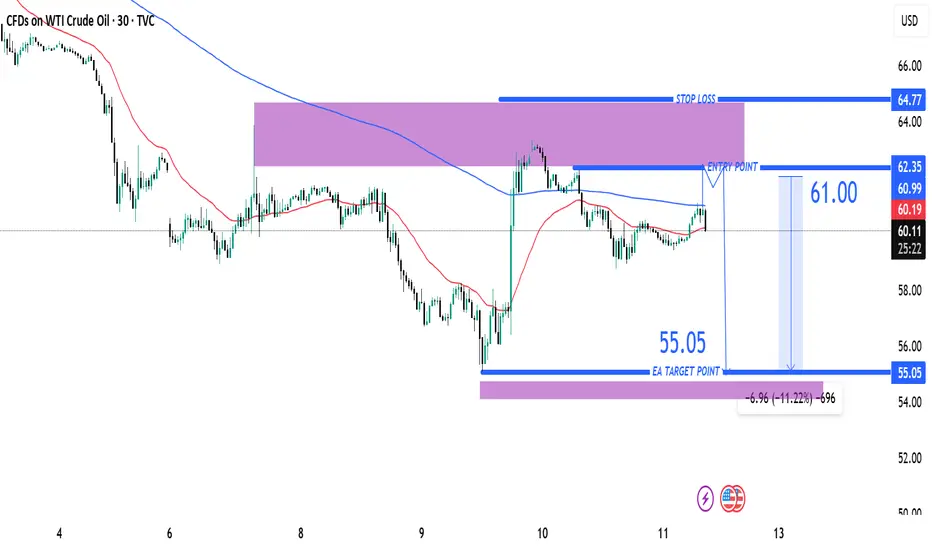
USOIL Short Trade Idea – Targeting $55.05 from $61.00Entry Point: ~61.00 USD
Stop Loss (SL): 64.77 USD
Target (TP): 55.05 USD
Risk/Reward Ratio: Favorable
Risk: ~3.77 USD
Reward: ~5.95 USD
Approximate R/R ratio: 1:1.58
🧠 Strategy Insight
Trend Context:
Prior to the entry zone, price shows a strong downtrend.
The price retraced upward into a resistance zone (highlighted in purple).
The setup suggests a short position anticipating rejection from this zone.
Indicators:
Moving Averages (red & blue):
Likely 50 EMA and 200 EMA showing bearish alignment (price mostly under both).
Resistance Zone:
The purple shaded region represents a supply zone, where price previously reversed.
Entry Zone Analysis:
Entry just below a recent rejection candle.
It's a conservative spot to catch a move back in the direction of the dominant trend.
Target Zone (55.05):
Likely based on a recent support level or demand zone from earlier price action.
Matches previous lows.
🔁 Possible Scenarios
✅ Bearish Scenario (Ideal Outcome):
Price gets rejected from the resistance zone and continues the downtrend toward the target at 55.05.
❌ Bullish Scenario (Risk):
Price breaks above 61.00 and continues toward 64.77, invalidating the short setup.
USOIL ORDER BLOCK | LONG TRADEUSOIL ORDER BLOCK | LONG TRADE
Hi Traders,
This is Usoil 1hr + 4Hr OB according to smc
we will see buying from this level.
Best time to take trade is 5 min CHoCH
Only for education Purpose
Give like, SHARE , FOLLOW FOR MORE UPDTAE

Crude oil trade:- As per chart crude oil break its previous low $70.142 and still trading below. Previous day candle made full of bearish candle it can also continue its lower side rally to $ 69 .
STAY TUNNED FOR MORE UPDATES FOLLOW ME

Crude oil trade:- As per chart crude oil break its previous low $70.142 and still trading below. Previous day candle made full of bearish candle it can also continue its lower side rally to $ 69 .
STAY TUNNED FOR MORE UPDATES FOLLOW ME

USOIL EmotionINTRO USoil
WTI holds below $73.50 amid slow China demand, halted Libyan exports
West Texas Intermediate (WTI), the US crude oil benchmark, is trading around $73.30 on Tuesday. Slowing manufacturing activity in China in August exerts some selling pressure on the WTI price. However, supply concerns surrounding Libya's oil output might cap its downside.
Price Tag
Buy 69.5 to 68.5 SL 67
TP 72 >>> 75 >>> 78

USOIL ORDER BLOCK | SHORT TRADEUSOIL ORDER BLOCK | SHORT TRADE
Hi Traders,
This is Usoil 1hr Order block tarde we can see selling from
this level..
At this level we can see some Liquidty pool.
Here we can take trade with 5 min CHoCH.
5 min CHoCH is best to take Short Trade
Note - Only for education Purpose
Follow for Daily Forex Update

Usoil 1hr POI | Forex Best TradeHi trader
This 1hr POI USOIL Taken Previous day liquidity (16/04/2024).
I expect Buying from this level
Note - Only for education purpose.

Usoil Order Block Trade | SWING TRADEThis trade is base on SMC so you can take buying trade accordingly.
very small SL
Like if you like the post
Note - Only for education purpse

💎 USOIL : 11.46% Profit Potential in Next 2 Days💣💣💣💣after good accumulation buyers are ready to move price up.. easy trade setup

USOIL Sell Setup Foundwe found sell setup senerio for usoil o we can say wti right,
so in this us oil technical analysis , i have shared my 4 to 5 scenrio in which i can see for selling pressure for us oil

USOIL/ REACTING TO OUR TARGET AREAUSOIL we analyzed that it will reach 76 $$$ market reacting on retest zone

USOIL Us Oil is in Daily Resistance after a breakout towards upwards it stared to give correction .Either it will be sideways for somedays otherwise it will reach upto 66 region in the daily breakout for retest then it will strated to push up

USOIL ASIA TRADE SETUPTechnical Analysis- The 4 hour is down against 1/08/2020 peak (63.87). 1 hour is turning down. However, while near-term dips remain above 6.59 low expect OIL to extend higher to correct the cycle from 1/08/2020 peak in 3, 7 or 11 swings before downside resume. We prefer selling the bounces in 3, 7 or 11 swings at the extreme areas.
Sell USOIL
@26.10-40
TP: 25.00
Tp2: 23.00
SL: 27.00
Good luck !

CRUDE BUY SIGNAL BASED on 4hr CANDLE CLOSURECurde running 4hr candle closes above 57.35 will confirm the uptrend signal, where you can go for long in curde.. target 60.20 in 1-2 week of time.. continue uptrend till 64 level stop loss will be update once buy triggered.

