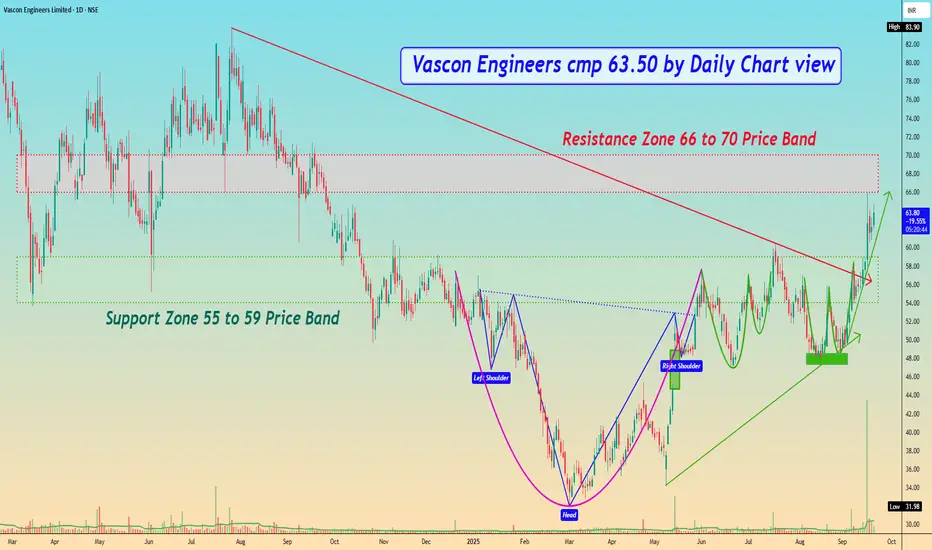
Vascon Engineers cmp 63.50 by Daily Chart viewVascon Engineers cmp 63.50 by Daily Chart view
- Support Zone 55 to 59 Price Band
- Resistance Zone 66 to 70 Price Band
- Heavy Volumes surge based breakout above Support Zone earlier Resistance Zone
- Multiple Bullish Patterns made around Support Zone with Head & Shoulders, Rounding Bottoms, Cup and Handle
Vascon
Vascon Engineers – Weekly CT BreakoutA clean Weekly CT breakout supported by strong volume (19M+), signaling strength. Key levels and structure:
🔍 Technical Breakdown:
📏 CT Line (White): Clean breakout from weekly closing-based counter-trendline
🕵️ Hidden Line (Dotted White): Secondary hidden resistance cleared
🟧 ₹45.49 Zone: Major gap-up area on DTF – key retracement demand zone
🔵 200 DEMA (Blue Line): Historical resistance now flipped – strength confirmed
🟥 Supply Zone (₹78–₹83): Overhead resistance – long-term target zone
📈 Volume: 🔥 Spiked to 19M+ – highest since Jan ‘24 – confirms breakout strength

Vascon Engineers Ltd - On a Rally moodVascon Engineers Ltd is an engineering company engaged in real estate. Hospitality, manufacturing with an operating revenue of more than 700 crores . Stock is now in a rally mode with its 52 week high. Stock is now testing it's 3 year long resistance trend line. If it breaks then a 100% move can be expected in 3--6 months time. It's also can be considered as a long term bet. Momentum is also very strong now. Company declared an interim dividend recently. Roce & ROE also improving comparing to previous years.

vascon is giving very Good profit to Traders and Investors I had given buy signal at 8.50
risk was 400rs Per 50 shares,
now it is 14,
next protective sL will be 10

VASCON ENGINEERS - Strong BreakoutTechnically it is a Triple Breakout at the same point.
Breakout from :
- Rising Wedge
- Inverted Head and Shoulder
- 200 EMA
