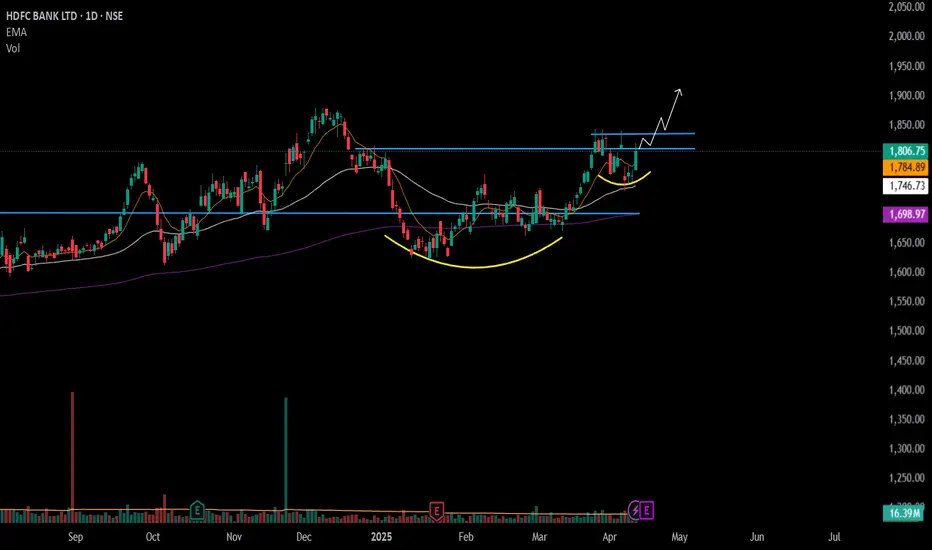
#HDFCBANK - Potential Breakout / Keep in WL 📊 Script: HDFCBANK
Key highlights: 💡⚡
📈 Cup & Handel Break Out in Daily Time Frame.
📈 Price consolidation near Resistance
📈 Enter only if Volume spike is seen.
📈 One can go for Swing Trade.
BUY ONLY ABOVE 1838 DCB
⏱️ C.M.P 📑💰- 1806
🟢 Target 🎯🏆 – NA%
⚠️ Stoploss ☠️🚫 – NA%
️⚠️ Important: Market conditions are bad, Position size 20% per Trade. Protect Capital Always
⚠️ Important: Always Exit the trade before any Event.
⚠️ Important: Always maintain your Risk:Reward Ratio as 1:2, with this RR, you only need a 33% win rate to Breakeven.
✅Like and follow to never miss a new idea!✅
Disclaimer: I am not SEBI Registered Advisor. My posts are purely for training and educational purposes.
Eat🍜 Sleep😴 TradingView📈 Repeat 🔁
Happy learning with MMT. Cheers!🥂
VCP
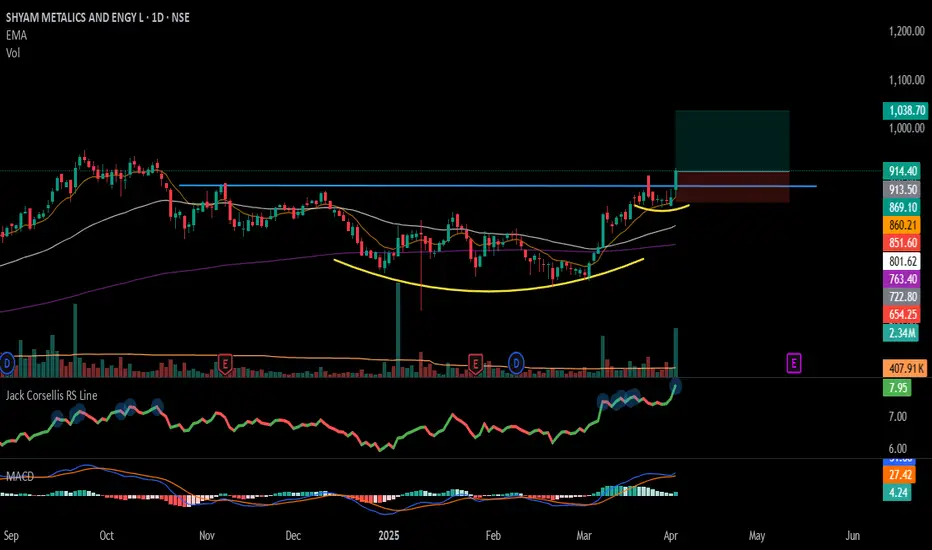
#SHYAMMETL - Cup & Handel Break Out in Daily Time Frame. 📊 Script: SHYAMMETL
Key highlights: 💡⚡
📈 Cup & Handel Break Out in Daily Time Frame.
📈 Price consolidation near Resistance & gave a BO with Volume
📈 Volume spike seen.
📈 MACD Bounce
📈 RS making 52WH
📈 One can go for Swing Trade.
BUY ONLY ABOVE 915 DCB
⏱️ C.M.P 📑💰- 914
🟢 Target 🎯🏆 – 14%
⚠️ Stoploss ☠️🚫 – 7%
️⚠️ Important: Market conditions are getting better, Position size 50% per Trade. Protect Capital Always
⚠️ Important: Always Exit the trade before any Event.
⚠️ Important: Always maintain your Risk:Reward Ratio as 1:2, with this RR, you only need a 33% win rate to Breakeven.
✅Like and follow to never miss a new idea!✅
Disclaimer: I am not SEBI Registered Advisor. My posts are purely for training and educational purposes.
Eat🍜 Sleep😴 TradingView📈 Repeat 🔁
Happy learning with MMT. Cheers!🥂
#SARDAEN VCP Formation in DTF - Keep In WL 📊 Script: SARDAEN
Key highlights: 💡⚡
📈 VCP BreakOut in Daily chart.
📈 Price gave a good up move and consolidated before BO.
📈 Volume spike on Breakout
📈 MACD Cross Over
📈 One can go for Swing Trade.
BUY ONLY ABOVE 511 DCB
⏱️ C.M.P 📑💰- 506
🟢 Target 🎯🏆 – 20%
⚠️ Stoploss ☠️🚫 – 108
️⚠️ Important: Market conditions are not great, Paper Trade Only. Protect Capital Always
⚠️ Important: Always Exit the trade before any Event.
⚠️ Important: Always maintain your Risk & Reward Ratio.
✅Like and follow to never miss a new idea!✅
Disclaimer: I am not SEBI Registered Advisor. My posts are purely for training and educational purposes.
Eat🍜 Sleep😴 TradingView📈 Repeat 🔁
Happy learning with MMT. Cheers!🥂

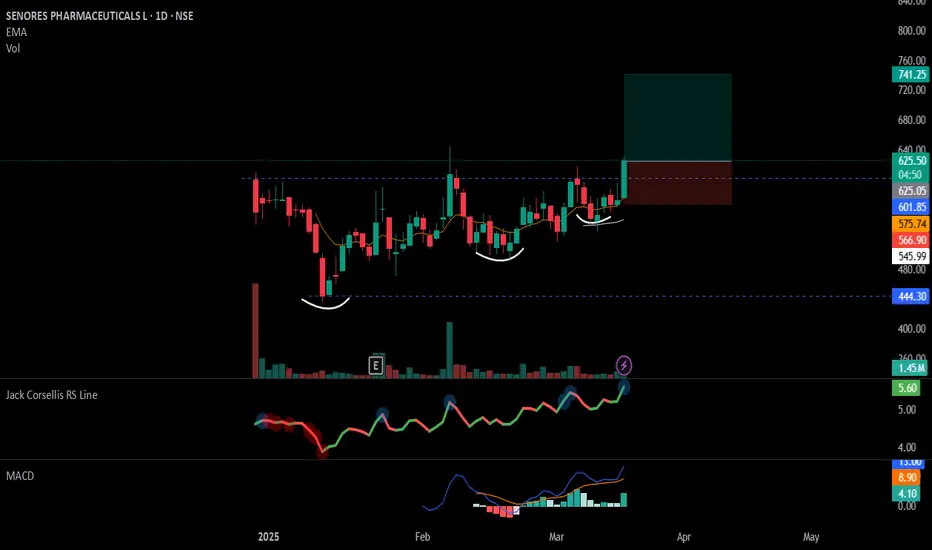
#SENORES - IPO Base Break-Out / VCP formation in Daily chart📊 Script: SENORES
Key highlights: 💡⚡
📈 VCP formation in Daily chart.
📈 IPO consolidation Break Out.
📈 Volume spike on Breakout
📈 MACD Bounce
📈 RS is making 52WH
📈 One can go for Swing Trade.
BUY ONLY ABOVE 625 DCB
⏱️ C.M.P 📑💰- 625
🟢 Target 🎯🏆 – 18%
⚠️ Stoploss ☠️🚫 – 9%
️⚠️ Important: Market conditions are getting better, Position size 25% per Trade. Protect Capital Always
⚠️ Important: Always Exit the trade before any Event.
⚠️ Important: Always maintain your Risk:Reward Ratio as 1:2, with this RR, you only need a 33% win rate to Breakeven.
✅Like and follow to never miss a new idea!✅
Disclaimer: I am not SEBI Registered Advisor. My posts are purely for training and educational purposes.
Eat🍜 Sleep😴 TradingView📈 Repeat 🔁
Happy learning with MMT. Cheers!🥂
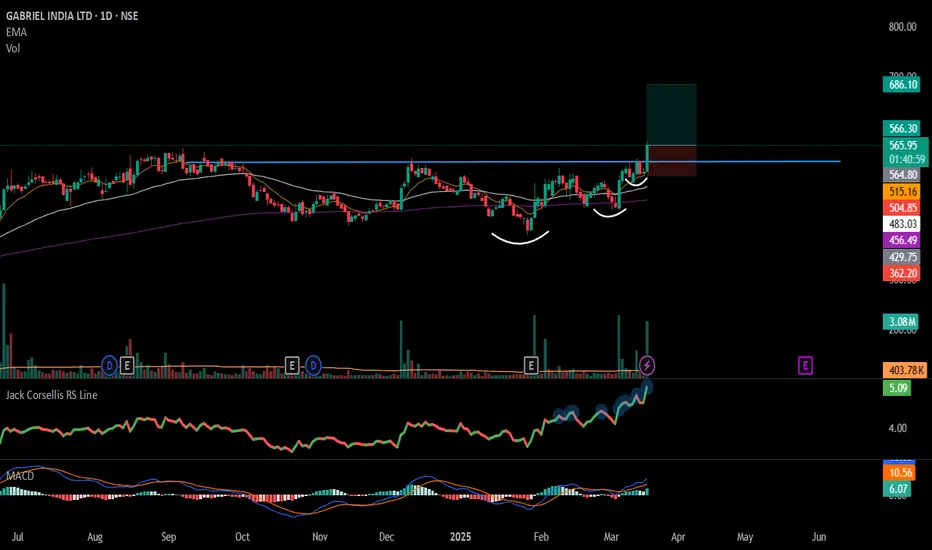
#GABRIEL - VCP Break Out in Daily chart with Volume Spike📊 Script: GABRIEL
Key highlights: 💡⚡
📈 VCP formation in Daily chart.
📈 Price gave a good up move and consolidated.
📈 Volume spike on Breakout
📈 MACD Bounce
📈 RS is making 52WH
📈 One can go for Swing Trade.
BUY ONLY ABOVE 565DCB
⏱️ C.M.P 📑💰- 561
🟢 Target 🎯🏆 – 21%
⚠️ Stoploss ☠️🚫 – 11%
️⚠️ Important: Market conditions are getting better, Position size 25% per Trade. Protect Capital Always
⚠️ Important: Always Exit the trade before any Event.
⚠️ Important: Always maintain your Risk:Reward Ratio as 1:2, with this RR, you only need a 33% win rate to Breakeven.
✅Like and follow to never miss a new idea!✅
Disclaimer: I am not SEBI Registered Advisor. My posts are purely for training and educational purposes.
Eat🍜 Sleep😴 TradingView📈 Repeat 🔁
Happy learning with MMT. Cheers!🥂
#NH - Breakout Soon Candidate / Keep in Watchlist / Feb'25📊 Script: NH
Key highlights: 💡⚡
📈 VCP Formation in Daily chart.
📈 Price gave a good up move.
📈 Went into a Side Ways consolidation for over a Nine months.
📈 Volume spike seen in past
📈 MACD Cross Over.
📈 One can go for Swing Trade.
🟢 If you have any questions regarding the setup, please feel free to leave your inquiries in the comments, and I will respond promptly.
BUY ONLY ABOVE 1415 DCB
⏱️ C.M.P 📑💰- 1357
🟢 Target 🎯🏆 – NA%
⚠️ Stoploss ☠️🚫 – NA%
⚠️ Important: Always Exit the trade before any Event.
⚠️ Important: Always maintain your Risk & Reward Ratio.
✅#Boost, #Like & #Follow to never miss a new idea! ✅
Disclaimer: I am not SEBI Registered Advisor. My posts are purely for training and educational purposes.
Eat🍜 Sleep😴 TradingView📈 Repeat 🔁
Happy learning with MMT. Cheers!🥂

#CANTABIL - Breakout Soon Candidate! /Feb'25/ 📊 Script: CANTABIL
Key highlights: 💡⚡
📈 C.E.S.T – refer image
🟢 If you have any questions regarding the setup, please feel free to leave your inquiries in the comments, and I will respond promptly.
BUY ONLY ABOVE 315 DCB
⏱️ C.M.P 📑💰- 284
🟢 Target 🎯🏆 – NA%
⚠️ Stoploss ☠️🚫 – NA%
⚠️ Important: Always Exit the trade before any Event.
⚠️ Important: Always maintain your Risk & Reward Ratio.
✅#Boost, #Like & #Follow to never miss a new idea! ✅
Disclaimer: I am not SEBI Registered Advisor. My posts are purely for training and educational purposes.
Eat🍜 Sleep😴 TradingView📈 Repeat 🔁
Happy learning with MMT. Cheers!🥂

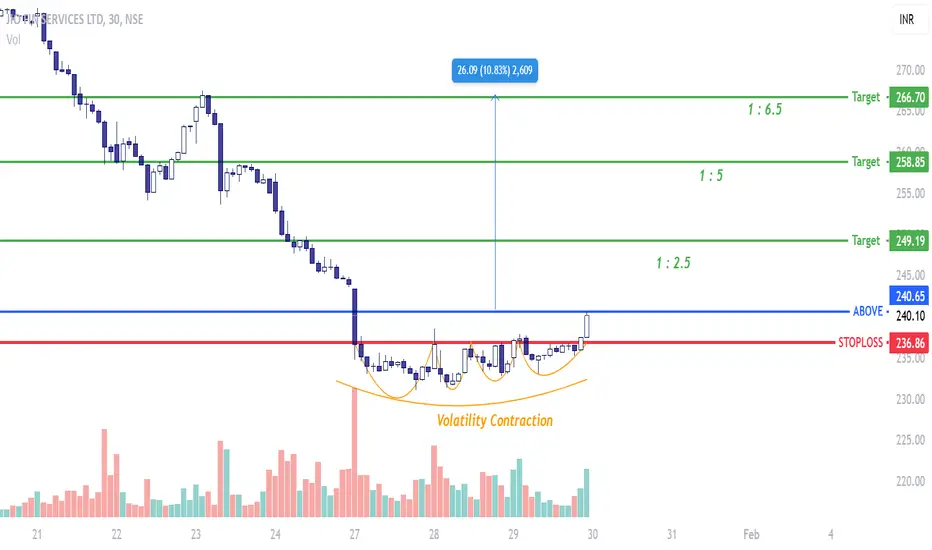
JIO FIN SERVICES - Swing ContenderOn the larger scheme of this this stock has been beaten down and the trajectory is deep negative. However, in the very short term the stock can correct its trajectory and as a trader one can make use of these opportunities.
A volatility contraction has happened forming a base on shorter timeframe. Expecting this stock to perform well over the next 2 days.
#INNOVATORS - VCP Break Out in Weekly chart📊 Script: INNOVATORS
Key highlights: 💡⚡
📈 VCP Break Out in Weekly chart.
📈 Price gave a good up move
📈 Went into a Side Ways consolidation & formed VCP
📈 Volume spike seen on BO
📈 MACD Cross Over
📈 One can go for Swing Trade.
BUY ONLY ABOVE 280 DCB
⏱️ C.M.P 📑💰- 265
🟢 Target 🎯🏆 – 57%
⚠️ Stoploss ☠️🚫 – 28%
⚠️ Important: Always Exit the trade before any Event.
⚠️ Important: Always maintain your Risk & Reward Ratio.
✅Boost, Like and follow to never miss a new idea! ✅
Disclaimer: I am not SEBI Registered Advisor. My posts are purely for training and educational purposes.
Eat🍜 Sleep😴 TradingView📈 Repeat 🔁
Happy learning with MMT. Cheers!🥂

Univastu- Broke out of an Ascending Channel.Stock Analysis: UNIVASTU INDIA LTD
Trend: The stock is currently in an uptrend.
Breakout: It has successfully broken out of an ascending channel.
Pattern: Forming a Volatility Contraction Pattern (VCP).
Volume: The breakout is accompanied by high volume and a wide-range bullish candle.
Entry Point
Trigger: Above ₹302.
Confirmation: Wait for a daily close above this level before entering.
Stop Loss
SL: ₹262 (Deep SL).
Current Market Price (CMP)
₹312.45 (Almost at the upper circuit).
Buy only test quantities to observe performance.
Avoid large trades due to current weakness in the broader market.
Focus on buying stocks with strong structures in small quantities to build a test portfolio.
This approach will help gauge the overall market trend and prepare for potential reversals.
Note
When the broader market bottoms out and reverses, structurally strong stocks like this one have the potential for significant upside moves. Exercise caution and patience in the current market environment.
.

LLOYDSENGGLLOYDSENGG showing strength and gave resistance breakout with decent volume. Seems it may continue for new ride. And it may show uncharted zone as well. Keep it on radar.

CAPLIPOINTCAPLIPOINT giving resistance breakout. Its a clear base setup with decent volume. Get ready for the next ride. I built 1st position nr 1550 level and not its trading nr 2600.

Urban Enviro Waste ManagementUrban Enviro Waste Management Limited provides comprehensive waste management solutions, including municipal solid waste (MSW) management services. It manages approximately 2,000 metric tons of waste daily. The company has a portfolio of 36 projects, with 18 completed and 18 ongoing.
With market cap of around ₹ 225 crore the company has shown strong revenue growth, with sales increasing from ₹13 crore in 2020 to ₹128 crore in 2024 and maintains a healthy ROE of around 51%.
Services:
Waste Collection: Door-to-door garbage collection for residential, corporate, and industrial clients.
Transportation: Efficient transportation of collected waste to designated disposal sites.
Segregation: Sorting of waste to facilitate recycling and proper disposal.
Processing: Treatment and processing of solid municipal waste to minimize environmental impact.
Road Sweeping/Cleaning: Keeping roads clean by removing debris and dirt.
Bio Mining: Excavation, treatment, and utilization of aged municipal solid waste.

BANARAS BEADS LTDThere has been a long consolidation and then there was a spurt in volume.
Some big hands have entered and since then accumulation has been in progress.
The VCP formation during this accumulation suggests a breakout move is coming soon.

PAR - Ready to Break All Time HighThe chart of PAR Drugs shows a strong accumulation phase followed by consistent base shifts, indicating a steady uptrend with strong support levels forming at higher price ranges.
Key observations:
Strong Base Formation: The stock established a solid support level early on, acting as the foundation for the uptrend.
Base Shifts:
Multiple higher bases were formed, showing sustained buying interest and bullish momentum.
10-Week EMA Support:
The stock repeatedly tested and respected the 10-week EMA, confirming it as a dynamic support level.
Bullish Candle with Volume:
The latest bullish candle is supported by high volume, signaling strong buying interest and potential for further upside.
Huge Volume Activity:
The significant spike in volume during recent moves suggests institutional participation.

BSL - VCP pattern Breakout on Weekly ChartBSL Ltd has given a breakout of Volatility Contraction Pattern (VCP), a bullish setup.
Key points in this VCP:
3T VCP Formation:
1st Contraction: 38.7%
2nd Contraction: 31%
3rd Contraction: 15.86%
These diminishing contractions indicate reduced volatility and a tightening range, suggesting that selling pressure is decreasing.
Breakout:
The price has broken above the consolidation area and resistance line, signaling a potential entry point for a bullish move. This breakout, coupled with high volume, adds strength to the bullish signal.
Volume and Moving Averages: Noticeable volume increases during breakouts from each contraction, supporting the strength of the move. The price is above key moving averages, confirming the uptrend.
Overall, this VCP and breakout pattern suggests a strong bullish setup with potential for upward momentum.

JAIBALAJI - VCP Chart Pattern FormationThe stock is forming a VCP pattern, which is a bullish continuation indicator suggesting potential upside.
There is also a significant increase in volume during the handle formation, confirming buying interest.
CMP - 1152
Entry: Above ₹1,175 (breakout level).
Target 1: ₹1,300
Target 2: ₹1,400
Target 3: ₹1,535
Stop-Loss: ₹1,065
Disclaimer: The stock information shared here is not a recommendation to buy, sell, or hold. It reflects my own analysis and is intended solely for educational purposes. Any actions you take based on this information are your responsibility, and the admin of this channel is not liable for any financial gains or losses. Please consult a financial advisor before making any investment decisions. I am not a SEBI-registered advisor.

DMART - VCP Pattern Breakout On Weekly ChartDMART - VCP Pattern Breakout On Weekly Chart
The stock has formed a Volatility Contraction Pattern (VCP), indicating a potential bullish move.
A breakout above the resistance level has occurred, signaling further upside potential.
Volume - A noticeable increase in volume supports the breakout, which is a positive sign for continuation of the upward trend.
Entry, Targets, and Stop-Loss:
Entry:
Ideal entry point is above ₹5,350, to confirm the breakout.
Targets:
First Target (T1): ₹5,900
Second Target (T2): ₹6,400
Third Target (T3): ₹8,500 (longer-term target based on the measured move from the breakout).
Stop-Loss:
Set stop-loss at ₹4,650, just below the breakout level to manage risk.
Summary:
Entry: Above ₹5,350.
Targets: ₹5,900, ₹6,400, ₹8,500.
Stop-Loss: ₹4,650.
Disclaimer: The stock information shared here is not a recommendation to buy, sell, or hold. It reflects my own analysis and is intended solely for educational purposes. Any actions you take based on this information are your responsibility, and the admin of this channel is not liable for any financial gains or losses. Please consult a financial advisor before making any investment decisions. I am not a SEBI-registered advisor.

Electcast LONG It is making VCP pattern and after breaking out at 208, it has already consolidated and now looking for good upside move.

GUJGASLTD - VCP Chart Pattern BreakoutGUJGASLTD - GUJARAT GAS LTD
~ CMP - 680
~VCP chart pattern breakout with strong volume
~Expecting a quick rally towards 800 in few days
~ Trade Type - Short Term ( 1 month to 2 month)
~ Target 1 - 725
~Target 2 - 780

AMIORG - VCP Chart Pattern Breakout🔊 AMIORG - AMI ORGANICS LTD.
AMIORG - VCP Chart Pattern Breakout
⌛Duration - Short Term (4 month to 8 month)
📊📈 Trade Logic - VCP Chart Pattern Breakout
CMP - 1381.05
Time Frame - Weekly
🎯Target 1 : ₹1680
🎯Target 2 : ₹1888
🎯Target 3 : ₹2125
🛑 Stop : ₹1210
🏆 Risk/Reward Ratio (1: 4.3)
Disclaimer: The stock information shared above is not a recommendation to buy, sell, or hold. It reflects my own analysis and is intended solely for educational purposes. Any actions you take based on this information are your responsibility, and the admin of this channel is not liable for any financial gains or losses. Please consult a financial advisor before making any investment decisions. I am not a SEBI-registered advisor.

BPCL - BHARAT PETROLEUM CORP LTD🔊 BPCL - BHARAT PETROLEUM CORP LTD
⌛Trade Type - Swing Trade (1 week to 2 week)
📊📈 Trade Logic - VCP Pattern
CMP - 356.45
Time Frame - Daily
🎯Target 1 : 375
🎯Target 2 : 390
🎯Target 3 : 400
🎯Target 4 : 420
🛑 Stop : 340
🏆 Risk/Reward Ratio (1: 4)
Disclaimer: The stock information shared above is not a recommendation to buy, sell, or hold. It reflects my own analysis and is intended solely for educational purposes. Any actions you take based on this information are your responsibility, and the admin of this channel is not liable for any financial gains or losses. Please consult a financial advisor before making any investment decisions. I am not a SEBI-registered advisor.

Motilal VCP pattern on Daily - LongMotilal OFS is making Volatility Contraction Pattern. The key elements of the VCP pattern include a prolonged consolidation phase, where the price moves within a relatively narrow range, followed by a breakout or breakdown.
We can use this pattern to identify potential entry points for trades, anticipating that a period of low volatility is likely to be followed by a surge in price movement.
Support 620
Target as per Pattern is 1030
