Vedanta Ltd. - Stock AnalysisDate : 02-Dec-2025
LTP : Rs. 538.40
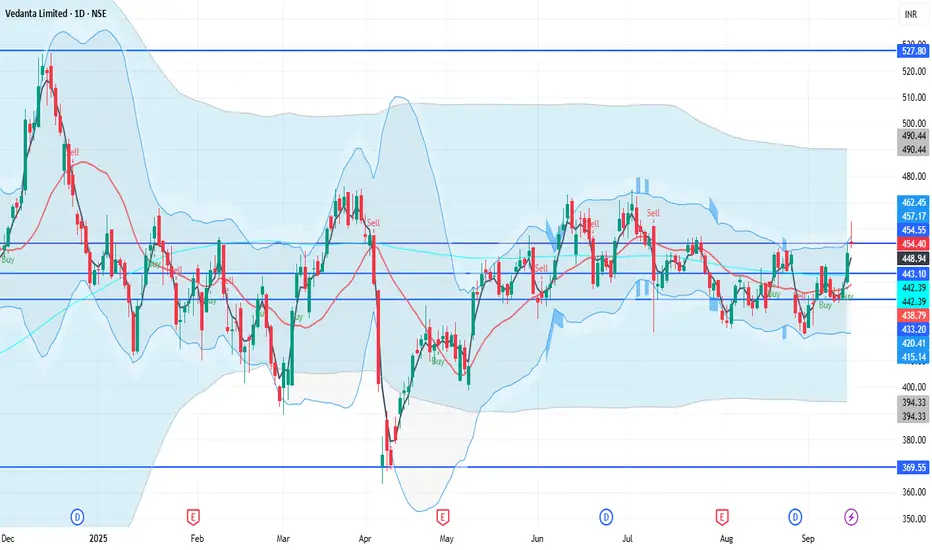
Technical View:
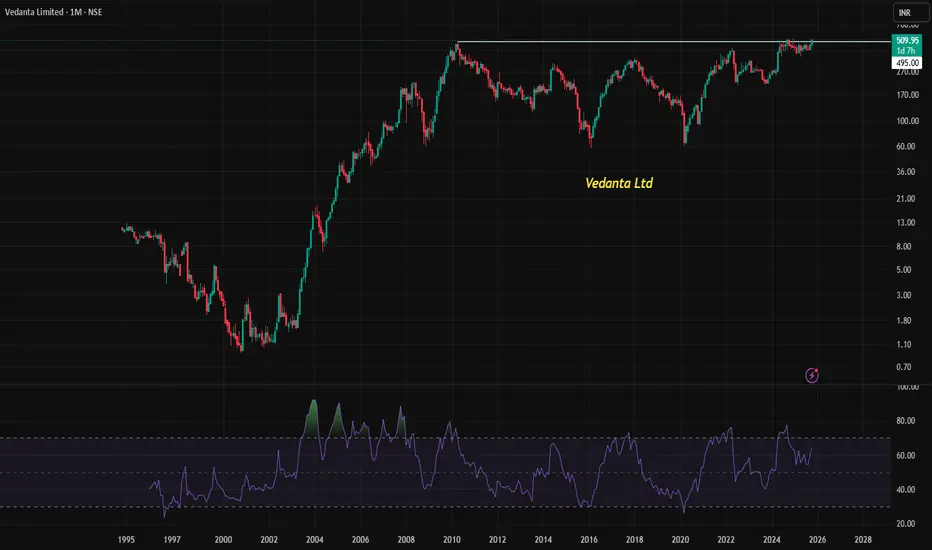
• NSE:VEDL is in primary uptrend since Nov 2023 and currently trading through it's secondary uptrend since 29-Aug-2025.
• During it's previous Secondary Downtrend, it has retraced 31% from 526.95 on 16-Dec-2024 to 363 on 7-Apr-2025.
• NSE:VEDL was going through almost a year long Accumulation Phase and has formed a Rounding Bottom Pattern.
• NSE:VEDL has breakout from a Neckline of Rounding Bottom Pattern with higher than average volume which is indicating a start of Participation Phase.
• NSE:VEDL is trading above 20 DEMA and 50 DEMA since last few sessions.
• MACD is trading at 9.03 and RSI is trading at 66.99.
• NSE:VEDL is looking bullish from here onwards.
• Resistance Levels : (R1) Rs. 625 --> (R2) Rs. 690
• Support Level : Rs. 493
If you have liked this analysis, please Like/Boost this idea and follow me for more ideas.
Disclaimer : I am not a SEBI registered analyst/consultant and not recommending anyone to take any BUY or SELL position in stock market. Investing in stock market is risky and one should do a self analysis and validation before investing in stock market. My ideas are published for learning purpose only and are available to everyone at no cost/charge.
Vedanta

Vedanta Limited is experiencing a major technical breakoutVedanta Limited is experiencing a major technical breakout, surpassing its previous lifetime high from 2010, with strong RSI momentum signaling bullish strength.
📈 Vedanta Limited: A Technical Breakout After 15 Years
Vedanta Limited (NSE: VEDL), a major player in the metals and mining sector, is currently trading around ₹513. This marks a significant milestone, as the stock has broken above its previous lifetime high set in 2010, signaling a long-awaited technical breakout. Such a move is often seen as a strong bullish indicator, especially when supported by other technical metrics.
🔍 What Is a Breakout?
A breakout occurs when a stock moves above a defined resistance level—typically a previous high—on increased volume and momentum. In Vedanta’s case, the resistance was its 2010 peak, which has now been decisively breached. This suggests renewed investor confidence and potential for further upside.
📊 RSI Momentum: A Bullish Signal
The Relative Strength Index (RSI) is a momentum oscillator that measures the speed and change of price movements. It ranges from 0 to 100, with readings above 50 generally indicating bullish momentum. Vedanta’s RSI is currently hovering between 50 and 70, with recent readings around 69.91, placing it firmly in the uptrend zone. This suggests that the stock is gaining strength but hasn't yet entered the overbought territory (above 70), which could mean there's still room for growth.
🧭 Moving Averages Support the Trend
Vedanta’s price is also trading above key moving averages:
50-day SMA: ₹454.8
200-day SMA: ₹441.52
Trading above these averages confirms the bullish trend and adds further credibility to the breakout.
📌 Why This Matters
Long-term breakout: Surpassing a 15-year high is rare and often leads to sustained rallies.
Strong technical indicators: RSI, SMA, and other oscillators are aligned in favor of bulls.
Sector momentum: The metals and mining sector has seen renewed interest, adding tailwinds to Vedanta’s move.
🧠 Investor Takeaway
Vedanta’s breakout above its 2010 high is not just a chart anomaly—it’s a signal of potential long-term trend reversal. With RSI in a healthy range and price action supported by moving averages, technical analysts may view this as a strong buy zone. However, as always, investors should consider broader market conditions and fundamental factors before making decisions.
Live chart Example
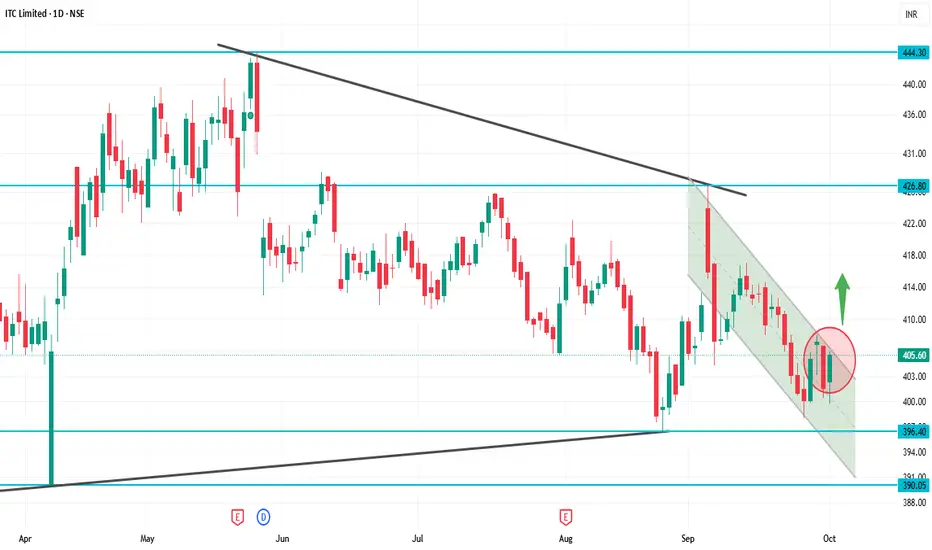
ITC 1D Time frameCurrent Price: ₹405.60
52-Week High: ₹524.35
52-Week Low: ₹390.15
Trend: Downward — trading below 5, 20, 50, 100, 200-day moving averages
Daily Chart Insights
Price below moving averages → bearish trend.
RSI & MACD → weak momentum, signaling short-term selling pressure.
Support zone at ₹390–₹400 → critical; a break below can push price down to ₹370–₹380.
Resistance at ₹420–₹430 → a strong close above may signal trend reversal.
Strategy / Outlook
Bearish Bias: Short-term trend is downward.
Buying Opportunity: Near support zones (₹390–₹400) if it holds.
Bullish Trigger: Close above ₹430 with strong volume indicates potential reversal.
Risk Management: Use stop-loss below critical support zones.
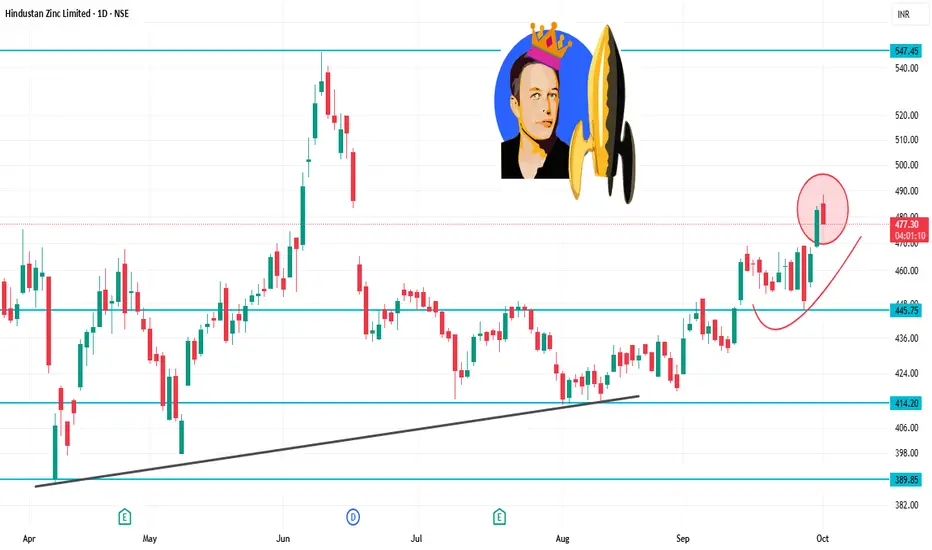
HINDZINC 1D Time frameDay Range: ₹478.35 – ₹488.40
52-Week Range: ₹378.15 – ₹575.40
Volume: 284,459 shares traded
📉 Trend Analysis
The stock is in a downtrend, characterized by:
Lower highs and lower lows.
Failure to break above resistance levels.
The short-term trend remains bearish.
🔮 Conclusion
Hindustan Zinc is in a downtrend with weak momentum.
Break below ₹470.00 could lead to further decline toward ₹460.00.
Break above ₹495.00 would indicate a potential trend reversal.
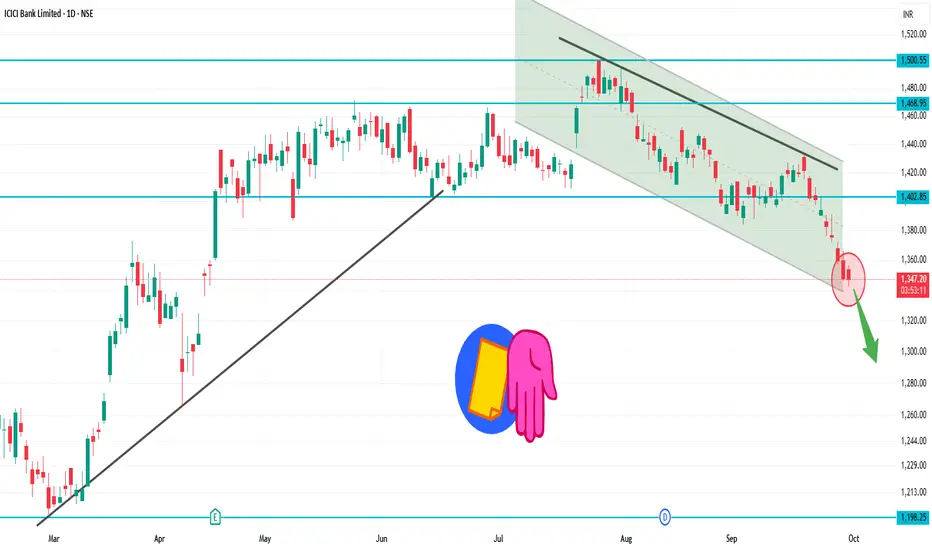
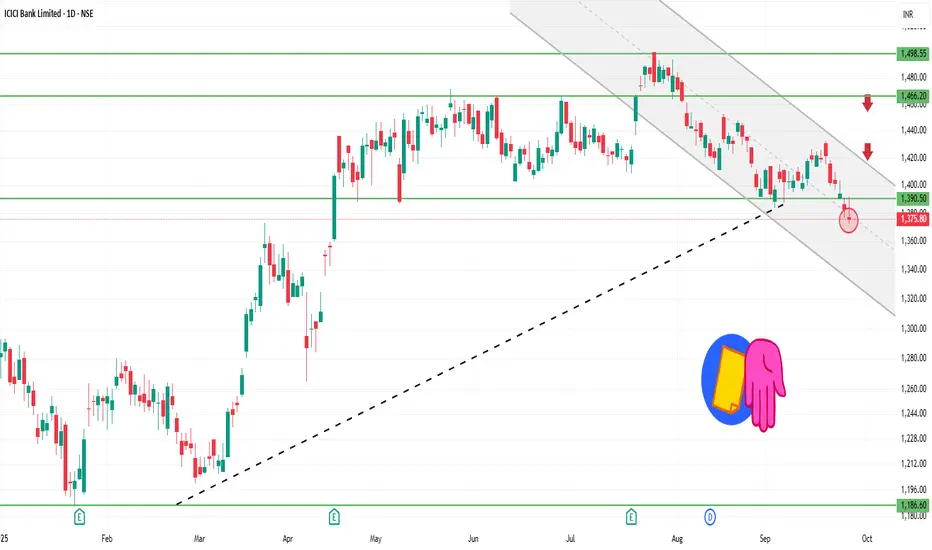
ICICIBANK 1D Time frame₹1,345.80 (NSE)
Day’s Range: ₹1,342.60 – ₹1,356.60
52-Week Range: ₹1,186.00 – ₹1,500.00
📉 Technical Overview
Trend: The stock is trading below its 200-day moving average, indicating a mildly bearish trend.
RSI: Currently at 26.6, suggesting the stock is in the oversold zone.
MACD: At -10.01, reinforcing the bearish momentum.
Moving Averages: A strong sell signal is indicated, with 0 buy signals and 12 sell signals across various timeframes.
🔼 Potential Upside (Rise)
Immediate Resistance: ₹1,355 – ₹1,365
Breakout Target: Above ₹1,365, the next resistance is around ₹1,380 – ₹1,390.
Bullish Confirmation: A close above ₹1,390 could signal a reversal or consolidation.
🔽 Potential Downside (Fall)
Immediate Support: ₹1,340 – ₹1,330
Breakdown Target: Below ₹1,330, the stock may test ₹1,310 – ₹1,300.
Bearish Confirmation: A close below ₹1,300 would strengthen the bearish outlook.
✅ Summary
Above ₹1,365: Potential rise toward ₹1,380 – ₹1,390.
Below ₹1,330: Potential fall toward ₹1,310 – ₹1,300.
Between ₹1,330 – ₹1,365: Likely range-bound movement.
ICICIBANK 1D Time frame📊 Daily Snapshot
Closing Price: ₹1,375.50
Day’s Range: ₹1,371.80 – ₹1,391.50
Previous Close: ₹1,382.70
Change: Down –0.52%
52-Week Range: ₹1,018.85 – ₹1,494.10
Market Cap: ₹9.7 lakh crore
P/E Ratio: 20.5
Dividend Yield: 1.2%
EPS (TTM): ₹67.00
Beta: 1.05 (moderate volatility)
🔑 Key Technical Levels
Support Zone: ₹1,370 – ₹1,375
Resistance Zone: ₹1,390 – ₹1,400
All-Time High: ₹1,494.10
📈 Technical Indicators
RSI (14-day): 34.1 – approaching oversold territory, suggesting potential for a rebound.
MACD: Negative, indicating bearish momentum.
Moving Averages: Trading below the 150-day moving average, indicating a bearish trend.
Candlestick Patterns: Recent formation of a Bearish Engulfing pattern, suggesting potential for further downside.
📉 Market Sentiment
Recent Performance: ICICI Bank has experienced a decline for the fifth consecutive session, underperforming the broader market.
Sector Performance: The NIFTY BANK index also closed lower, reflecting sector-wide weakness.
📈 Strategy (1D Timeframe)
1. Bullish Scenario
Entry: Above ₹1,390
Stop-Loss: ₹1,370
Target: ₹1,405 → ₹1,420
2. Bearish Scenario
Entry: Below ₹1,370
Stop-Loss: ₹1,390
Target: ₹1,355 → ₹1,340
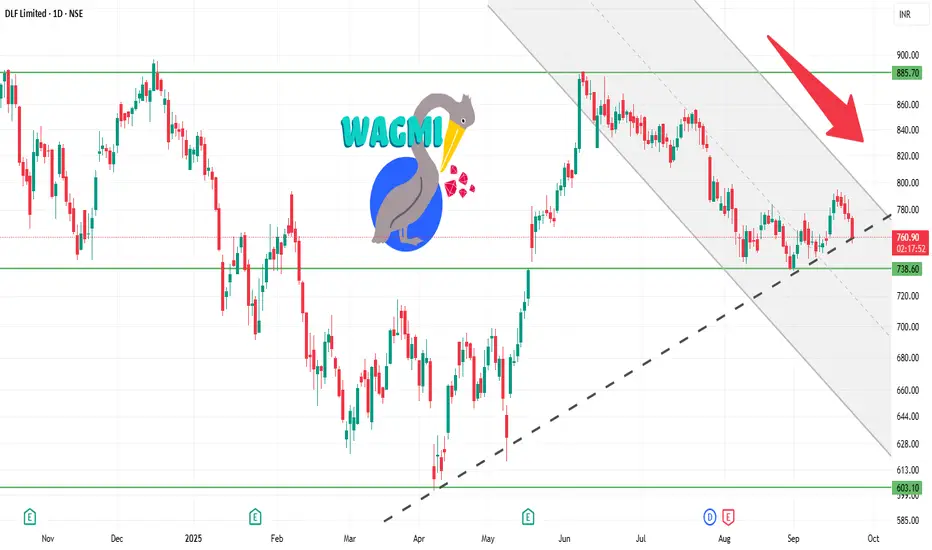
DLF 1D Time frame📍 Today’s Expected Range (Intraday Approximation)
Expected High: ₹767–₹775
Expected Low: ₹756–₹750
These are approximate intraday levels. Actual prices may fluctuate slightly due to market volatility.
🔍 Key Points
Current price: ₹760–₹761, trading near the middle of the day’s range.
If price breaks above ₹767–₹775 with strong volume → bullish momentum likely.
If price falls below ₹756–₹750 → short-term correction or pullback possible.
📊 Suggested Trading Strategy
Bullish Scenario
If DLF breaks ₹767–₹775, you can buy, targeting ₹780–₹785.
Stop-loss: ₹755
Bearish Scenario
If DLF drops below ₹756–₹750, you can sell/short, targeting ₹740–₹735.
Stop-loss: ₹760
Range-Bound / Sideways
If price trades between ₹756–₹767, it’s better to wait and avoid trading until a clear breakout occurs.
💡 Summary
Resistance Zone: ₹767–₹775
Support Zone: ₹750–₹756
Strategy: Trade in the direction of the breakout, and always use stop-loss to manage risk.
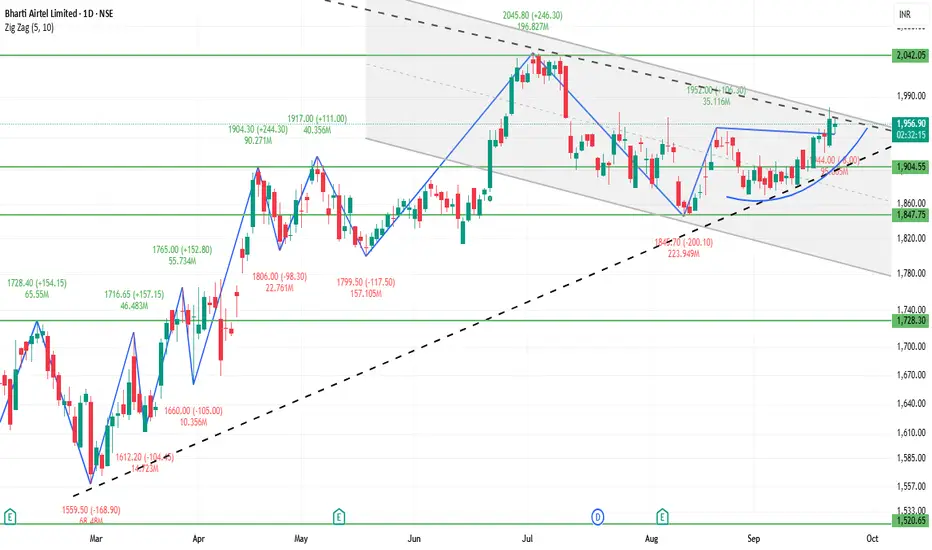
BHARTIARTL 1D Time frame🔍 Current Price & Context
Trading around ₹1,950 – ₹1,960 (approx).
Day’s range recently: low ~ ₹1,944 – ₹1,946, high ~ ₹1,920 – ₹1,925 — showing testing of resistance.
52-week range: low ~ ₹1,510, high ~ ₹2,045.
🧮 Strategy / Trade Ideas
Long Setup:
Entry could be around / just above support zone (₹1,900 – ₹1,895) if there are reversal signals (bullish candles, volume).
Stop loss: slightly below deeper support (~₹1,870 – ₹1,880) to protect against breakdown.
Initial target: resistance around ₹1,920 – ₹1,930. If crossed, then next target near ₹1,950 – ₹1,960.
Short / Pullback Setup:
If price fails to break above resistance (~₹1,920 – ₹1,930) and shows signs of reversal (bearish candle, volume drop).
Target downward to support ~₹1,900, then further to ~₹1,880 – ₹1,870.
Breakout Setup:
If it breaks above ~₹1,950 – ₹1,960 with good volume, then move toward psychological level ~₹2,000 and possibly toward 52-week high (~₹2,045).
✅ Summary
Bharti Airtel in daily chart is showing a mild bullish bias, but the resistance zones (~₹1,920-₹1,930, ₹1,950-₹1,960) are critical. Holding above support around ₹1,900 is important. A clear breakout above resistance could open room for upside; failure to do so may lead to sideways movement or slight downside.
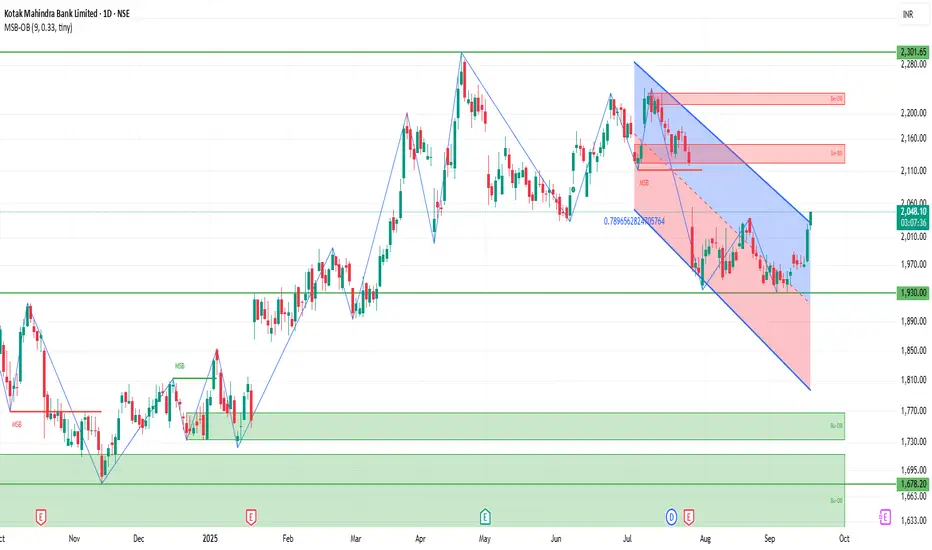
KOTAKBANK 1D Time frame🔍 Current Price & Context
Current Price: ₹2,034.10
Day’s Range: ₹2,027.40 – ₹2,054.60
52-Week Range: ₹1,679.05 – ₹2,301.90
Previous Close: ₹2,031.00
Market Cap: ₹4,04,634 Cr
P/E Ratio: 21.10
Dividend Yield: 0.12%
Beta: 0.97
📊 Technical Indicators
Relative Strength Index (RSI): Approximately 49.64, indicating a neutral stance.
MACD: Positive, suggesting bullish momentum.
Moving Averages:
5-Day: ₹2,032.84
50-Day: ₹2,012.95
200-Day: ₹1,984.69
Pivot Points:
S1: ₹2,029.97
Pivot: ₹2,036.07
R1: ₹2,042.17
🧮 Strategy / Trade Ideas
Long Setup:
Entry: Consider entering near support levels (~₹2,020) if bullish reversal signals appear.
Stop Loss: Place below ₹1,980 to manage risk.
Target: First resistance around ₹2,042, then ₹2,070.
Short Setup:
Entry: If price fails to break above resistance (~₹2,042) and shows signs of reversal.
Stop Loss: Above ₹2,080.
Target: Downside toward ₹2,020, then ₹1,990.

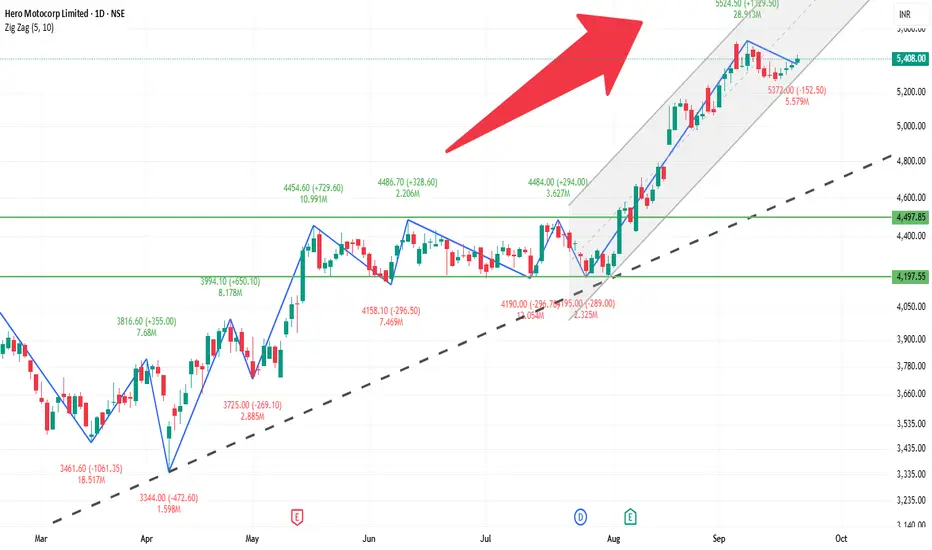
HEROMOTOCO 1D Time frameCurrent Price: 5,408 (near recent highs).
Current Trend: Strong bullish momentum; stock is trading above key resistances.
Support Zone: Immediate support at 5,300 – 5,350. If this holds, uptrend remains intact.
Resistance Zone: Next resistance is around 5,500 – 5,550. A breakout above this can push toward 5,650+.
Indicators: Daily candle structure is bullish, showing higher highs and strong buying interest.
Outlook:
Above 5,500 → continuation of bullish rally.
Below 5,300 → minor weakness; may slip toward 5,200.
👉 In short (with 5,408 price):
Bullish tone.
Range to watch: 5,300 – 5,550.
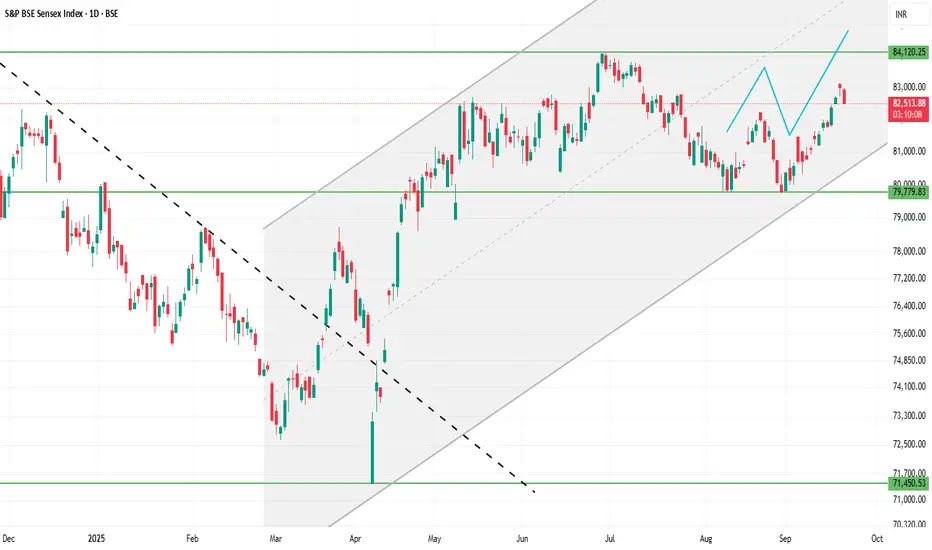
SENSEX 1D Time frameCurrent Trend: Still sideways to mildly bullish, but trading closer to support levels.
Support Zone: Now the strong support shifts to 82,300 – 82,500. If this zone holds, bounce is possible.
Resistance Zone: On the upside, watch 83,200 – 83,500 for resistance. Breakout above this can push price higher.
Indicators: Daily candle suggests consolidation; buyers defending 82,300 zone.
Outlook:
Above 83,500 → fresh bullish momentum likely.
Below 82,300 → weakness can extend further.
👉 In short (based on 82,626 level):
Range: 82,300 – 83,500.
Market neutral, waiting for breakout either side.

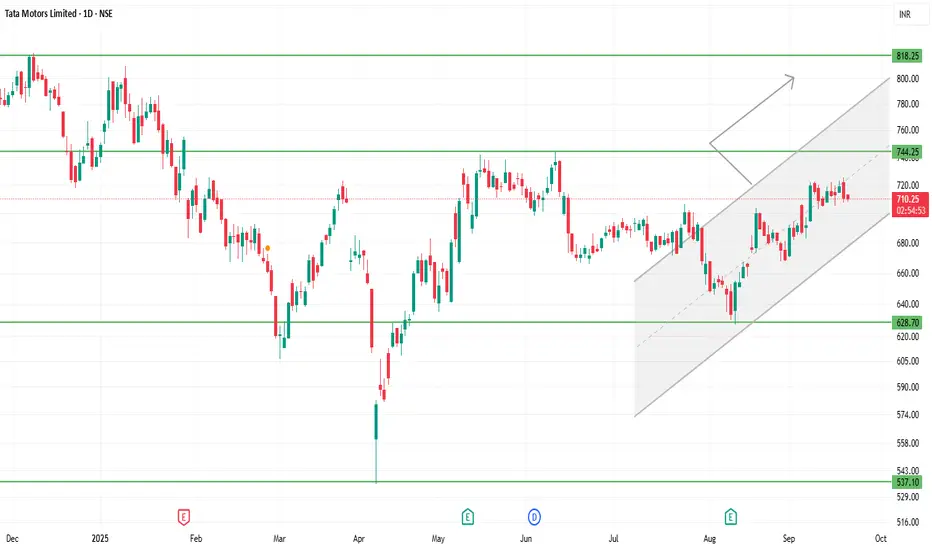
TATAMOTORS 1D Time frameTata Motors is trading around ₹710-₹720 (give or take).
The 52-week high is roughly ₹1,000+, and the 52-week low is approx ₹535-₹550.
There is visible investor concern: production halts (especially in JLR, its luxury arm) and demand pressures are weighing.
Recent performance is mixed; some short-term strength, but many indicators suggest resistance and caution.
⚙️ Technical / Trend Insights
The trend shows a mildly bullish bias in the short-term: price action is forming higher lows (e.g. holding above ₹700-705) which suggests buyers are defending downside.
Resistance zones are limiting gains: repeated attempts to push above ~₹720-725 have met selling.
Momentum indicators (RSI, MACD etc.) are positive but not deeply overbought — there’s room, but risk of pullbacks if resistance holds.
There are hints of bullish chart patterns (for example, ascending structures or potential reversal formations) if price manages to cross certain resistance levels.
⚠️ Risks / Things That Could Go Wrong
If it breaks down below ₹700-705, risk increases toward lower support in the ₹686-₹700 band.
Failure to break above ₹720-₹725 with decent volume could lead to sideways trading or minor corrections.
Macro / sectoral headwinds — demand issues, international business (JLR), cost pressures — could press down on fundamentals.
SENSEX 1D Time frameCurrent Facts
Current Level: 82,590.45 - 82,616.13
Trend: Mildly bullish; trading above short-term moving averages (20-day & 50-day EMA).
Momentum Indicators:
RSI (14-day): ~60 → bullish but not overbought.
MACD: Positive → supporting the uptrend.
Price Action: Daily candles show small upper wicks → minor profit-taking near resistance.
⚙️ Outlook
Bullish Scenario:
Holding above 82,450 → retest 82,650–82,700 and possibly 82,850–82,900.
Range / Consolidation:
Price oscillates between 82,400 – 82,650 → sideways trading likely.
Bearish Scenario:
Close below 82,400 → downside risk toward 82,250–82,300 or lower.
⚠️ Key Facts
82,500–82,600 acts as a short-term pivot: above it favors bulls, below it favors bears.
Resistance at 82,650–82,700 is key; breakout here may trigger further upside.
Support at 82,400–82,450 is critical; failing to hold may lead to short-term correction.
KOTAKBANK 1D Time frameCurrent Stock Price
Current Price: ₹2,045.60
Day’s Range: ₹2,020.30 – ₹2,045.60
52-Week Range: ₹1,679.05 – ₹2,301.90
Market Cap: ₹4.05 lakh crore
P/E Ratio (TTM): 20.47
EPS (TTM): ₹96.30
Dividend Yield: 0.12%
Book Value: ₹740.29
📈 Trend & Outlook
Short-Term Trend: Bullish; the stock is trading above key support levels and showing positive momentum.
Resistance Levels: ₹2,045.60 (day’s high), ₹2,301.90 (52-week high).
Support Levels: ₹2,020.30 (day’s low), ₹2,000.00 (psychological support).
Investor Sentiment: Positive, with strong institutional interest and favorable analyst outlooks.
🧭 Analyst Insights
Valuation: The stock is trading at a P/E ratio of 20.47, which is slightly above the sector average of 19.82, indicating a premium valuation.
Growth Prospects: The bank's strong earnings growth and robust capital position support its premium valuation.
VEDL 1D Time frameCurrent Price
₹454.20
🔹 Market Snapshot
Day’s Range: ₹454.15 – ₹462.80
Previous Close: ₹450.90
52-Week Range: ₹363.00 – ₹526.95
Market Cap: ₹1.80 lakh crore
P/E Ratio (TTM): 12.37
P/B Ratio: 4.81
Dividend Yield: 9.44%
Book Value per Share: ₹95.87
EPS (TTM): ₹37.25
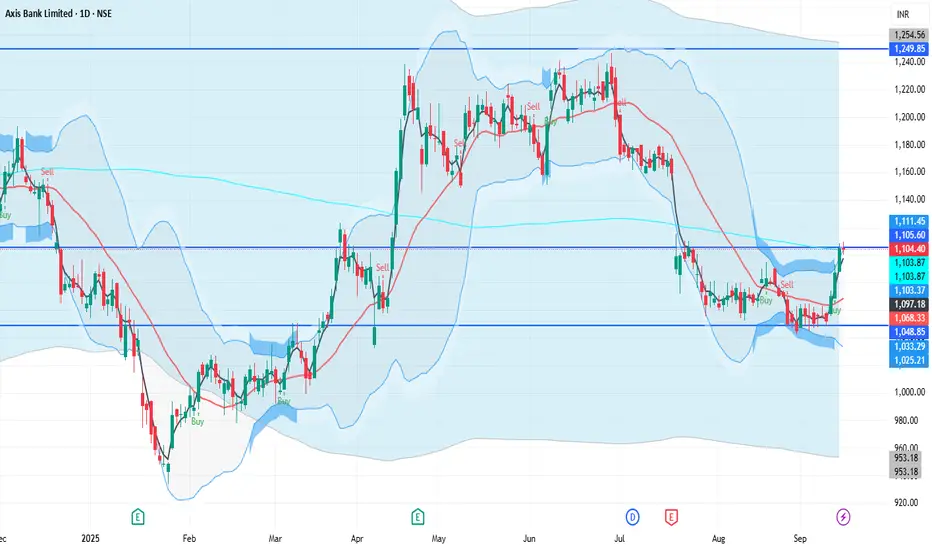
AXISBANK 1D Time frameUpdated Snapshot
Current Price: ₹1,105 – ₹1,107
Day’s Range: ₹1,101 – ₹1,110
Previous Close: ₹1,105.30
🔹 Support & Resistance
Support 1: ₹1,100 – ₹1,095
Support 2: ₹1,085 – ₹1,080
Resistance 1: ₹1,110 – ₹1,115
Resistance 2: ₹1,125 – ₹1,130
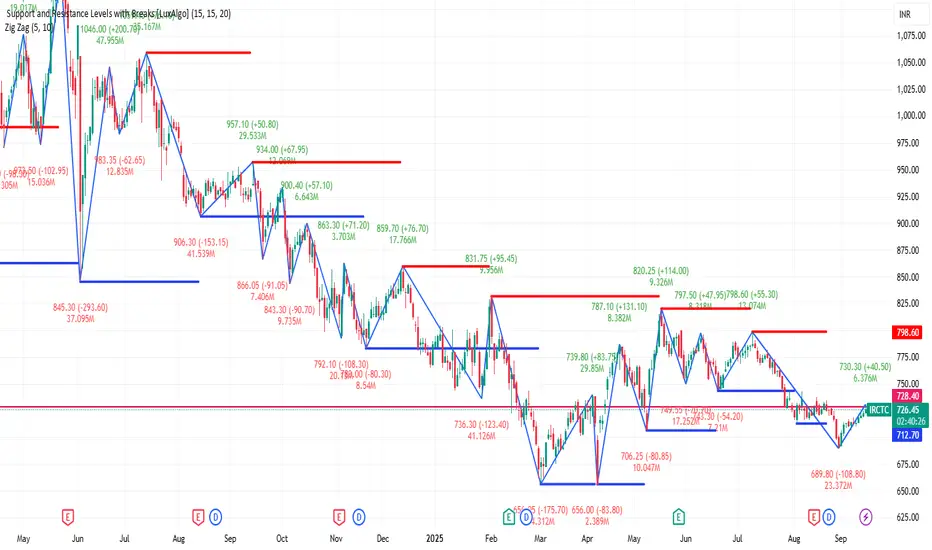
IRCTC 1D Time frameCurrent Price
₹728.65
🔹 Market Snapshot
Day’s Range: ₹722.55 – ₹730.30
Previous Close: ₹722.95
52-Week Range: ₹656.00 – ₹957.10
Market Cap: ₹57,776 crore
P/E Ratio (TTM): 44.33
P/B Ratio: 15.91
Dividend Yield: 0.00%
EPS (TTM): ₹16.44
NIFTY 1D Time frameCurrent Price & Trend
Level: ~25,114
Day’s Range: 25,038 – 25,139
52-Week Range: 21,743 – 26,277
Trend: Neutral to bullish; trading near the higher end of the yearly range.
Bullish Scenario
If NIFTY sustains above 25,000, upside targets are 25,250 – 25,500 in the short term.
Strong buying volumes could lead to new highs beyond 26,000.

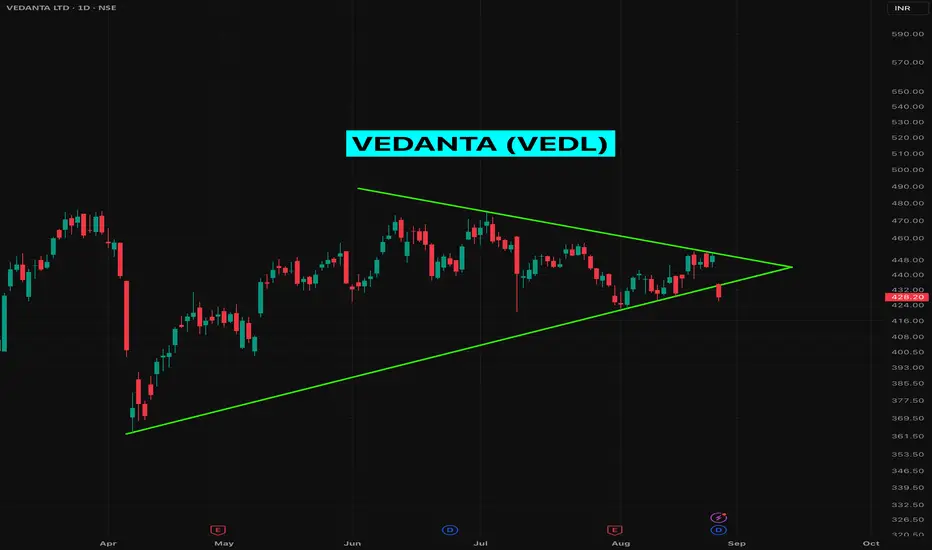
VEDL Bearish Triangle Breakdown!Vedanta (VEDL) is breaking down from a symmetrical triangle pattern on the daily chart, signaling potential downside momentum.
I secured my short position in VEDL before the closing bell today.
Amid bearish technicals, fundamentals add pressure: Vedanta's deleveraging efforts face trust issues with the Indian government, which accuses its oil business of accounting lapses and opposes the proposed split into five units.
The Ministry of Petroleum objects over a legal tussle on $578M dues from Cairn Oil & Gas, withholding payments despite an ongoing appeal. Watch for further declines if support breaks—targeting lower levels. Risk management advised.
VEDANTA Swing Trade with 1:3 RR (Long)Sellers failed to take price below the demand zone and a clear Change of Character (market structure shift) happened that shows buyers have taken control of the price of Vedanta.
So if Nifty and Metal sector are not bearish in coming sessions, then it is high probability that Vedanta will touch Rs 475.
Don't use hard SL. Manage position sizing as it is a high probability setup.
Connect with me if you have any questions. I am happy to help.
ChoCh - Change of Character
Sw or Sweep - Liquidity Sweep
BoS - Break of Structure

VEDANTA: 30% Upside Potential!⚡️Price Analysis:
1️⃣ Price showing strength.
2️⃣ Price structure is bullish.
3️⃣ Overall Sector is strong.
4️⃣ Broke the ATH resistance level.
✨ Key Observations:
➡️ RRR favourable at CMP.
➡️ Price did retest of the trendline confirming strength.
➡️ Fast momentum should start post 500 level till than it might struggle to move fast.
⚠️ Disclaimer: This is NOT a buy/sell recommendation. This post is meant for learning purposes only. Views are personal. Please, do your due diligence before investing.⚠️

Vedanta cmp 460.00 by Weekly Chart viewVedanta cmp 460.00 by Weekly Chart view
- Price Band 418 to 438 Support Zone
- Volumes are seen as steady and stable over the past few weeks
- Stock seemingly respecting and now testing retesting good Support Zone
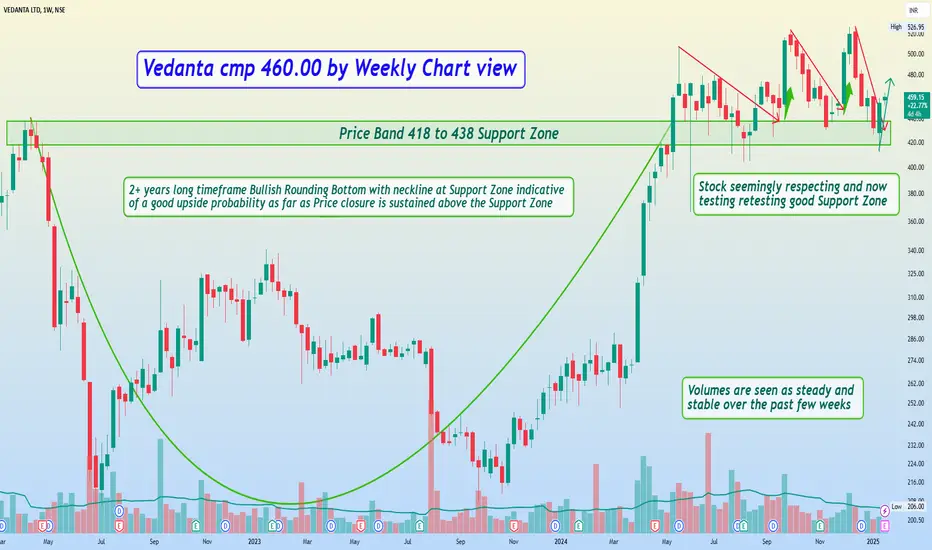
Vedanta cmp 449.75 by Weekly Chart viewVedanta cmp 449.75 by Weekly Chart view
- Price Band 418 to 436 Support Zone
- Next Support Zone 321 to 331 at Price Band
- Volumes are seen as steady and stable over the past few weeks
- Stock seemingly respecting and testing retesting good Support Zone 420 to 440
- 2+ years long timeframe Bullish Rounding Bottom with neckline at Support Zone
- Technical setup indicative of good upside probability until Price closure sustains above Support Zone
