HOW TO WATCHLIST TABLE-VIEW TOOL IN TRADINGVIEWComplete Process: HOW TO WATCHLIST TABLE-VIEW TOOL IN TRADINGVIEW
1️⃣ Open the Watchlist Panel
➺ The Watchlist panel is located on the right side of the Trading-View interface.
➺ If it is hidden, click the small arrow on the right edge to open it.
2️⃣ Locate the Table-View Tool
➺ At the top of the watchlist panel, you will see three dot icon.
➺ This icon opens the table-view tool inside the watchlist.
3️⃣ Open the Table-View
Step-by-step:
➺ Click the table icon at the bottom of the watchlist.
➺ The watchlist will switch from the normal list-view to the table-view layout.
4️⃣ Understanding the Table-View Layout
The table-view displays additional columns and organized data in a tabular format.
Typical columns include:
⤷ Symbol
⤷ Last Price
⤷ Change (%)
⤷ Volume
⤷ High / Low
⤷ Session Data
⤷ Custom fields (depending on settings)
The table-view allows users to compare multiple symbols more clearly.
5️⃣ How to Add Columns in Table-View
Step-by-step:
➺ Hover on the column header area.
➺ Click the plus (+) icon or “Add Column” option.
➺ Choose the data you want to add:
⤷ Price
⤷ Change
⤷ Bid / Ask
⤷ Volume
⤷ Open Interest
⤷ Fundamentals (if supported)
⤷ Other available fields
The selected column will appear immediately.
6️⃣ How to Remove Columns
Step-by-step:
➺ Hover over the column header you want to remove.
➺ Click the three-dot menu (⋮) on that column.
➺ Select “Remove Column”.
➺ The column will be removed from the table.
7️⃣ How to Reorder Columns
Step-by-step:
➺ Click and hold the column header.
➺ Drag it left or right.
➺ Release to place it in the new position.
This helps personalize the table layout.
8️⃣ Sorting Symbols in Table-View
Step-by-step:
➺ Click any column name (for example: Price, Change %, Volume).
➺ Clicking once sorts the column ascending.
➺ Clicking again sorts descending.
➺ A small arrow appears showing the sort direction.
9️⃣ Switch Back to Normal Watchlist View
Step-by-step:
➺ Click the same table icon at the bottom again.
➺ The watchlist returns to the default list-view.
🎯 Short Summary (Optional for Captions)
⤷ Open Table-View → Bottom table icon
⤷ Add Columns → Add Column option
⤷ Remove Columns → Three-dot menu → Remove
⤷ Reorder → Drag column headers
⤷ Sort → Click column name
⤷ Return to List → Click table icon again
View

STAR CEMENT LTD | Strong Breakout After Long-Term Consolidation 📝 Description:
📌 Stock: STAR CEMENT LTD (NSE)
📅 Timeframe: 1D (Daily)
📈 Breakout Date: 04-Aug-2025
💼 Sector: Cement / Infrastructure
⚡️ Technical Setup:
Breakout Above Long-Term Resistance:
Price has finally broken through the ₹240–₹256 resistance zone, which had capped upside for nearly a year.
Strong Volume Confirmation:
The breakout is accompanied by a significant rise in volume, adding credibility to the move and indicating strong buyer interest.
Bullish Market Structure:
Price has shifted into a higher high–higher low structure over the last few weeks, confirming momentum build-up.
Range Built-Up Base:
Price consolidated within ₹190–₹240 for over 10 months, creating a solid foundation for the breakout.
🔍 Key Observations:
📊 Chart Pattern:
The chart shows a horizontal breakout from a long-term consolidation zone between ₹240–₹256. This breakout signals a bullish continuation, as the stock pushes above a multi-month supply zone with strong momentum.
📈 Recent Price Action:
• The stock gave a clean breakout on 04-Aug-2025, closing above the resistance zone required with strong follow-through.
• The rally was supported by 2.5× surge in volume, indicating institutional interest.
• Price structure shows confirming trend reversal from range-bound to bullish.
• This breakout comes after 10+ months of consolidation, adding more weight to the move.
Add-ons:-
✅ Clean breakout with follow-through above ₹256.
🔼 No immediate supply zone until ₹280–₹290 range.
🔁 ₹240 now becomes a key support level.
📊 Increasing volume supports institutional accumulation possibility.
📌 Trade View:
Aggressive Entry:
• Entry around current levels if price holds above the breakout zone (₹256+).
• Use a stop-loss as per your risk plan.
Conservative Entry:
• Wait for a retest of the breakout zone (₹240–₹256) with confirmation through price action and volume support.
• Ideal for traders preferring high conviction and lower risk.
•Bias: Bullish
•Support: ₹240 (flip level), ₹225 (minor swing)
•Invalidation: Close below ₹240
🧠 Rationale:
The long base, clean breakout, and strong volume together suggest a high-probability bullish continuation. Absence of nearby resistance offers a decent runway towards the ₹280–₹290 zone. This move is also backed by strength in the broader cement sector.
🚨 Disclaimer: This is not financial advice. All views are shared for educational purposes only. Always do your own research and manage risk responsibly before making any trading decisions.
What is your view please comment it down and also boost the idea this help to motivate us.

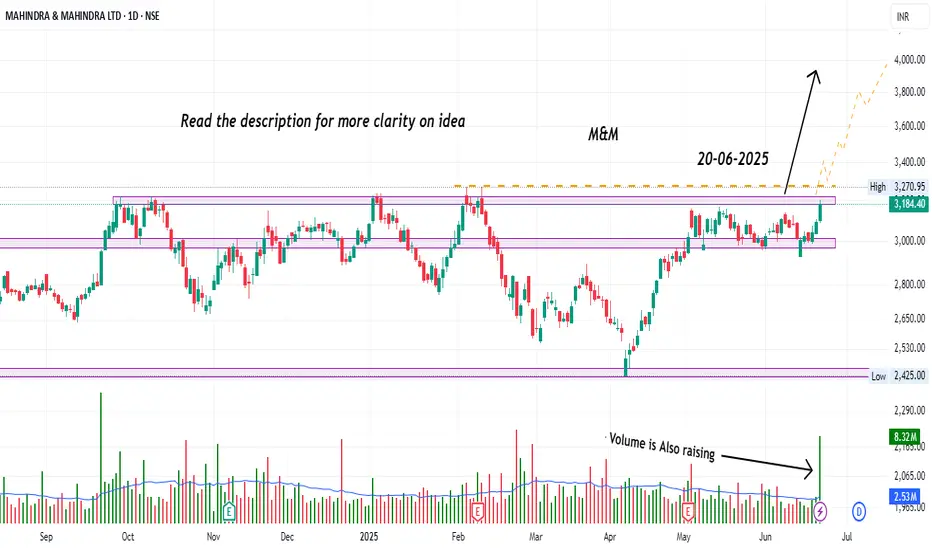
Mahindra & Mahindra – Activity Picking Up! Watch CloselyHey Family, here’s another stock showing a strong technical setup! 🚀
📈 Stock: Mahindra & Mahindra Ltd (NSE: M&M)
🔍 Key Observations:
📊 Chart Pattern:
The stock is displaying a Horizontal Breakout Setup from a well-defined multi-month resistance zone, dating back to 07-10-2021. This forms a strong bullish continuation base, indicating potential for a sustained move higher.
📈 Recent Price Action:
• M&M has recently tested the upper boundary of its resistance zone around ₹3,270, which has been respected multiple times in the past (notably on 18-06-2025 and 20-06-2025).
• The current close at ₹3,184.40 (+2.90%) on June 20, 2025, shows increasing buying momentum near this critical resistance level.
• Volume surged to 8.32M, significantly above average, confirming institutional participation and validating the price action.
📦 Volume Insight:
The volume spike on the breakout attempt signals strong accumulation. This is a vital confirmation factor for the bullish case.
💡 Trading Recommendation:
Aggressive Approach:
• Traders can consider participating based on the current price structure, using proper risk management techniques aligned with individual trading plans.
Conservative Approach:
• Alternatively, wait for a clear breakout confirmation with strong follow-through and closing strength above the resistance zone before considering entry. This helps reduce false breakout risks.
🧠 Rationale:
The recent price behavior, combined with heightened volume activity, reflects growing interest in the stock. Such conditions often signal a shift in market sentiment. Observing how the stock reacts in the coming sessions can provide useful cues. Traders should focus on structure, strength, and participation—adapting their approach based on personal style and risk preference.
🚨 Disclaimer: This is not financial advice. All views are shared for educational purposes only. Please do your own research and always manage your risk before making any trading decisions.
📢 What’s your view? Drop it in the comments and boost the idea if you found it useful – your support helps us keep sharing quality setups! 💬🔥
ASTRAMICRO in Bullish modeHey Family, here’s another stock showing a strong technical setup! 🚀
📈 Stock: Astra Microwave Ltd (NSE: ASTRA)
🔍 Key Observations:
📊 Chart Pattern:
The chart shows a Horizontal Breakout from a long-term consolidation zone. This is a bullish continuation setup, signaling potential for further upside as the stock breaks above key resistance levels.
📈 Recent Price Action:
• The stock broke out last week, showing strong bullish momentum.
• This week’s price action indicates a healthy consolidation above the breakout level, suggesting buyer strength and continued interest.
• Volume activity supports the move, adding conviction to the breakout.
💡 Trading Recommendation:
Aggressive Entry:
• Enter based on current price structure to ride the breakout early.
• Use a stop-loss according to your risk tolerance and trading capacity.
Conservative Entry:
• Wait for a decisive move above the highlighted supply zone for confirmation.
• This approach helps minimize risk and confirms sustained strength.
🧠 Rationale:
The breakout from horizontal resistance, backed by solid price and volume structure, suggests a high-probability bullish continuation. Choose an entry style that aligns with your trading plan and risk profile.
🚨 Disclaimer: This is not financial advice. All views are shared for educational purposes only. Always do your own research and manage risk responsibly before making any trading decisions.
What is your view please comment it down and also boost the idea this help to motivate us.

KRISHANA PHOSCHEM LTD | Major Breakout Trade UpdateHey Family, here’s another stock showing a strong technical setup! 🚀
Key Observations:
Gain About From 279 to 348 (24% Approx.)
Pattern: Formation of a Rectangle Box Pattern on the Daily Timeframe (1D).
Volume Insight:
Noticeable volume accumulation over the past few sessions.
Volume spikes during breakout candles suggest strong buyer interest.
Candlestick Structure:
Strong bullish candles with minimal rejection indicate a genuine attempt to break out.
🚨 Disclaimer: What is your view please comment it down and also boost the idea this help to motivate us. We are Certified. All views shared on this channel are my personal opinion and is shared for educational purpose and should not be considered advise of any nature.
🚨 Note: Always manage risk and do your own research.

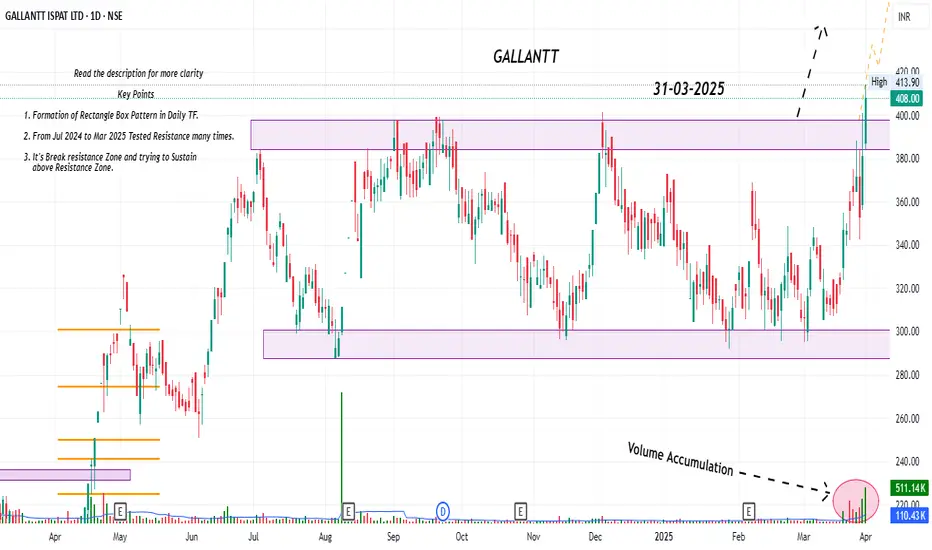
GALLANTT Breakout Possible with a good upside potentialHey Family, there is a one more stock Which is showing a great opportunity.
Key Points:-
* Formation of Rectangular box Pattern in Daily TF.
* From Jul 2024 to Mar 2025 its in range.
* From Jul 2024 to Mar 2025 Tested & Moving Near Resistance Many times.
* It's Break resistance Zone and trying to sustain above Resistance Zone, Only Enter when good volume good closing.
* Volume is Rising (Volume Accumulation).
What is your view please comment it down and also boost the idea this help to motivate us. We are Certified. All views shared on this channel are my personal opinion and is shared for educational purpose and should not be considered advise of any nature.
KAMATHOTEL |Upcoming Trade set up|Hey Family, there is a one more stock Which is showing a great opportunity.
Key Points:-
* Formation of Range Bound Pattern in Daily TF.
* From Apr 2024 to Mar 2025 Tested & Moving Near Resistance Many times.
* It's Near resistance Zone and trying to Break Resistance Zone with good volume good closing required.
* Volume Accumulation (Volume is Rising).
* Got many DM about not uploading the idea those who want to trade and risk the capital they can take this risky trade. We have held off on publishing ideas on TradingView due to the bearish market trends observed over the past months.
What is your view please comment it down and also boost the idea this help to motivate us. We are Certified. All views shared on this channel are my personal opinion and is shared for educational purpose and should not be considered advise of any nature.

ASHAPURMIN is Set to rally! Time to go Long!Hey Family, there is a one more stock Which is showing a great opportunity.
Key Points:-
* Formation of Ascending Triangle Pattern in Daily TF.
* From Dec 2023 to Jan 2025 Tested Resistance Many times.
* It's Break resistance Zone and trying to Sustain above Resistance Zone with good volume good closing required.
* Volume Accumulation (Volume is Rising).
What is your view please comment it down and also boost the idea this help to motivate us. We are Certified. All views shared on this channel are my personal opinion and is shared for educational purpose and should not be considered advise of any nature.

INDIACEM Breakout Possible with a good upside potentialHey Family, there is a one more stock Which is showing a great opportunity.
Key Points:-
* Formation of Rectangular box Pattern in Daily TF.
* From Jul 2024 to Jan 2025 its in range.
* From Jul 2024 to Jan 2025 Tested & Moving Near Resistance Many times.
* It's Near resistance Zone and trying to Break Resistance Zone Only Enter when good volume good closing.
* Volume is not Rising.
* We have held off on publishing ideas on TradingView due to the bearish market trends observed over the past month..
What is your view please comment it down and also boost the idea this help to motivate us. We are Certified. All views shared on this channel are my personal opinion and is shared for educational purpose and should not be considered advise of any nature.

HCLTECH |Upcoming Trade set up|Hey Family, there is a one more stock Which is showing a great opportunity.
Key Points:-
* Formation of Ascending Triangle Pattern in Daily TF.
* From Sep 2024 to Nov 2024 Tested & Moving Near Resistance Many times.
* It's Near resistance Zone and trying to Sustain Near Resistance Zone with good volume good closing required.
* Volume Accumulation (Volume is Rising).
What is your view please comment it down and also boost the idea this help to motivate us. We are Certified. All views shared on this channel are my personal opinion and is shared for educational purpose and should not be considered advise of any nature.

TTL Breakout with a good upside potentialHey Family, there is a one more stock Which is showing a great opportunity.
Key Points:-
* Formation of Rectangular box Pattern in Daily TF.
* From Feb 2024 to Oct 2024 its in range.
* From Feb 2024 to Oct 2024 Tested & Moving Resistance Many times.
* It's Break resistance Zone and trying to Sustain Above Resistance Zone with good volume good closing required.
* Volume Accumulation (Volume is Rising).
What is your view please comment it down and also boost the idea this help to motivate us. We are Certified. All views shared on this channel are my personal opinion and is shared for educational purpose and should not be considered advise of any nature.

FIVESTAR is Set to rally! Time to go Long!Hey Family, there is a one more stock Which is showing a great opportunity.
Key Points:-
* Formation of Rectangular box Pattern in Daily TF.
* From Aug 2024 to Oct 2024 its in range.
* From Aug 2024 to Oct 2024 Tested & Moving Resistance Many times.
* It's Break resistance Zone and trying to Sustain Above Resistance Zone with good volume good closing required.
* Volume Accumulation (Volume is Rising).
What is your view please comment it down and also boost the idea this help to motivate us. We are Certified. All views shared on this channel are my personal opinion and is shared for educational purpose and should not be considered advise of any nature.

HCLTECH Breakout with a good upside potentialHey Family, there is a one more stock Which is showing a great opportunity.
Key Points:-
* Formation of Ascending Triangle Pattern in Daily TF.
* From Sep 2024 to Oct 2024 Tested & Moving Near Resistance Many times.
* It's Break resistance Zone and trying to Sustain above Resistance Zone with good volume good closing required.
* Volume Accumulation (Volume is Rising).
What is your view please comment it down and also boost the idea this help to motivate us. We are Certified. All views shared on this channel are my personal opinion and is shared for educational purpose and should not be considered advise of any nature.

LALPATHLAB |Upcoming Trade set up|Hey Family, there is a one more stock Which is showing a great opportunity.
Key Points:-
* Formation of Rectangular box Pattern in Daily TF.
* From Aug 2024 to 3 Oct 2024 its in range.
* From Aug 2024 to 3 Oct 2024 Tested & Moving Resistance Many times.
* It's Break resistance Zone and trying to Sustain Above Resistance Zone with good volume.
* Volume Accumulation (Volume is Rising).
What is your view please comment it down and also boost the idea this help to motivate us. We are Certified. All views shared on this channel are my personal opinion and is shared for educational purpose and should not be considered advise of any nature.

#banknifty - 24th September !Support and resistance are key concepts in technical analysis used to identify potential price levels where assets may reverse or stall.
Support:
-Definition: A support level is a price point where buying interest is strong enough to overcome selling pressure, preventing the price from falling further.
- Indicators: Support levels can be identified through historical price data, trend lines, or moving averages.
- Behavior: When a price approaches support, it may bounce back up. If broken, it can become a new resistance level.
Resistance:
- Definition: A resistance level is a price point where selling interest is strong enough to overcome buying pressure, preventing the price from rising further.
- Indicators: Similar to support, resistance levels can be identified through past price action, trend lines, or moving averages.
- Behavior: When the price approaches resistance, it may retreat. If broken, it can turn into a new support level.
Importance:
- Trade Decisions: Traders use these levels to make buy or sell decisions, set stop-loss orders, and identify potential profit targets.
- Market Psychology: Support and resistance levels reflect market sentiment and the balance between supply and demand.
Understanding these concepts can enhance trading strategies and improve decision-making.

HEROMOTOCO Mega Breakout AheadHey Family, there is a one more stock Which is showing a great opportunity.
Key Points:-
* Formation of Rectangular box Pattern in Daily TF.
* From Jun 2024 to Sep 2024 its in range.
* From Jun 2024 to Sep 2024 Tested & Moving Resistance Many times.
* It's Near resistance Zone and trying to Break Resistance Zone with good volume, good Closing Required.
* Volume is Missing.
What is your view please comment it down and also boost the idea this help to motivate us. We are Certified. All views shared on this channel are my personal opinion and is shared for educational purpose and should not be considered advise of any nature.

LINC Breakout with a good upside potentialHey Family, there is a one more stock Which is showing a great opportunity.
Key Points:-
* Formation of Ascending Triangle Pattern in Daily TF.
* From Jan 2024 to Sep 2024 Tested & Moving Near Resistance Many times.
* It's Near resistance Zone and trying to Break Resistance Zone with good volume good closing required.
* Volume Accumulation (Volume is Rising).
What is your view please comment it down and also boost the idea this help to motivate us. We are Certified. All views shared on this channel are my personal opinion and is shared for educational purpose and should not be considered advise of any nature.

CYBERTECH - Breakout with a good upside potentialHey Family, there is a one more stock Which is showing a great opportunity.
Key Points:-
* Formation of Rectangular box Pattern in Daily TF.
* From Jan 2024 to Aug 2024 its in range.
* From Jan 2024 to Aug 2024 Tested & Moving Resistance Many times.
* It's Near resistance Zone and trying to Sustain above Resistance Zone with good volume.
* Volume Accumulation (Volume is rising).
What is your view please comment it down and also boost the idea this help to motivate us. We are Certified. All views shared on this channel are my personal opinion and is shared for educational purpose and should not be considered advise of any nature.

BHAGERIA Mega Breakout AheadHey Family, there is a one more stock Which is showing a great opportunity.
Key Points:-
* Formation of Ascending Triangle Pattern in Daily TF.
* From Sep 2022 to Aug 2024 Tested & Moving Near Resistance Many times.
* It's Near resistance Zone and trying to Sustain above Resistance Zone with good volume.
* Volume Accumulation (Volume is Rising).
What is your view please comment it down and also boost the idea this help to motivate us. We are Certified. All views shared on this channel are my personal opinion and is shared for educational purpose and should not be considered advise of any nature.

GUFICBIO is Set to rally! Time to go Long!Hey Family, there is a one more stock Which is showing a great opportunity.
Key Points:-
* Formation of Symmetrical Triangle Pattern in Daily TF.
* From June 2024 to Aug 2024 its in range.
* After June 2024 Breakout goes to sideways in July Starting & Now it's breaking the sideways level again in Aug 2024.
* It's Break resistance Zone and trying to sustain above Resistance Zone with good volume, Good Closing is required for good move.
* Already tested resistance many times.
* Volume Accumulation (Volume is Building).
What is your view please comment it down and also boost the idea this help to motivate us. We are Certified. All views shared on this channel are my personal opinion and is shared for educational purpose and should not be considered advise of any nature.

CESC is getting ready for big move!Hey Family, there is a one more stock Which is showing a great opportunity.
Key Points:-
* Formation of Ascending triangle Pattern in Daily TF.
* From Jul 2024 to Aug 2024 Moving in a range.
* From Jul 2024 to Aug 2024 Tested & Moving Near Resistance zone.
* It's near resistance Zone and trying to break Resistance Zone with good volume.
* Volume Accumulation (Volume is Rising).
What is your view please comment it down and also boost the idea this help to motivate us. We are Certified. All views shared on this channel are my personal opinion and is shared for educational purpose and should not be considered advise of any nature.

WABAG is Ready to fly!Hey Family, there is a one more stock Which is showing a great opportunity.
Key Points:-
* Formation of Rectangle Box Pattern in Daily TF.
* From June 2024 to Aug 2024 Moving in a 200 point range.
* It's break resistance Zone and trying to Sustain Above Resistance Zone with good volume.
* Volume Accumulation (Volume is Rising).
What is your view please comment it down and also boost the idea this help to motivate us. We are Certified. All views shared on this channel are my personal opinion and is shared for educational purpose and should not be considered advise of any nature.

SHAILY again getting ready for big move!Hey Family, there is a one more stock Which is showing a great opportunity.
Key Points:-
* Formation of Rectangle Box Pattern in Daily TF.
* From Jul 2024 to Aug 2024 Moving in a range.
* It's break resistance Zone and trying to Sustain Above Resistance Zone with good volume.
* Volume Accumulation (Volume is Rising).
What is your view please comment it down and also boost the idea this help to motivate us. We are Certified. All views shared on this channel are my personal opinion and is shared for educational purpose and should not be considered advise of any nature.
