GBPNZDI will be looking for buys on GN this week.
Technical reasons:
Price has flipped the 4H bearish structure and created a strong impulsive move to the upside. Since then, momentum into the demand zone has been weak, which is exactly what I want to see in a healthy pullback. There’s also liquidity resting above 4H high, which makes a great first target for the next leg up.
This is a high-probability setup, as it aligns with trend continuation.
Also price made accumulation and the demand zone just aligns with 70% pullback.
Let’s see how the market plays out.
Viraltrade

“The Art of Traps: Understanding Fake Breakouts in XAUUSD”“The Art of Traps: Understanding Fake Breakouts in XAUUSD”
This chart illustrates how gold (XAUUSD) is currently navigating a critical battle between resistance and support.
At the top, the resistance zone (3440–3460) has already shown signs of rejection, hinting at a possible fake breakout scenario. Such traps are common in financial markets—they draw traders into buying late, only for price to reverse and capture liquidity.
On the downside, the chart highlights two important stages:
The first target lies around 3400, where short-term buyers may start taking profits.
The final target sits at the key support zone (3330–3320), which has acted as a structural backbone in past moves. If this level holds, we can expect another bullish leg; if broken, deeper downside pressure could unfold.
The sequence of higher lows in recent weeks demonstrates strength in the broader trend, but it also warns that markets are building energy before a larger move. Liquidity sweeps (marked in the chart) serve as reminders that price does not move randomly—it often seeks zones where orders are concentrated.
🔑 Educational Takeaway:
Trading is not just about spotting breakouts; it’s about understanding whether those moves are genuine or deceptive. By studying price behavior at resistance and support, traders can avoid falling into liquidity traps and position themselves with the “smart money.”

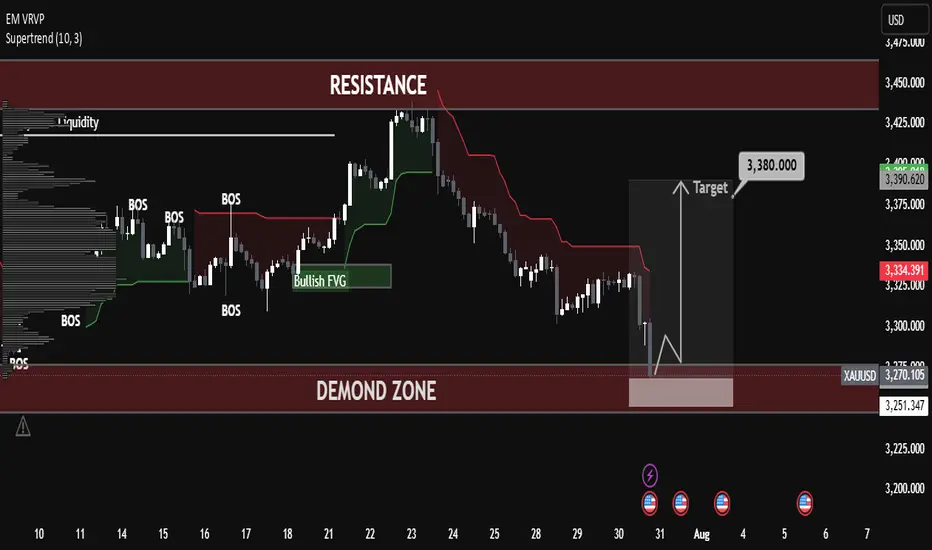
Gold Took Support – Now Bulls Are in Control! Gold Took Support – Now Bulls Are in Control!
Gold (XAUUSD) price has taken a strong bounce from the support zone, and now it’s looking bullish. Market reacted nicely from the demand zone, which means buyers are stepping in again.
📊 Technical Analysis:
✅ Strong Support Zone (3260–3280):
This area is acting like a strong base. Price touched here and immediately bounced — showing buying pressure.
🔄 Break of Structure (BOS):
Market broke the previous structure and gave signs of trend reversal. It also grabbed liquidity from the lows.
🟩 Bullish Fair Value Gap (FVG):
A clean FVG was formed and respected, which shows institutional activity and buying interest.
🎯 Target Level – 3366.984 USD:
If bullish momentum continues, gold can easily move towards this level. It’s also near a previous resistance.
📚 Educational Points:
Market took liquidity from the lows and reversed
Fair Value Gap is respected, adding confirmation
Structure break confirms buyers are in control
Price is heading towards the next resistance zone
📌 Conclusion:
Gold is now in a bullish phase. As long as the support zone is holding, buyers can stay confident. Target remains near 3366–3380 USD. Any pullback can give a good buy opportunity.
sunday special breakout grab it btcusdtsunday special one took a call
just breaked the trendline hence grab it
stoploss and tp mentioned
just wait and watch.... n enjoyy
text me if want more
keep follows and boost
#BTCUSDT

NIFTY 50 15SEPT2023 SUPPORT LEVELSAs Per Our Previous Analyic Already told If the Market trades above 20100 then a buy-side move possible. Today Market Opened at 20100 and made a High 20167 But From There market Was Rejection Because 20100/20200 Our Resistance Levels Already Told tomorrow And Support Levels at 20000 market made a low at 20045 Market Trad today Sideway Nifty50.
For Tomorrow Levels Support and Resistance
Market needs to Break High 20167 then a buying side move is possible. and make a new high
For Downside, We have Support Levels 20100/20064
if the market trades below 20000 then a put side entry is possible and a good move we expected.
ASPER OI Data
20100 Pe Writer is high so the Market Get Resistance there
#nifty #tradinview
#banknifty
#optiontrading #tradingview
#santubittu #optionking #tradinganalyis

Price ActionNas100 has a huge potential of coming down and rally up, if the support hold the price well. Remember to use a proper risk management, be safe, Lets Download Success

AU Small Finance Bank Limited ( Swing Trade)ABOUT
AU Small Finance Bank Limited is engaged in providing a range of banking and financial services including retail banking, wholesale banking, treasury operations and other services.
BUSINESS SEGMENTS :-
Personal Banking: It includes branch banking (Savings Account, Term Deposit, Bank Locker, Life & Health Insurance, General & Fire Insurance, Mutual Fund and 3 in 1 Trading Account) and Loans & Advances (Vehicle Loan, Home Loan, Personal Loan, Gold Loan, and Credit Card).
Market Cap = ₹ 45,284 Cr.
Current Price = ₹ 680
High / Low = ₹733 / 462
Stock P/E = 36.0
Book Value = ₹ 119
Dividend Yield = 0.07 %
ROCE = 7.19 %
ROE = 16.6 %
Face Value = ₹ 10.0
PROS
Company is expected to give good quarter
Company's median sales growth is 38.1% of last 10 years
CONS
Stock is trading at 5.71 times its book value
Company has low interest coverage ratio.
Promoter holding has decreased over last quarter: -2.63%
Company might be capitalizing the interest cost
Note : Good For Swing Trade

Mindtree LTD About
Mindtree is an international Information Technology consulting and implementation company that delivers business solutions through global software development.
Sector : IT - Software
Industry: Computers - Software - Large
Market Cap ₹ 51,070 Cr.
Current Price₹ 3,089
High / Low ₹ 5,060 / 2,649
Stock P/E 28.7
Book Value ₹ 349
Dividend Yield 1.20 %
ROCE 41.5 %
ROE 33.8 %
Face Value ₹ 10.0
PROS
Company is expected to give good quarter
Company has delivered good profit growth of 31.6% CAGR over last 5 years
Company has a good return on equity (ROE) track record: 3 Years ROE 28.6%
Company has been maintaining a healthy dividend payout of 32.6%
Company's median sales growth is 17.5% of last 10 years
CONS
Stock is trading at 8.85 times its book value

Asain Paint Ltd Technical AnalysisAbout
Set up in 1942, the Asian Paints group is the largest paint manufacturer in India also engaged in the business of manufacturing of varnishes, enamels or lacquers, surfacing preparation, organic composite solvents and thinners. It operates in 15 countries and has 26 paint manufacturing facilities in the world serving consumers in over 60 countries.
Besides Asian Paints, the group operates around the world through its various brands viz. Asian Paints Berger, Apco Coatings, SCIB Paints, Taubmans, Causeway Paints and Kadisco Asian Paints.
It also manufactures metal sanitary ware such as bath, sinks, washbasins and similar articles. Recently introduced Lightings, Furnishings and Furniture thus adding more products in the Home décor and Interior
PROS
Company is expected to give good quarter
Company has a good return on equity (ROE) track record: 3 Years ROE 25.8%
Company has been maintaining a healthy dividend payout of 52.6%
CONS
Stock is trading at 23.7 times its book value

Latent View Analytics Ltd Latent View Analytics Ltd provides analytics services such as data and analytics consulting, business analytics & insights, advanced predictive analytics, data engineering, and digital solutions. The company provides services to blue-chip companies in Technology, BFSI, CPG & Retail, Industrials, and other industry domain
PROS
Company has reduced debt.
Company is almost debt free.
CONS
Stock is trading at 7.45 times its book
Though the company is reporting repeated profits, it is not paying out dividend
Earnings include an other income of Rs.49.7 Cr
Note ;- Wait for entry Level

Laxmi Organic Industries Limited ABOUT
Laxmi Organic Industries Limited was established in 1989 and is in the business of specialty chemicals. The Company primarily manufactures Ethyl Acetate, Acetic Acid and Diketene Derivative Products (DDP). DDP is a specialty chemical group, the technology and business of which has been acquired by the company from Clariant Chemicals India Limited.
The company’s business operations are carried in over 30 countries including 11 offices located in India
PROS
Company is expected to give good quarter
Company has delivered good profit growth of 29.0% CAGR over last 5 years
CONS
Stock is trading at 7.82 times its book value
Promoter holding has decreased over last quarter: -0.39%

Nifty 50 Prediction for Tomorrow
Nifty 50 Prediction for Tomorrow
Buy at 17090 level Breaks
Target 17650 all most ( 86Point)
Sell at 17630
Target at 17520 ( 110 point)

HDFC BANK ( intraday)
HDFC BANK Tecnical Analysis For Intraday
HDFC Bank BOOM.......
All Target- Done

Tata Consumer Products (SwingTrade) About
Tata Consumer Products Ltd.
one of the leading companies of the Tata Group, with presence in the food and beverages business in India and internationally. It is the second largest tea company globally and has significant market presence and leadership in many markets. In addition to South Asia (mainly India), it has presence in various other geographies including Canada, UK, North America, Australia, Europe, Middle East and Africa.
Important point:-
---->Company is almost debt free.
---->Company has delivered good profit growth of 20.2% CAGR over last 5 years
---->Company has been maintaining a healthy dividend payout of 52.4%


Adani Port Special (15) Intraday Adani Port Special Intraday
Buy at - 840
Target- 850, 880
Stop Loss- 835

TATA STEEL ( Trade for Swing)
----------> Trade For Swing <-------------
* Trend line breakout
Entry----> 112-115
Target---> 139
StopLoss---> 100

SBILIFE#Watchlist
#SBILIFE (W):- CMP 1294 Looks Good above 1300 For More Upsides :)
Trading volume tends to drop off the longer congestion lasts. This is not always the case but is the general tendency. Volume tends to pick up when the congestion ends. The congestion is over when there is a breakout, typically on larger-than-recent volume, and the price moves outside the congestion range.
During a congestion period, the price will move between support and resistance. When the price breaks above resistance or below support, it indicates that the buyers or sellers have overpowered the other side, respectively.
Some investors will enter during congestion, assuming that the stock price will continue to rise after the congestion ends. This is more likely to be the case if the price was in an uptrend leading into the congestion period.
Other traders may wait for the price to break out of the congestion before entering a trade. For example, they may buy if the price moves out of the congestion price range on high volume.
#Disclaimer:- View shared is for educational purposes only. Conduct your due diligence before making any trading/investment decisions.

𝗡𝗜𝗙𝗧𝗬 𝟱𝟬 𝗙𝗢𝗥 𝗦𝗪𝗜𝗡𝗚 𝗧𝗥𝗔𝗗𝗘. NIFTY FOR SWING TRADING
NIFTY IS TRADING NEAR IT'S CRUSHIAL
LEVEL,
SELL NIFTY IF IT BREAKS THE CRUSHIAL SUPPORT LEVEL
AND BUY WHEN IT CROSSES THE 200 EMA BY BREAKING IT'S PREV 𝗛𝗜𝗚𝗛
ALL THESE LEVELS ARE MENTIONED ON CHART..
𝗗𝗜𝗦𝗖𝗟𝗔𝗜𝗠𝗘𝗥:-
THESE CONTAIN IS FOR EDUCATIONAL
PURPOSE,
TRADE ON YOUR ON 𝗥𝗜𝗦𝗞
• Trade On Side of Market And if you find that trend is weak then you can exit before target.
Wait For Retest Of Previous Day Close Or Nearest Support/Resistance In Case Of Big Gap Up Opening.
• Wait For Breakout Before Entering A Trade.
Levels Are Adjustable In Running Market
• Wait For 15Min Candle To Close.
• Wait for Your Levels Before Entering A trade.
• Do Your Own Study Before Taking Any Decision All These Charts Are For Learning Purpose.
DO YOUR OWN ANALYSIS BEFORE ENTERING THE TRADE...

𝗡𝗜𝗙𝗧𝗬 𝗙𝗢𝗥 𝗦𝗪𝗜𝗡𝗚 𝗧𝗥𝗔𝗗𝗜𝗡𝗚. 𝗡𝗜𝗙𝗧𝗬 𝗙𝗢𝗥 𝗦𝗪𝗜𝗡𝗚 𝗧𝗥𝗔𝗗𝗜𝗡𝗚
𝗡𝗜𝗙𝗧𝗬 𝗜𝗦 𝗧𝗥𝗔𝗗𝗜𝗡𝗚 𝗡𝗘𝗔𝗥 𝗜𝗧'𝗦 𝗖𝗥𝗨𝗦𝗛𝗜𝗔𝗟 𝗟𝗘𝗩𝗘𝗟,
𝗦𝗘𝗟𝗟 𝗡𝗜𝗙𝗧𝗬 𝗜𝗙 𝗜𝗧 𝗕𝗥𝗘𝗔𝗞𝗦 𝗧𝗛𝗘 𝗖𝗥𝗨𝗦𝗛𝗜𝗔𝗟 𝗦𝗨𝗣𝗣𝗢𝗥𝗧 𝗟𝗘𝗩𝗘𝗟
𝗔𝗡𝗗 𝗕𝗨𝗬 𝗪𝗛𝗘𝗡 𝗜𝗧 𝗖𝗥𝗢𝗦𝗦𝗘𝗦 𝗧𝗛𝗘 𝟮𝟬𝟬 𝗘𝗠𝗔 𝗕𝗬 𝗕𝗥𝗘𝗔𝗞𝗜𝗡𝗚 𝗜𝗧'𝗦 𝗣𝗥𝗘𝗩 𝗛𝗜𝗚𝗛
𝗔𝗟𝗟 𝗧𝗛𝗘𝗦𝗘 𝗟𝗘𝗩𝗘𝗟𝗦 𝗔𝗥𝗘 𝗠𝗘𝗡𝗧𝗜𝗢𝗡𝗘𝗗 𝗢𝗡 𝗖𝗛𝗔𝗥𝗧 ..
𝗗𝗜𝗦𝗖𝗟𝗔𝗜𝗠𝗘𝗥-
𝗧𝗛𝗘𝗦𝗘 𝗖𝗢𝗡𝗧𝗔𝗜𝗡 𝗜𝗦 𝗙𝗢𝗥 𝗘𝗗𝗨𝗖𝗔𝗧𝗜𝗢𝗡𝗔𝗟 𝗣𝗨𝗥𝗣𝗢𝗦𝗘,
𝗧𝗥𝗔𝗗𝗘 𝗢𝗡 𝗬𝗢𝗨𝗥 𝗢𝗡 𝗥𝗜𝗦𝗞..
• Trade On Side of Market And if you find that trend is weak then you can exit before target.
• Wait For Retest Of Previous Day Close Or Nearest Support/Resistance In Case Of Big Gap Up Opening.
• Wait For Breakout Before Entering A Trade.
• Levels Are Adjustable In Running Market
• Wait For 15Min Candle To Close.
• Wait for Your Levels Before Entering A trade.
• Do Your Own Study Before Taking Any Decision All These Charts Are For Learning Purpose.
𝗗𝗢 𝗬𝗢𝗨𝗥 𝗢𝗪𝗡 𝗔𝗡𝗔𝗟𝗬𝗦𝗜𝗦 𝗕𝗘𝗙𝗢𝗥𝗘 𝗘𝗡𝗧𝗘𝗥𝗜𝗡𝗚 𝗧𝗛𝗘 𝗧𝗥𝗔𝗗𝗘...
