Bank nifty viewBank nifty has been trading in a parallel channel.
Whole day the market was trading in a parallel channel just after a gap up and movement in initial 15 minutes.
Wait for the parallel channel to break.
Hope you see levels and trade with the break out.
Volatility

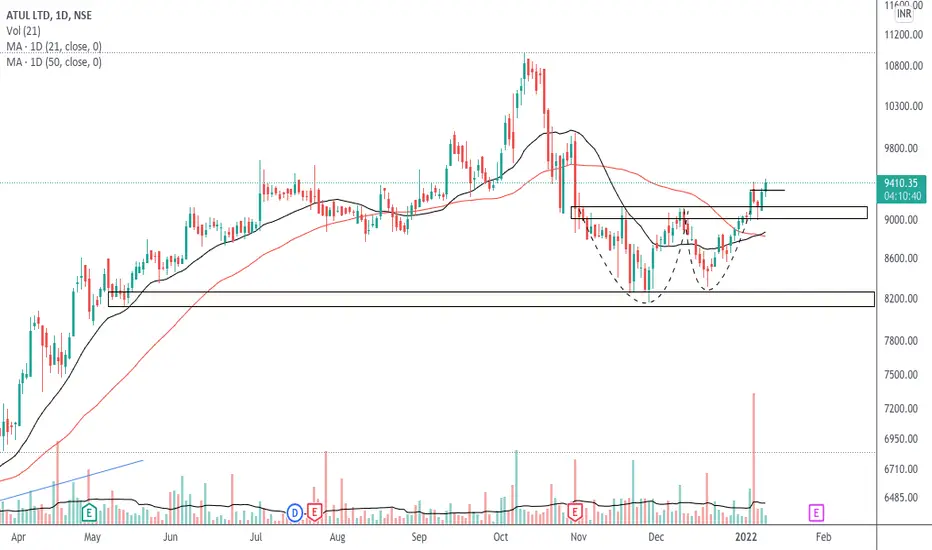
A falling wedge breakouthey traders,
So today i am seeing a falling wedge breakout which is a bullish sign one can take a trade at current levels or after retesting the breakout 2H/4H chart ADX and RSI are showing strength
RED lines are target or as per risk apetite and yellow line is for stoploss
Hold for some day LIC IPO can trigger for further upside
And before entry do your own analysis before jumping

GOLD: Volatility Contraction PatternGOLD: Volatility Contraction Pattern.
Looks good one break the resistance level.

Volatility Contraction Pattern(VCP)Volatility Contraction Pattern(VCP), upmove intact, 600 looks like a resistance.

Consolidation in correction, higher high formationConsolidation in correction, higher high formation,
ATH first target, supporting volume

RAMKY showing potential VCP characteristicsRAMKY providing potential VCP setup with proper tight buy point.

IGLWait And Watch ??
Look for Low risk, High reward, and High Probability setups-
Things to Remember while Trading with the Trend
1. Know what the trend is.
2. The best trades are made in the direction of the trend.
3. Assume that the main trendline or moving average will hold.
4. The longer the moving average is, the better it defines the trend.
5. Wait for the pullback.
6. Don’t chase the market.
7. Don’t fight the market.
8. Even in the strongest trends there should be some retracement.
9. The closer the market is to the trendline, the better the risk/reward ratio is.
10. Use ADX to determine the strength of the trend.
11. Higher the level of ADX , the stronger the trend, below 20 consider the market to be choppy
12. Hold trades longer in a strong trend.
13. Wait for confirmation of a trendline breaking before reversing position.
14. Know where the Support levels are.
15. Place stops outside the Support levels.
Thank You..

HAPPIEST MINDS TECHNOLOGIESHappiest Minds Technologies, THE MID CAP IT GIANT which a leading digital transformation technology provider is finally out from the trade to trade segment, the stock has seen a reasonable correction from its highs with improving fundamentals.the volumes are squeezed shows the TTM SQUEEZE ,the stock has formed a triple bottom like structure which is a bullish setup, previous times the stock was reversing from 1350 round levels but this time it has formed a swing near the supply zone which adds a feather to our chart and the swing low would be an ideal SL for the positional traders ,the only wait is for the volumes to return ,once the volumes return the stock can see a 90 degree momentum and the targets could be the ATH

HBLPOWER providing proper buy point with VCP characteristicsHBLPOWER has formed a nice base with VCP characteristics .It has shown good Relative Strength when market was correcting. It is providing very tight pivot with reducing volume. Entry can be made above horizontally drawn pivot with initial SL at 60 Levels

Consolidation in Uptrend, Can touch ATHVCP pattern, Possible breakout to ATH and beyond
respecting 200 and 50 DMA

Volatility Contraction PatternStrong uptrend followed by long consolidation with volatility contraction on low volumes
Respecting 50 DMA

HEROMOTOCO : RSI Divergence ViewHeromotors: Multiple times RSI divergence helps to reverse the trend. Is the same can repeat ?

Matic Long TargetIf Matic crosses the white line then you can have a long position and the target will be the yellow circle.

Divergence in RSIThere was an RSI Divergence in BTC in 1hr timeframe. There's an chance for it correct a bit.

HDFCWait And Watch ??
Look for Low risk, High reward, and High Probability setups-
Things to Remember while Trading with the Trend
1. Know what the trend is.
2. The best trades are made in the direction of the trend.
3. Assume that the main trendline or moving average will hold.
4. The longer the moving average is, the better it defines the trend.
5. Wait for the pullback.
6. Don’t chase the market.
7. Don’t fight the market.
8. Even in the strongest trends there should be some retracement.
9. The closer the market is to the trendline, the better the risk/reward ratio is.
10. Use ADX to determine the strength of the trend.
11. Higher the level of ADX , the stronger the trend, below 20 consider the market to be choppy
12. Hold trades longer in a strong trend.
13. Wait for confirmation of a trendline breaking before reversing position.
14. Know where the Support levels are.
15. Place stops outside the Support levels.
Thank You..

Ami Organics Volatility Contraction Swing TradeAmi organics has been consolidating after an upswing with volatility Contraction. Looks good for a swing trade.

CONTRARIAN trade setup.#Here on the daily chart of UPL, the trend is down since the month of june and now the trend is showing some signs of reversals. A divergence can be shown between Price and RSI, price is making lower lows but RSI is continously making higher lows.
#When we put a bollinger band over the price chart, we can see a "W" bottom pattern has formed on the same lows. 1st low broke the lower bollinger band shows momentum on down side then the price bounces back and forms another low but this time fails to break the lower band and stays inside which shows loss of momentum towards down side.
#When we see the RSI indicator, the value is about to cross 60, if it closes above it we can see an uptrend from here.
#On Balance Volume has also broken the trend line which shows that buyers are showing interest.
*For a safe entry wait for the price to give a breakout above (768) the resistance or above upper bollinger band.
*Stop Loss can be the previous low i.e. 694 or the lower bollinger band.
*First target = 865

Bullish view on IRCTCThe monopoly scrip is at the stage of breakout from a triangle pattern and also there's a volatility compression. I'm bullish on this scrip for both short term as well as lomg term. There's a stock split on 28th of Oct, try to hold it till record date as many new investors might invest in it for its lower cost which may further take this scrip up.

Shiba Inu Coin 1 dollar plan! #$1So, simple rule of Shiba Inu reaching our one cent is: that three different scenario so increasing in the shiba inu price will increase the market cap for the shiba inu. The other scenario is going down on the total supply. So, based on these two different kind of aspects i’m going to present four different kind of scenarios. It’s hard to say when will Shiba inu will reach 1 cent but we will find out how can shiba you can reach 1 cent if it will ever reach $0.001 cent.
Current context: overview
Right now (at the time of this video and post) we have this data from Shiba inu:
Shiba Inu price today: $0.000007168
Shiba Inu current market cap: $2829711505
Total supply : 394796000000000 shib
We have a shiba inu this is the market caps and total supply, which give us the current price based on this market cap divided by total supply. So, this is the current situation right now : current shiba inu price = market cap divided / total supply. which is zero point five zeros and seven one six eight if you remove the last few digits it’s the same so let’s start with the base this is the base price i’m going to rely on if the data changes the time when you are reading this post or watching the video you should update the similar data based on the market value.
First scenario : with same number of coins supply
So, with that let’s find out with the current situation without decreasing the total supply of the shiba inu token coin if shiba inu token coin has to reach the 1 cent the market cap of the shiba inu has to increase by 1400 times. If shiba inu coin has to reach one cent based on the current market supply, it has to raise almost 4 trillion of the market cap value. Current market of bitcoin is 613 billion, so it has to go more than six times then the current bitcoin value is. So this is just a calculation based on the information we have around and this is kind of hypothetically it is almost impossible i would say but maybe i’m wrong let’s see we don’t know about cryptocurrency.
Second scenario: burning shina inu coin
Scenario number two, coin burning by the way there is no such a things written in this shiba inu by far they are going to burn the coin. In some sense maybe they will never but the market trend and strategy changes depend on the the market. So, i would say let’s assume they will be burning some coin in a day to come if shiba inu have to burn the coin to reach 0.01. Let’s assume they have the same market cap as a right now so if shiba inu burn down the 99 percent of their current supply the the total supply will come down to almost 4 trillion and the current uh the then the price impact would go at least to $0.0007 which is not even close to the one cent this is like $0.001 one let’s assume the coin burning is not going to help shiba inu price.
Third scenario: realistically how high can shiba inu coin reach
In this scenario, i’m thinking about when shiba inu launch their shibaswap, they will have something about transition going on and the coin will be burning about. So, they must have come up with some idea about; how to burn the coin. And swap is the one of the best things to burn the coin while doing this transaction and receiving the benefit about so actually no one is really going to lose. But the transaction or everything happened on the decentralized zone can be burn so this could be a easy solution for the shiba inu to implement as well. if shibaswap and shiba inu team decide to burn 66.66 percent of shiba inu token coin they will have a 131 trillion approximately token coin as a new supply. If you see the current market cap of the dogecoin, if in a hypothetical way if and when shiba inu team and the shibaswap decided to burn the coin and when the market is really popular we expect as a regular way that market cap will be increased but in this hypothetical scenario i am putting the market cap to increase four times of the current dogecoin. Which is in some sense i would say maybe it’s a possible it’s not a big ask! So this is like a balance of the burning the more than half of the coin and the same time the market cap is increasing because this lead to the increase in the price when the total supply is down. The price is increases so this is why the also there is a chances that market cap will be increased also so this is my hypothetical uh thinking and if this one lead to the then we’ll have a $0.001. this is how high shiba inu coin can reach and what shiba inu reach. Shiba inu value so by far this is i think is the best possible scenario that we are talking about zero point zero zero one shiba inu. I am not sure how long it will take shiba coin to reach this value because all these are depend on the shiba token team to decide when and how they will burn this coin and what are the other things they will take into consideration while leading into the market.
Fourth scenario: out of the box – Shiba inu to 1 cent
So, let’s talk about something different now: this is the most fun part there are thousands of videos on the internet or youtube these days. Everyone is talking about oh shiba inu going to the one cent shiba inu to one dollar and all these things. I don’t know what should i call them, if they have ever looked about this how many current supply of shiba inu we have and what exactly the effort will take to raise this shiba inu token coin to one cent. I am a shib holder, so of course i would also want the market cap or shiba inu to reach to the one cent but while making the video we also have to think about the the fact and putting put them into the account. So, this is why i’m i titled this one about let’s think out of the box. shiba inu to 1 cent so please don’t judge me for writing this one. This is a very very hypothetical thought. So, if a new token coin has to reach 0.01 cents then we have to think out of the box.
Let’s show it: So i come up with the best possible way that shiba token team has to burn at least of 89 percent of their current total supply because they are literally a too many token coin of the shiba inu so this is a value of the total supply the total supplies this is the total supply of the current value and if we burned 89 of the total supply we will have approximately we’ll have a 43 billions of shiba inu token coin on the total supply if we burn down the 89 percent of token by either using the shibaswap or the team decide to burn in a different way so burning is there is not even an option right now but for just for the video sake i’m thinking about how and when which scenario can shiba inu can reach to the 0.01 cent. So, the first option is to burning the 89 persons of the token coin and if shiba inu has to reach the 0.01 cent take into account it has to increase 11 times more than the current dogecoin market cap so we take into consideration this is the market cap and we have the total supply which give us the shiba inu price to 0.01 cent.

Coforge-Swing tradeSwing trade for Coforge for a short term return expectancy i.e. 4-5% return on capital. Buy @5250-5300, Stoploss-5000 , Quantity-15

BankNifty Cmp 37812 dated 17.9.2021BankNifty Cmp 37812 dated 17.9.2021
Resistance @ 37800
Support @ 36800
Buy above 37850 for a tgt of 38500-39700
40500 SL 37000
Sell below 36700 tgt 36200-35500-34800
SL 37300
It is just a view, pls trade at your own risk.

Key level to watch out in L&TIt is a large cap scrip, it is in an uptrend for a long time and now it is near to the multiyear resistance. There can be a huge up move in this scrip if if breaks that resistance, so do watch out for this level and set an alert on it. Don't short this scrip until it breaks the support zone and better to short after the pullback. Point to be noted is that the volume are contracting with the rise in price which signals a trend reversal.
Don't speculate, act according to the price action.
