POLICYBZR - STWP Equity Snapshot📊 STWP Equity Snapshot – PB Fintech Ltd (POLICYBZR)
(Educational | Chart-Based Interpretation)
POLICYBZR continues to trade within a well-defined range structure, with repeated rejection from the 1960–2000 supply / distribution zone and consistent buyer activity emerging near the 1650–1609 demand / value zone. The stock has once again reverted from upper supply and is currently attempting a recovery from this demand region. The area around 1720–1740 now acts as a near-term balance zone. Holding above this region keeps the recovery attempt structurally valid and allows price to test higher reaction zones near 1755 and 1790, where selling pressure has appeared previously. However, sustained acceptance above these levels would be required to improve directional confidence. On the downside, continued weakness below 1650, and especially below 1609, would signal structural weakness and increase the probability of deeper mean reversion within the range. Until either boundary is resolved, price action should be viewed as rotation rather than trend development.
Recent market conditions reflect a neutral but stabilising environment. The recent strong bullish candle highlights buyer response from demand, but not trend confirmation. Bollinger Band behaviour shows that price is emerging from a compressed phase, with early expansion attempts visible, though follow-through remains limited. The BB squeeze context indicates potential for movement, but direction remains undecided. RSI near 45–46 reflects balanced momentum, consistent with a range-bound market rather than a trending phase. Price interaction with short-term averages suggests short-term stabilisation, while the wide CPR structure reinforces expectations of two-sided activity, consolidation, and rotational price behaviour instead of immediate directional continuation.
Volume analysis adds important context to the recovery attempt. Participation has improved during the recent bounce from demand, indicating active buyer involvement rather than a low-liquidity reaction. At the same time, volume intensity remains moderate (Vol X near 1.0), with no signs of climax or exhaustion. Selling phases have not been accompanied by aggressive volume expansion, suggesting controlled supply rather than panic distribution. Overall, volume behaviour supports range stability and validates the demand-side response, while still falling short of confirming accumulation or breakout intent.
From a short swing perspective, POLICYBZR remains structurally neutral as long as price trades between the 1650–1609 demand zone and the 1960–2000 supply zone. Acceptance above intermediate resistance would be required to shift bias toward higher range expansion. Conversely, sustained acceptance below 1609 would elevate downside risk and suggest continuation of mean reversion toward lower structural levels. Until such confirmation occurs, consolidation and rotational movement within the range should be expected.
Final Outlook (Condition-Based):
Momentum is improving but not decisive, the trend remains range-bound, risk is elevated due to overhead supply, and volume is supportive but non-confirmatory.
💡 STWP Learning Note
In range markets, demand reactions show interest — only acceptance above supply confirms intent.
⚠️ Disclaimer
This post is shared strictly for educational and informational purposes. It is not investment advice or a recommendation. Please consult a SEBI-registered financial advisor before making any financial decision.
🚀 Stay Calm. Stay Clean. Trade With Patience.
Volumeanalysis

ASTRAL - STWP Equity Snapshot📊 STWP Equity Snapshot – Astral Ltd (ASTRAL)
(Educational | Chart-Based Interpretation)
ASTRAL continues to trade within a broader range-bound structure, with price oscillating between well-defined supply and demand zones rather than establishing a sustained trend. After facing rejection near the 1593–1600 supply zone, price moved into a corrective phase and recently reacted from the 1333–1293 demand region, where buyers have previously stepped in. The current price is stabilising near the 1424 balance area, which now acts as an important near-term reference. Holding above this zone keeps the structure intact and allows price to retest higher reaction zones near 1441–1470, where selling pressure has emerged earlier. On the downside, sustained weakness below 1367, and more importantly below the 1333 demand zone, would increase downside risk and reinforce the broader range structure. Until price decisively exits either boundary, movement should be viewed as rotation within the range rather than trend development.
Indicator readings reflect a mixed but stabilising environment. The recent strong bullish candle with open near the low signals short-term buyer response from demand rather than trend confirmation. Bollinger Band behaviour highlights prior volatility contraction, with early signs of expansion emerging, though follow-through remains limited. The BB squeeze context suggests the market is transitioning from compression toward potential movement, but direction is still undecided. RSI near 47 indicates balanced momentum, neither weak nor strong, aligning with the ongoing range structure. Price interaction with short-term averages shows attempts at stabilisation, while a wide CPR structure reinforces the expectation of two-sided trade and consolidation rather than immediate directional continuation.
Volume behaviour provides constructive but cautious confirmation. Participation has expanded during the recent rebound, indicating active involvement from buyers near demand rather than a low-volume reaction. At the same time, volume intensity remains within a healthy range (Vol X ~1.4–1.5), with no signs of climax or exhaustion. Selling phases have not shown aggressive volume expansion, suggesting supply pressure is controlled. Overall, volume dynamics support range stability and recovery attempts but stop short of confirming accumulation or breakout intent.
From a short swing perspective, ASTRAL remains structurally neutral as long as price trades between the 1333–1293 demand zone and the 1593–1600 supply zone. Acceptance above intermediate resistance levels would be required to improve directional confidence toward higher range-expansion zones. Conversely, sustained acceptance below 1293 would elevate downside risk and shift focus toward deeper structural demand. Until either boundary is resolved, consolidation and rotation within the range should be expected.
Final Outlook (Condition-Based):
Momentum is improving but not decisive, the trend remains range-bound, risk stays elevated due to proximity to both demand and supply, and volume is supportive but not confirming a directional shift.
💡 STWP Learning Note
Range markets reward patience and structure awareness more than prediction.
⚠️ Disclaimer
This post is shared strictly for educational and informational purposes. It is not investment advice or a recommendation. Please consult a SEBI-registered financial advisor before making any financial decision.
🚀 Stay Calm. Stay Clean. Trade With Patience.

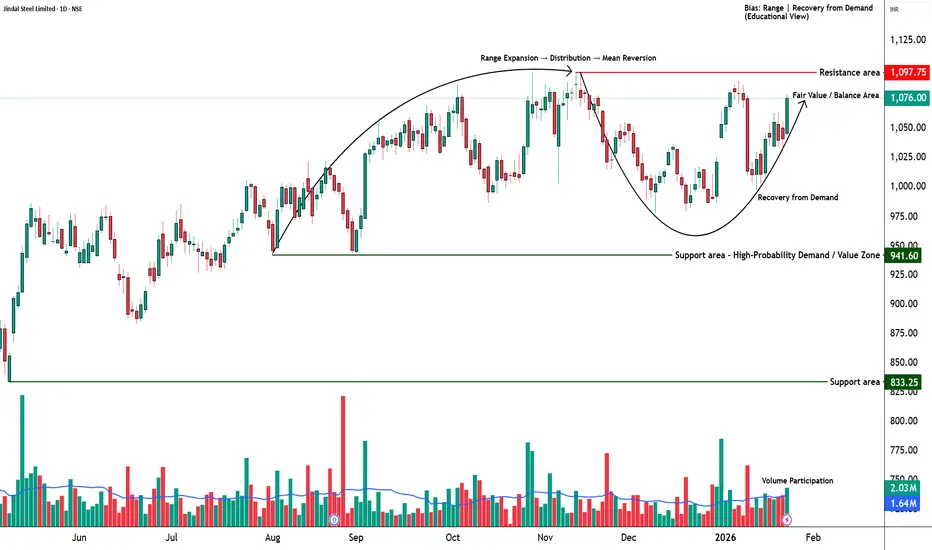
JINDALSTEL - STWP Equity Snapshot📊 STWP Equity Snapshot – Jindal Steel Ltd (JINDALSTEL)
(Educational | Chart-Based Interpretation)
JINDALSTEL is trading within a broader upward structure while navigating a short-term recovery from a recent corrective phase. Price has rebounded strongly from the 1031–1019 demand zone, an area that has historically attracted buyers and acted as structural support. The current price is stabilising near the 1079 balance area, which now serves as a key near-term reference for structure. Holding above this zone keeps the short-term structure constructive and allows price to test higher reaction zones near 1089–1101, where prior supply has emerged. Acceptance above these zones would be required to improve directional confidence. On the downside, any sustained weakness below 1053 initially, and more importantly below 1031, would increase downside risk toward deeper demand and signal a return to range-bound or corrective behaviour. As long as price remains above the primary demand zone, the broader uptrend framework remains intact.
Indicator readings from the green dashboard support a developing bullish structure but with conditions. The presence of a strong bullish candle reflects renewed buyer initiative after consolidation, while Bollinger Band behaviour highlights a prior compression phase now transitioning into early expansion. The BB squeeze context increases the relevance of the current move, suggesting improving volatility conditions rather than a late-stage rally. RSI near 60 indicates strengthening internal momentum without entering stretched or overbought territory, supporting continuation potential while keeping exhaustion risk contained. Price holding above short-term trend measures and VWAP reinforces near-term stability. However, interaction with a wide projected CPR structure suggests that the market environment still favours balance and consolidation, meaning follow-through and acceptance matter more than single-session strength.
Volume behaviour adds an important layer of confirmation. Participation has expanded during bullish candles, indicating active buyer involvement rather than a low-liquidity bounce. Volume intensity remains around healthy levels (Vol X ~1.3), showing interest without signs of climax or emotional excess. Recent pullbacks have not been accompanied by aggressive selling volume, suggesting that supply is being absorbed rather than distributed. Overall, volume dynamics support a controlled recovery and align with accumulation-type behaviour rather than exhaustion.
From a short swing perspective, JINDALSTEL maintains a constructive bias as long as price holds above the 1031–1019 demand zone. If acceptance improves above nearby supply, higher range-expansion reference zones around 1192–1278 come into focus over the coming sessions. Conversely, sustained acceptance below 1019 would elevate downside risk and indicate a shift from recovery into a deeper corrective or range phase. Until such a failure occurs, consolidation above demand should be viewed as structural digestion rather than weakness.
Final Outlook (Condition-Based):
Momentum is strong and improving, the broader trend remains upward, risk stays elevated due to nearby supply and a wide CPR environment, and volume remains supportive but requires continued follow-through.
💡 STWP Learning Note
Strong candles initiate moves; structure and acceptance decide sustainability.
⚠️ Disclaimer
This post is shared strictly for educational and informational purposes. It is not investment advice or a recommendation. Please consult a SEBI-registered financial advisor before making any financial decision.
🚀 Stay Calm. Stay Clean. Trade With Patience.
COLPAL - STWP Equity Snapshot📊 STWP Equity Snapshot – Colgate-Palmolive (India) Ltd (COLPAL)
(Educational | Chart-Based Interpretation)
COLPAL has transitioned from a corrective phase into a demand-led recovery, with price reacting decisively from the 2097–2074 demand zone. This zone has historically attracted buyers, and the recent rebound reflects active absorption of selling pressure rather than a passive bounce. Price is now stabilising around the 2184 balance area, which acts as an important near-term reference. Sustained holding above this zone keeps the short-term structure stable and allows price to test higher reaction zones between 2288 and 2358, where acceptance will determine continuation quality. On the downside, any weakness below 2184 increases risk toward 2138 initially, followed by a deeper retest of the 2097–2074 primary demand zone, where the broader structure would be reassessed. As long as price remains above this demand band, the larger trend framework stays constructive.
Indicator readings from the dashboard support this developing structure. The presence of a strong bullish candle emerging after a period of consolidation indicates renewed buyer initiative. Bollinger Band behaviour shows prior volatility compression, with early signs of expansion now appearing, suggesting a shift from balance toward directional intent rather than a late-stage move. The BB squeeze context increases the relevance of the current expansion attempt, while RSI near the bullish mid-zone (~60) reflects improving internal strength without signs of exhaustion. Price holding above short-term trend measures reinforces near-term stability. At the same time, interaction with a wide CPR structure suggests that the market remains in a balanced environment, where consolidation, pauses, or controlled pullbacks toward value zones are more likely than immediate acceleration. Acceptance and follow-through remain more important than candle size alone.
Volume behaviour adds important confirmation to the price structure. Participation has expanded during bullish candles, indicating genuine buyer involvement rather than a low-liquidity reaction. Volume intensity remains within a healthy range, with no signs of climax or exhaustion typically associated with late-stage moves. Pullbacks have occurred on relatively lighter volume, suggesting that selling pressure is being absorbed rather than aggressively expanding. Overall, volume dynamics align with a controlled recovery and support the view that the move is being built through participation rather than emotion.
From a short swing perspective, COLPAL maintains a positive structural bias as long as price holds above the 2097–2074 demand zone. If acceptance improves and momentum sustains, higher range-expansion reference zones between 2388 and 2541 come into focus over the coming sessions. Conversely, sustained acceptance below 2074 would elevate downside risk and indicate a transition from recovery into a deeper corrective phase. Until such failure occurs, consolidation above demand should be viewed as healthy digestion of gains rather than structural weakness.
Final Outlook (Condition-Based):
Momentum is moderate and improving, the broader trend remains upward, risk stays elevated due to the recovery nature of the move and nearby supply, and volume remains supportive but requires continued follow-through.
💡 STWP Learning Note
Strong recovery candles show intent — confirmation comes only with acceptance above supply.
⚠️ Disclaimer
This post is shared strictly for educational and informational purposes. It is not investment advice or a recommendation. Please consult a SEBI-registered financial advisor before making any financial decision.
🚀 Stay Calm. Stay Clean. Trade With Patience.

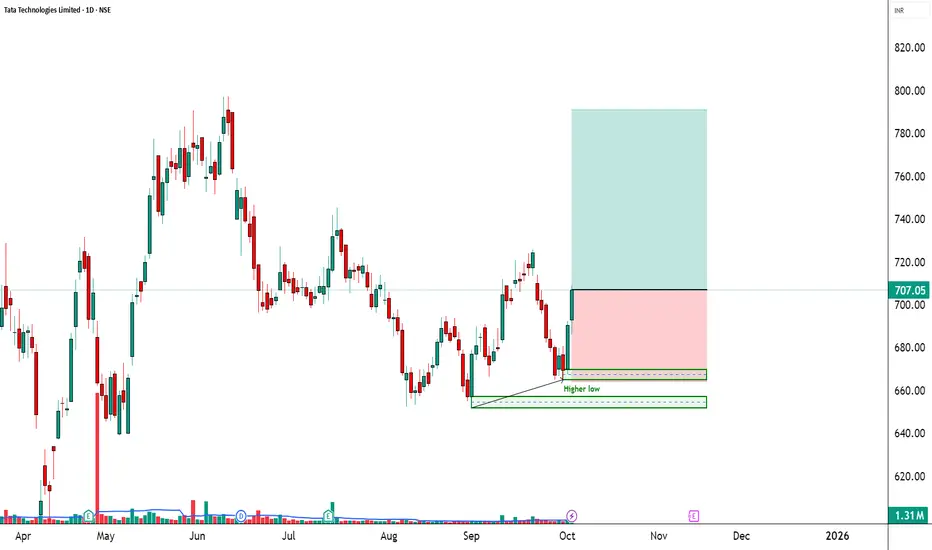
Tata Technologies | EMA50 Breakout + RSI Momentum________________________________________
🚀 Tata Technologies | EMA50 Breakout + RSI Momentum
🔹 Entry Zone: ₹707.05
🔹 Stop Loss: ₹664.20 – ₹664.25 (Risk ~42 pts)
🔹 Supports: 692.47 / 677.88 / 669.62
🔹 Resistances: 715.32 / 723.58 / 738.17
________________________________________
🔑 Key Highlights
✅ Volume Breakout → 1.31M vs avg 1.08M (Smart buying visible)
✅ EMA50 Breakout → trend shift signal
✅ RSI Breakout → momentum favoring bulls
✅ Bollinger Squeeze-Off → volatility expansion expected
________________________________________
🎯 STWP Trade View
📊 Structure shows bullish momentum building. If ₹715.32 is crossed, upside can stretch towards ₹723–738.
⚠️ Supports at ₹692 & ₹678 are crucial for maintaining this momentum.
________________________________________
💡 Learning Note
This setup is a classic example where EMA + RSI + Volume breakout alignment confirms the probability of a short-term bullish rally.
________________________________________
⚠️ Disclosure & Disclaimer – Please Read Carefully
The information shared here is meant purely for learning and awareness. It is not a buy or sell recommendation and should not be taken as investment advice. I am not a SEBI-registered investment adviser, and all views expressed are based on personal study, chart patterns, and publicly available market data.
Trading—whether in stocks or options—carries risk. Markets can move unexpectedly, and losses can sometimes exceed the money you have invested. Past performance or past setups do not guarantee future results.
If you are a beginner, treat this as a guide to understand how the market works and practice on paper trades before risking real money. If you are experienced, always assess your own risk, position sizing, and strategy suitability before entering trades.
Consult a SEBI-registered financial adviser before making any real trading decision. By engaging with this content, you acknowledge full responsibility for your trades and investments.
💬 Found this useful?
🔼 Give this post a Boost to help more traders discover clean, structured learning.
✍️ Drop your thoughts, questions, or setups in the comments — let’s grow together!
🔁 Share with fellow traders and beginners to spread awareness.
👉 “If you liked this breakdown, follow for more clean, structured setups with discipline at the core.”
🚀 Stay Calm. Stay Clean. Trade With Patience.
Trade Smart | Learn Zones | Be Self-Reliant 📊
M&M FIN SAILING IN BLUE SKY ZONEBUY M&M FINANCE 355 for 380 to 410 levels.
Technical breakout to all time high zones with volumes.
View invalid if falls below 325 on weekly closing.

NSDL cmp 1081.40 by Daily Chart viewNSDL cmp 1081.40 by Daily Chart view
- Support Zone 1040 to 1085 Price Band
- Resistance Zone 1135 to 1185 Price Band
- Bullish Triple Bottom at 1037 to 1049 Price Band
- Volumes flattish and under average traded quantity
- Price trending within Support Zone thru December 2025
- Falling Resistance Trendline Breakout seems taking process

HEROMOTOCO - Rejection From Strong Resistance, Momentum Cooling💹 Hero MotoCorp Ltd (NSE: HEROMOTOCO)
Sector: Automobiles | CMP: 5817
View: Bearish — Rejection From Strong Resistance, Momentum Cooling
HEROMOTOCO has recently faced a sharp rejection from its upper resistance zone near the 6100–6200 region after a strong prior rally, indicating supply emergence at higher levels rather than healthy consolidation. The subsequent decline has been decisive, with price slipping back below key short-term levels, suggesting that the recent upswing may have been a momentum-driven leg rather than the start of a sustained trend. Current price behaviour reflects a cooling phase following distribution near the highs.
From a structural perspective, the stock remains within a broader developing framework, but near-term momentum has weakened. RSI around 42.6 sits in a neutral-to-healthy zone, indicating that the stock is neither oversold nor displaying reversal exhaustion. Stochastic has cooled from elevated levels, while MACD signals point to loss of bullish momentum rather than aggressive bearish acceleration. ADX suggests the trend is still developing, though recent behaviour highlights a transition from expansion to consolidation or pullback.
Volume participation remains moderate (Vol-X ~0.83), confirming that the recent decline is orderly and controlled, not panic-driven. This reduces the probability of sharp capitulation but keeps downside risk open as long as price fails to reclaim overhead supply. The current structure favours patience, with markets reassessing value after a strong prior move.
Key price references show strong overhead resistance clustered near 5931–6045 and further up around 6120, while immediate structural supports are placed near 5742, followed by 5668 and 5553, defining the current risk-reward envelope. Sustained acceptance above the resistance band would be required to restore bullish confidence, while continued trade below this zone keeps the bias tilted to the downside or range-bound with elevated volatility.
On the derivatives side, near-ATM CALLs and PUTs are referenced strictly for analytical insight into positioning behaviour. CALL-side data shows rising open interest with moderate volume expansion, indicating short build-up rather than directional strength, while PUT-side activity reflects short-covering-led participation, suggesting defensive repositioning rather than fresh aggressive bearish bets. Implied volatility remains in a relatively low-to-moderate band, pointing to measured risk pricing rather than fear-driven expansion. Overall, derivatives behaviour aligns with a cooling, non-trending phase, where conviction remains mixed and momentum-dependent.
Structure quality metrics reflect this balance. The STWP Edge Score in the moderate range highlights tradability but not high-conviction trend alignment. Liquidity remains concentrated near ATM strikes, supporting participation, but directional option structures remain sensitive to time decay and price stalling, reinforcing the importance of confirmation through price acceptance or rejection at key levels.
Overall, HEROMOTOCO is currently in a post-rally digestion phase, with bearish pressure emerging near resistance and momentum moderating. While deeper downside is possible if supports fail, the absence of capitulation volume suggests that the stock may oscillate within a defined range unless fresh directional conviction develops.
Final Outlook (Educational Snapshot):
Momentum: Neutral| Trend: Developing / Cooling | Risk: Low | Volume: Normal
⚠️ STWP Legal Disclaimer
This document is strictly for educational and informational purposes. All examples, charts, levels, and option structures discussed are illustrative and are not intended as buy, sell, or hold recommendations. STWP does not provide investment advice, trading tips, signals, or personalized financial guidance of any kind, nor is it a SEBI-registered intermediary or research analyst. The analyses, illustrations, and risk–reward structures included here are generic in nature and based on publicly available data and observed market behaviour, which may change without notice. Financial markets involve significant risk; derivatives in particular carry the potential for substantial losses. Option premiums, implied volatility, open interest, delta, and other market variables can fluctuate rapidly and unpredictably.
Readers are solely responsible for their trading decisions, capital management, and risk assessment. Before making any investment or trading decision, please consult a SEBI-registered investment advisor. STWP, its representatives, and affiliates shall not be liable for any direct or indirect loss arising from the use of this material. Historical patterns or past market behaviour do not guarantee future outcomes, nor should any part of this document be interpreted as a promise of performance, accuracy, or returns.
Position Status: No active position in this instrument at the time of analysis.
Data Source: TradingView & NSE India.
💬 Found this useful?
🔼 Boost this post to support structured learning
✍️ Share your thoughts or questions in the comments
🔁 Forward this to traders who value clean technical studies
👉 Follow for disciplined, structured, STWP-style analysis
🚀 Stay Calm. Stay Clean. Trade With Patience.
Trade Smart | Learn Zones | Be Self-Reliant 📊

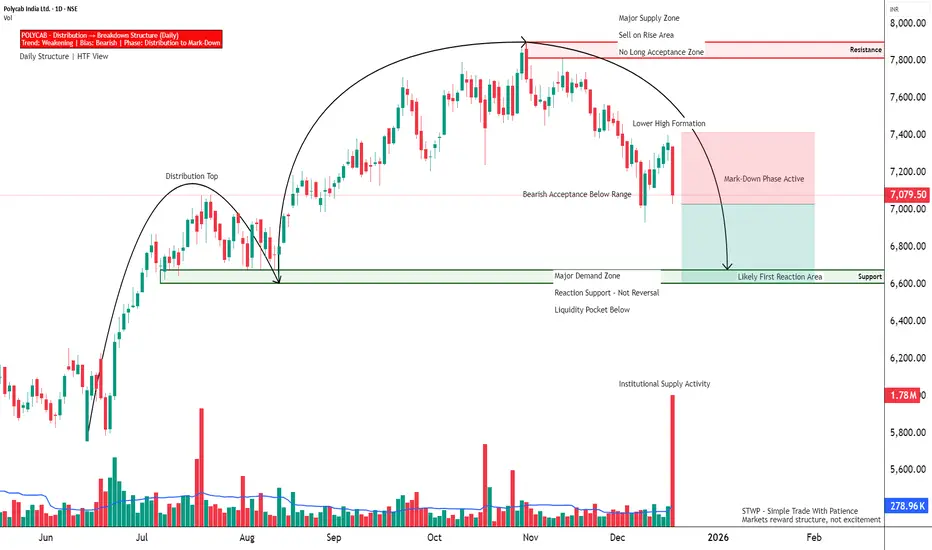
POLYCAB - Breakdown From Distribution Range💹 Polycab India Ltd (NSE: POLYCAB)
Sector: Electricals / Cables | CMP: 7079.5
View: Bearish — Breakdown From Distribution Range
POLYCAB has decisively slipped below its short-term consolidation zone, following a failed attempt to sustain above the 7600–7800 supply region. The rejection from this upper band was sharp and volume-backed, confirming distribution at higher levels rather than healthy consolidation. Recent candles show downside continuation with expanding volatility, keeping the immediate bias tilted to the downside.
Structurally, the stock has transitioned from an uptrend into a lower-high formation, with price now trading below key short-term averages. RSI around 38 reflects weak but not oversold momentum, indicating that downside pressure still has room to play out. MACD remains in bearish territory, while ADX suggests the trend is developing rather than exhausted. This combination favours continuation moves over mean-reversion bounces.
Volume behaviour is a key tell. The recent sell-off has come with very high participation (Vol-X ~9+), signalling active institutional repositioning rather than retail-driven noise. Importantly, selling has not yet shown capitulation characteristics, implying that weakness may persist until a stronger demand pocket is tested.
Key Support & Resistance Zones (Chart-Based)
Resistance Zones:
• 7270 (near-term supply / pullback cap)
• 7460.5 (intermediate resistance)
• 7580 (major overhead resistance, prior distribution zone)
• 7800–7900 (weak but broad HTF supply band)
Support Zones:
• 6960 (Support 1 – immediate reaction level)
• 6840.5 (Support 2 – intermediate demand)
• 6650 (Support 3 – major structural demand zone)
The 6960 level may offer a temporary pause or short-lived bounce, but it is not a trend-defining support. A sustained break below this zone increases downside probability toward 6840.5 and 6650, where stronger demand is likely to emerge. Any pullback toward 7270–7460 is expected to face supply unless accompanied by clear volume contraction and structural improvement.
From a broader risk perspective, POLYCAB is now in a sell-on-rise environment, with trend strength favouring bears and volatility elevated. Long exposure remains high-risk until price reclaims and sustains above the lower resistance band with improving momentum metrics.
Options activity shows increasing alignment with the mark-down structure. Near-ATM PUTs are referenced purely for positioning insight, with balanced-to-negative delta indicating sensitivity to further downside. Rising open interest alongside strong volume points to fresh bearish participation rather than short-covering, while implied volatility remains in a controlled mid-range, suggesting measured risk pricing.
Derivatives participation broadly confirms the cash-market breakdown, with liquidity concentrated near ATM levels and behaviour consistent with informed repositioning. Directional structures remain sensitive to time decay and consolidation, making continued downside acceptance and momentum follow-through essential for validation.
Final Outlook (Educational Snapshot):
Momentum: Weak | Trend: Developing| Risk: High | Volume: Very High
⚠️ STWP Legal Disclaimer
This document is strictly for educational and informational purposes. All examples, charts, levels, and option structures discussed are illustrative and are not intended as buy, sell, or hold recommendations. STWP does not provide investment advice, trading tips, signals, or personalized financial guidance of any kind, nor is it a SEBI-registered intermediary or research analyst. The analyses, illustrations, and risk–reward structures included here are generic in nature and based on publicly available data and observed market behaviour, which may change without notice. Financial markets involve significant risk; derivatives in particular carry the potential for substantial losses. Option premiums, implied volatility, open interest, delta, and other market variables can fluctuate rapidly and unpredictably.
Readers are solely responsible for their trading decisions, capital management, and risk assessment. Before making any investment or trading decision, please consult a SEBI-registered investment advisor. STWP, its representatives, and affiliates shall not be liable for any direct or indirect loss arising from the use of this material. Historical patterns or past market behaviour do not guarantee future outcomes, nor should any part of this document be interpreted as a promise of performance, accuracy, or returns.
Position Status: No active position in this instrument at the time of analysis.
Data Source: TradingView & NSE India.
💬 Found this useful?
🔼 Boost this post to support structured learning
✍️ Share your thoughts or questions in the comments
🔁 Forward this to traders who value clean technical studies
👉 Follow for disciplined, structured, STWP-style analysis
🚀 Stay Calm. Stay Clean. Trade With Patience.
Trade Smart | Learn Zones | Be Self-Reliant 📊
BDL - Breakdown With Reactive Oversold Conditions💹 Bharat Dynamics Ltd (NSE: BDL)
Sector: Defence | CMP: 1324.3
View: Bearish — Breakdown With Reactive Oversold Conditions
BDL has decisively broken below its recent consolidation structure near the 1350–1380 zone, confirming a bearish continuation phase rather than a routine pullback. The breakdown candle is wide-ranged and supported by above-average volume, signalling active supply dominance and institutional distribution. This move has pushed price into lower demand territory, invalidating earlier stabilization attempts and keeping the broader structure tilted to the downside.
From a structural standpoint, the stock remains firmly in a lower-high, lower-low sequence, with price trading well below its short- and medium-term moving averages. RSI has slipped to around 29.8, placing the stock in an oversold zone, but this should be read as exhaustion within a downtrend, not as a reversal signal. Stochastic is deeply oversold, while MACD remains negative with expanding bearish momentum, indicating sellers continue to control price discovery. ADX suggests the trend phase is still active, though volatility is beginning to rise as price approaches nearby demand.
Volume behaviour adds important context. While participation is above average (Vol-X ~1.06), it is not climactic, implying that selling pressure is orderly and controlled, not panic-driven. This keeps the door open for short-term reactive bounces, but does not yet support a structural trend change.
Key Support & Resistance Zones (Chart-Aligned)
Resistance Zones:
• 1348–1373 (broken base, now supply)
• 1387 (upper supply / rejection zone)
Support Zones:
• Support 1: 1309.93 (minor demand, reaction-level support)
• Support 2: 1295.57 (intermediate demand)
• Support 3: 1271.03 (next structural support)
Support 1 at 1309.93 is expected to act as a pause or bounce zone, not a reversal base. A sustained breakdown below this level increases downside probability toward 1295.57 and 1271.03, while any bounce into the 1348–1373 region is likely to face renewed supply unless accompanied by clear structural improvement.
On the derivatives side, the 1320 PUT is referenced purely for analytical insight. The option shows an LTP near 25 with a delta of about -0.45, offering balanced directional sensitivity. A sharp OI contraction of over 30 percent alongside a strong volume expansion highlights short-covering-led activity, not aggressive fresh bearish positioning. IV remains in a mid-range band, consistent with reactive price behaviour rather than sustained trend acceleration.
Overall, BDL remains in a bearish structural phase with weak momentum and elevated risk. Short-term oversold bounces are possible near Support 1, but the larger framework continues to favour sell-on-rise behaviour unless price reclaims resistance with strong follow-through and volume confirmation.
Final Outlook (Educational Snapshot):
Momentum: Weak | Trend: Down | Risk: Low| Volume: Normal
⚠️ STWP Legal Disclaimer
This document is strictly for educational and informational purposes. All examples, charts, levels, and option structures discussed are illustrative and are not intended as buy, sell, or hold recommendations. STWP does not provide investment advice, trading tips, signals, or personalized financial guidance of any kind, nor is it a SEBI-registered intermediary or research analyst. The analyses, illustrations, and risk–reward structures included here are generic in nature and based on publicly available data and observed market behaviour, which may change without notice. Financial markets involve significant risk; derivatives in particular carry the potential for substantial losses. Option premiums, implied volatility, open interest, delta, and other market variables can fluctuate rapidly and unpredictably.
Readers are solely responsible for their trading decisions, capital management, and risk assessment. Before making any investment or trading decision, please consult a SEBI-registered investment advisor. STWP, its representatives, and affiliates shall not be liable for any direct or indirect loss arising from the use of this material. Historical patterns or past market behaviour do not guarantee future outcomes, nor should any part of this document be interpreted as a promise of performance, accuracy, or returns.
Position Status: No active position in this instrument at the time of analysis.
Data Source: TradingView & NSE India.
💬 Found this useful?
🔼 Boost this post to support structured learning
✍️ Share your thoughts or questions in the comments
🔁 Forward this to traders who value clean technical studies
👉 Follow for disciplined, structured, STWP-style analysis
🚀 Stay Calm. Stay Clean. Trade With Patience.
Trade Smart | Learn Zones | Be Self-Reliant 📊

Zuari Agro Chemicals cmp 294.80 by Monthly Chart viewZuari Agro Chemicals cmp 294.80 by Monthly Chart view
- Support Zone 239 to 274 Price Band
- Resistance Zone 325 to 362 Price Band
- Rounding Bottom by Resistance Zone neckline
- Breakout well sustained above dotted Falling Resistance Trendlines
- 3rd Falling Resistance Trendline from ATH level Breakout maybe made
- Rising Support Trendlines are well respected by upside price momentum
- Volumes with heavy spikes in between by close sync with avg traded quantity

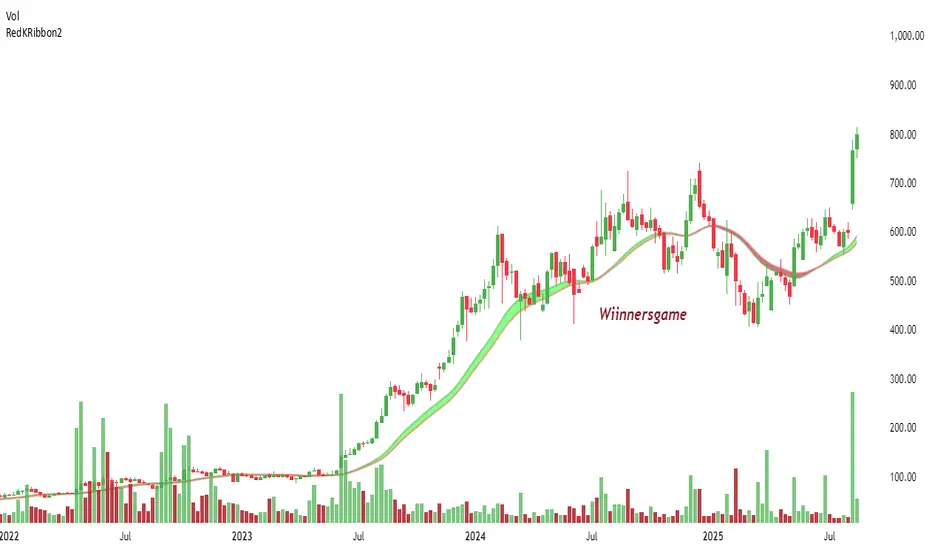
HBL ENGG, FRESH BREAKOUT FOR ANOTHER BULL RUNHBL ENGG (W) 800 has given fresh breakout above 735 and highest all time high closing. All leading and lagging indicators are bullish. Breakout is supported by heavy buying volumes.
Expected technical targets are 940/1080/1260 in next 12 to 18 months.
Set up invalid if stock falls below 740 on weekly closing basis.
COFORGE - Bullish Breakout Swing Trade Setup💹 Coforge Ltd (NSE: COFORGE)
Sector: IT Services & Consulting | CMP: 1910.20 | View: Bullish Breakout Swing Trade Setup
The COFORGE price structure has begun to reveal a controlled, conviction-based transition from consolidation to momentum. The latest bullish candle wasn’t just a breakout attempt — it carried strength, intent, and participation. Price pushed cleanly through short-term supply while maintaining the higher-low rhythm that has been forming over the past few weeks, indicating a well-built base rather than a reactive spike. Momentum indicators aligned with the price story. RSI broke above its resistance zone, shifting from neutrality into strength — a classic early phase of trend expansion. The Bollinger Bands opened up as the BB Squeeze turned off, confirming that volatility has started releasing in the direction of the breakout. This is typically the moment where institutions begin showing their hand. Volume behaviour strengthened the narrative. The surge wasn’t erratic; it was measured, steady, and consistent with accumulation rather than exhaustion. Buyers absorbed supply efficiently, allowing price to move with stability instead of urgency. This is the type of volume signature that precedes a clean swing leg. Supporting metrics in the broader structure pointed toward balance with a bullish tilt. Market strength indicators showed improving buyer control, the candle body carried dominance, and the range behaviour leaned towards continuation rather than rejection. No distortions, no volatility shocks — just a disciplined transition into momentum.
Taken together, COFORGE presents a well-structured environment:
– Strong candle dominance
– Expanding volatility in the direction of strength
– RSI and BB signals aligning
– Controlled volume confirmation
– A swing-friendly setup with a developing trend backbone
Illustrative Swing Trade Example –
Entry Price: 1910.20
Stop Loss: 1880(On Daily Closing Basis)
View: Short-term swing trade based on bullish breakout
⚠️ Disclaimer
This document is strictly for educational and informational purposes. All examples, charts, levels, and option structures discussed are illustrative and are not intended as buy, sell, or hold recommendations. STWP does not provide investment advice, trading tips, signals, or personalized financial guidance of any kind, nor is it a SEBI-registered intermediary or research analyst.
The analyses, illustrations, and risk–reward structures included here are generic in nature and based on publicly available data and observed market behaviour, which may change without notice. Financial markets involve significant risk; derivatives in particular carry the potential for substantial losses. Option premiums, implied volatility, open interest, delta, and other market variables can fluctuate rapidly and unpredictably. Readers are solely responsible for their trading decisions, capital management, and risk assessment. Before making any investment or trading decision, please consult a SEBI-registered investment advisor. STWP, its representatives, and affiliates shall not be liable for any direct or indirect loss arising from the use of this material. Historical patterns or past market behaviour do not guarantee future outcomes. Nothing in this document should be interpreted as a promise of performance, accuracy, or returns.
Position Status: No active position in COFORGE at the time of analysis.
Data Source: TradingView & NSE India .
💬 Found this useful?
🔼 Boost this post to support structured learning
✍️ Drop your thoughts or questions in the comments
🔁 Share with traders who benefit from clean technical studies
👉 Follow for disciplined, structured, STWP-style analysis.
🚀 Stay Calm. Stay Clean. Trade With Patience.
Trade Smart | Learn Zones | Be Self-Reliant 📊

MAN IND, DARVAX BOX BREAKOUTMAN IND 465 good Darvax box breakout happening backed up by volumes.
support near 435-438 range while target expected 490 to 520 first.

BBTC - Strong Bullish Momentum Breakout
💹 Bombay Burmah Trading Corp. Ltd (NSE: BBTC)
Sector: Diversified Holdings | CMP: 2022.70 | View: Strong Bullish Momentum Breakout
Chart Pattern: Falling Channel Breakout
Candlestick Pattern: Three Inside Up
Swing High: 2074
Swing Low: 1740
STWP Trade Analysis:
Breakout Entry: 2048
Stop Loss: 1816
Momentum: Very Strong
Volume: Exceptional institutional surge
The candle shows dominance from bulls with a surge above recent range, supported by fresh volume expansion and a clear shift in trend behaviour.
Resistances:
2099.47 | 2176.23 | 2304.47
Supports:
1894.47 | 1766.23 | 1689.47
STWP Stock Analysis:
Final Outlook:
Momentum: Strong | Trend: Bullish Developing | Risk: Moderate | Volume: Very High
BBTC has delivered a high-conviction breakout, with an explosive volume spike that clearly signals institutional participation. The strong bullish candle has invalidated prior downside pressure and pushed the stock above its short-term resistance band. The price action has reclaimed short-term averages and is moving away from the lower accumulation zone, supported by RSI stabilizing near the balanced zone, MACD attempting a recovery crossover, and Stochastic signalling early momentum buildup.
The VCP dashboard shows no active contractions but confirms volume dry-up previously, suggesting that the breakout candle represents the first expansion leg after consolidation. Volume today is unusually high, indicating ignition strength and potential start of a trend reversal from the recent downtrend.
Multiple confluences — 52-week volume breakout, EMA compression easing, Bullish Supertrend trigger, RSI rebound, and strong volume footprint — reinforce the improving momentum structure. Sustaining above 1894–1900 keeps the bullish bias intact and opens the path toward upper resistance zones at 2099 → 2176 → 2304.
Overall, BBTC now stands in a bullish reversal phase, driven by strong volume, improving indicators, and a clean breakout structure that favours continuation if the stock holds above its demand supports.
⚠️ Disclosure & Disclaimer – Please Read Carefully
The information shared here is purely for learning and educational purposes. It is not investment advice or a recommendation.
I am not a SEBI-registered advisor. All observations are based on charts, technical structures, and publicly available data.
Market trading involves significant risk. Please consult a SEBI-registered financial advisor before acting on any idea.
Position Status: No active position in BBTC at the time of analysis.
Data Source: TradingView & NSE India (Past Chart Reference).
💬 Found this useful?
🔼 Boost this post to support structured learning
✍️ Drop your thoughts or questions in the comments
🔁 Share with traders who benefit from clean technical studies
👉 Follow for disciplined, structured, STWP-style analysis.
🚀 Stay Calm. Stay Clean. Trade With Patience.
Trade Smart | Learn Zones | Be Self-Reliant 📊

OVERVIEW FOR TODAY - CHART H1 OVERVIEW
Price is currently sitting inside the POC zone – the area with the highest traded volume → the market usually consolidates here before choosing a direction.
Prior trend: Strong uptrend → distribution → correction.
The ascending trendline has been broken → short-term trend is bearish (downtrend).
Volume Profile shows the VAH above as strong resistance, and VAL below as strong support.
1: Price bounces from POC → moves up toward VAH (medium probability)
Conditions:
Price holds above the POC zone (~4000–4010).
Bullish price action appears (pin bar, engulfing, break of structure on H4).
Targets:
4120–4160 (VAH zone) → this is major resistance.
If VAH breaks → trend may resume upward with a larger target around 4300+.
Assessment:
Possible, but not the highest probability, because recent bearish momentum is still strong.
2: Price breaks below POC → retest → drops to VAL (HIGHEST PROBABILITY)
Current candles show strong rejection from VAH → falling directly into POC → bearish confirmation.
If D1 closes below the POC:
Bearish continuation becomes likely.
Targets:
3920–3950 (VAL zone) → very strong support.
Volume Profile thins out here → price tends to move quickly through this area.
Assessment:
This is the most likely scenario because:
✔ Trendline is broken.
✔ Weak bullish reaction at VAH.
✔ Volume Profile structure favors a move downward into VAL.
3: Price breaks below VAL → deeper drop toward Demand zone (low probability but dangerous)
Conditions:
D1 closes below 3920 (VAL)
Breaks the horizontal support.
Deep Targets:
3550–3600 (major Demand zone).
This is where the longer-term uptrend may recover.
Assessment:
Low probability, but if triggered → gold will make a sharp correction.
FINAL CONCLUSION
Highest probability: BEARISH continuation → drop toward VAL zone (3920–3950)
Because:
Strong rejection from VAH
Price sitting weakly on POC
Short-term structure turning bearish
[bTrading Suggestions
For short setups:
Look to sell on a retest of POC (4000–4010).
SL above VAH (4060–4080).
TP at VAL.
For long setups:
Only buy at VAL zone when clear reversals appear (pin bar, engulfing).
Avoid buying between POC → VAL.
⚠️ Disclaimer
All analyses and insights provided in this content are for informational purposes only and should not be considered financial advice. The financial market carries inherent risks, and every trader is fully responsible for their own decisions. Trade with a plan, discipline, and proper risk management.

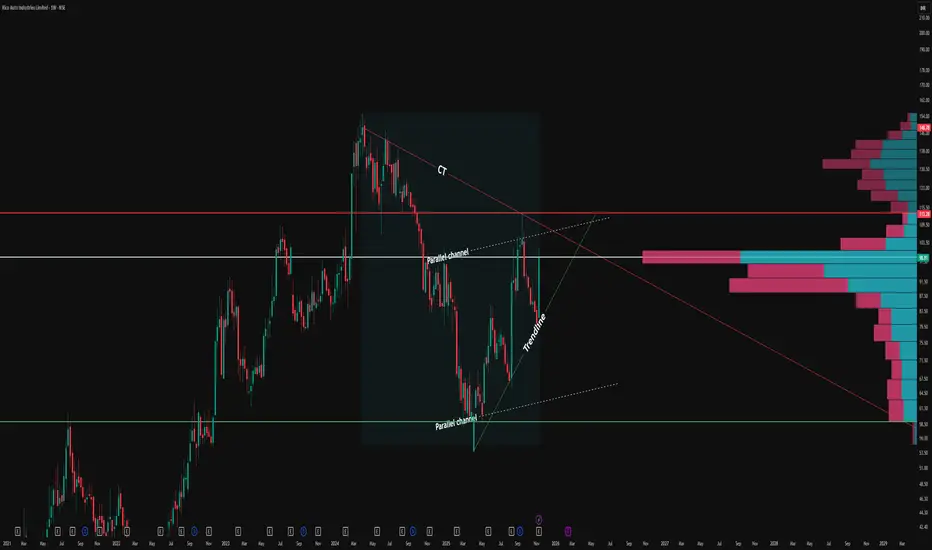
How Counter Trendlines and Parallel Channels Reveal Price StructThe CT (Counter Trendline) as the prime technical feature. The red CT line distinctly marks recurring lower high rejections, shaping significant supply pockets and creating low-liquidity price zones at every inflection point.
Each touch validates the CT’s relevance, highlighting how price is repeatedly capped at these lower highs before reversing downward.
Overlaying this, a hidden parallel channel (dotted white lines) frames the swing movement. The channel not only encapsulates price but also serves as a running test of trend strength: each upper boundary touch confirms resistance, while bottoms act as support.
Notably, more hits at the upper parallel line than the base typically signal rising underlying bullish energy, especially when accompanied by the green trendline’s upward momentum.
No breakout, no prediction—just objective structure. The parallel channel and trendlines, when mapped carefully, elevate clarity on price balancers, guidance zones, and the ongoing duel between support and rejection.
Observe how these formations reveal crowd psychology and liquidity placement without forcing a directional view.
MARUTI, DARVAS BOX BREAKOUTBUY MARUTI 13400 TILL 13100 for 13650/14200 in short term. Clear Darvas box breakout happening with volumes. Stock after multi year breakout above 10000 is now heading towards 18500 as medium term investment bet (Fibonacci extension levels)

GRSE – Bullish Continuation Breakout |________________________________________
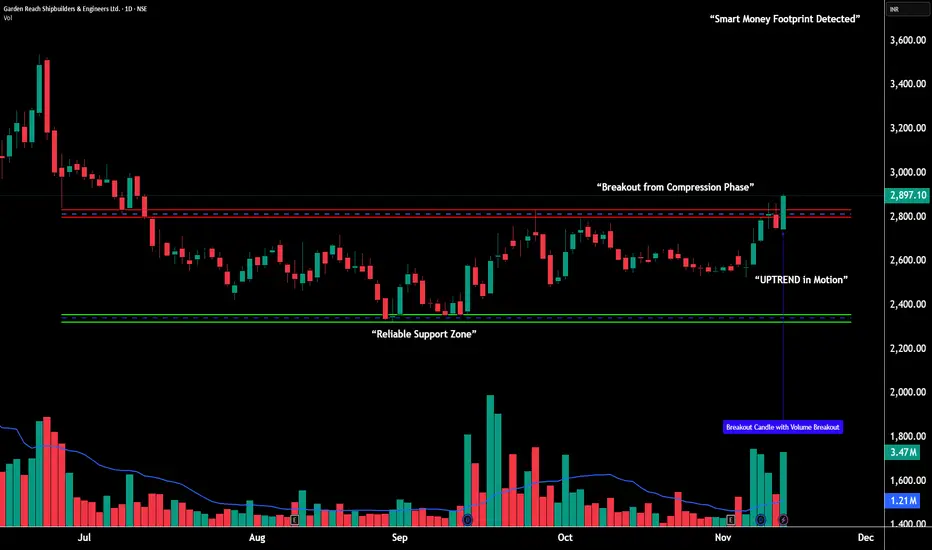
💹 Garden Reach Shipbuilders & Engineers Ltd (NSE: GRSE)
Sector: Defence & Engineering | CMP: 2,897.10
View: Bullish Momentum Breakout with Institutional Strength
________________________________________
📊 Price Action (Explained Simply):
GRSE has shifted from a slow sideways phase into a strong uptrend after rising from the 2,323 swing low to 2,904 with two powerful, wide-range green candles.
The most important part of this move is the huge jump in volume — 3.47M shares traded vs 1.21M average — which clearly signals institutional accumulation.
This breakout shows that the stock has moved from “quiet preparation” into “active momentum,” and holding above the 2,790–2,820 zone will be crucial for the continuation of this trend.
________________________________________
📉 Chart Pattern – Continuation Breakout:
After multiple accumulation attempts between 2,500–2,650, GRSE broke out with a clean, strong bullish marubozu candle.
This candle confirms buyer dominance throughout the session and typically marks the start of a new trending leg.
The structure now supports sustained follow-through as long as the stock maintains support above key zones.
________________________________________
📈 STWP Trading Analysis:
Bullish Breakout Zone: 2,897.10 - 2,904.40
Stop Loss: 2,735
The stock is now trading above short- and mid-term EMAs with trend alignment visible across daily, weekly, and monthly charts.
Sustaining above 2,790–2,820 keeps the bullish structure intact, while a strong close above 3,100 can trigger the next momentum wave.
________________________________________
🕯️ Candlestick Structure – Bullish Engulfing + Bullish Marubozu:
The current breakout session displays a Bullish Engulfing candle followed by a strong Bullish Marubozu, showing complete dominance from buyers. The engulfing pattern absorbed the previous red candle entirely, signaling a clear shift in control, while the marubozu confirms uninterrupted buying pressure throughout the session. When these two patterns appear together — backed by a sharp surge in volume — it reflects institutional accumulation and high conviction demand entering the stock. Such powerful candlestick combinations near breakout zones often act as trend-continuation triggers, indicating that buyers are firmly in charge and gearing up for the next upward expansion.
________________________________________
📏 Fibonacci Analysis:
Using swing low 2,323 → swing high 3,538:
38.2%: 2,787 → Strong support
50%: 2,930 → Active consolidation zone
61.8%: 3,047 → First major resistance
78.6%: 3,278 → Extended resistance
As long as the stock holds above 2,790–2,820, the Fibonacci map supports continuation toward higher levels.
________________________________________
🧭 Support & Resistance (STWP Levels):
Resistances: 2,955 | 3,010 | 3,116
Supports: 2,791 | 2,685 | 2,628
The zone around 2,790–2,820 is now the primary demand base and acts as the key level to protect for bullish continuation.
________________________________________
📊 Volume & Technical Setup:
Volume: 3.47M vs 1.21M → Clear institutional activity
RSI: 69 → Strong but healthy momentum
Stochastic: 98 → Buyer dominance
CCI: 205 → Strong trend confirmation
MACD: Bullish → Trend aligned across timeframes
Trend Direction: UPTREND
Volume Confirmation: Strong institutional participation
________________________________________
🧩 STWP Summary View:
Momentum: Strong
Trend: Bullish
Risk: Moderate
Volume: High
GRSE has entered a clean breakout phase supported by strong volume, supportive sector sentiment, and consistent institutional footprints.
As long as the stock protects the 2,790–2,820 zone, the path remains open toward 3,075 → 3,275 and, in a strong extension, toward 3,538.
________________________________________
⚠️ Disclosure & Disclaimer – Please Read Carefully
This analysis is for educational purposes only and should not be treated as investment advice or a buy/sell recommendation.
I am not a SEBI-registered investment adviser. All insights are based on price action, technical structure, and publicly available data.
Trading involves risk — always manage position size, stop-loss, and discipline.
Please consult a SEBI-registered financial advisor before trading based on any analysis.
________________________________________
Position Status: No active position in (GRSE) at the time of posting.
Data Source: TradingView & NSE India
________________________________________
💬 Found this useful?
🔼 Boost this post to help more learners discover structured analysis.
💭 Share your thoughts — can GRSE carry this momentum above 3,100?
🔁 Share with traders tracking defence-sector strength.
👉 Follow for more clean, price-action based institutional setups.
🚀 Stay Calm. Stay Clean. Trade With Patience.
Trade Smart | Learn Zones | Be Self-Reliant 📊
________________________________________
Symmetrical Triangle Structure & Key EquilibriumEditorial Insights
- Symmetrical triangles signal a balanced tug-of-war between buyers and sellers; this compression, as mapped here, often precedes significant expansions in volume and volatility.
- The triangular structure’s edges—CT (red) and trendline (green)—have been tested repeatedly over months, reflecting both supply absorption and demand resilience.
- The hidden white line adds a subtle layer of convergence, useful for traders identifying areas of potential liquidity concentration.
- The yellow 50% Fibonacci level frames the equilibrium for this market phase, offering a snapshot of price discovery dynamics within the triangle.
- Price positioning relative to all these lines is best seen as a way to monitor evolving order flow and market intent, without any explicit forecasting or directional bias.
Key Levels & Reference
- CT (Red): Major supply test points.
- Trendline (Green): Demand and higher low sequence.
- Hidden Line (White): Structural convergence not visibly obvious but influential.
- Fibonacci 50% (Yellow): Core equilibrium reflecting price agreement zone.
This post is for educational and analytical purposes, respecting the principle that all information is a visual observation—not a prediction or directional signal, but a live structure map to enrich your pattern playbook.
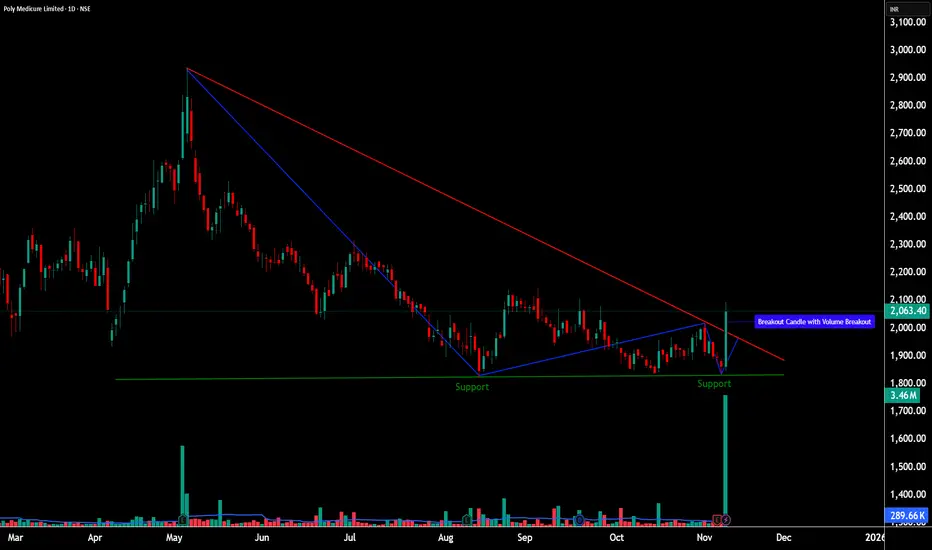
POLYMED - Breakout from Descending Triangle with Volume💹 Poly Medicure Ltd (NSE: POLYMED)
Sector: Healthcare & Diagnostics | CMP: ₹2,063.40 | View: Descending Triangle Breakout + 52-Week Volume Expansion
📊 Price Action
Poly Medicure finally broke out from a six-month descending structure with a sharp bullish candle. The move came after sustained compression near ₹1,800–₹1,850 support and resulted in a clean trendline breakout with the highest daily volume of the year.
Chart Pattern: Descending Triangle (Breakout in Progress)
Candlestick Pattern: Bullish Engulfing (Formed at Lower Boundary of Triangle – Base Support Zone ₹1,800–₹1,850)
📈 STWP Trading Analysis
STWP Trade Setup
Bullish Breakout: ₹2,094.30
Stop Loss: ₹1,829.30
Possible Intraday Demand Zone: 1869.50 - 1850.20
Possible Swing Demand Zone: 1869.50 - 1832.90
Momentum: High
Volume: 52-week breakout
This marks the possible conviction zone — where price, pattern, and participation align perfectly.
🧭 Support & Resistance
Support 1: ₹1,908 – immediate retest zone
Support 2: ₹1,752 – mid-base accumulation area
Support 3: ₹1,659 – final demand base
Resistance 1: ₹2,156 – near-term resistance
Resistance 2: ₹2,249 – previous supply pocket
Resistance 3: ₹2,404 – key breakout target zone
🔢 Fibonacci Levels
Retracement from the ₹3,000 high to ₹1,700 low shows:
38.2% level: ₹2,160
50% level: ₹2,350
📈 Volume & Momentum Setup
RSI: back above 61 — momentum returning
MACD: bullish crossover with growing histogram
CCI: high but justified by volume expansion
The breakout candle printed the highest daily volume in a year, confirming institutional accumulation.
While the weekly chart remains in recovery mode, the daily structure is already in breakout alignment.
🧩 STWP Summary View
Momentum: Strong
Trend: Early Reversal Attempt
Volume: Extremely High
Risk: Moderate (Stop below ₹1,830)
Bias: Bullish above ₹2,100 | Neutral below ₹1,850
________________________________________
⚠️ Disclosure & Disclaimer – Please Read Carefully
This post is created purely for educational and informational purposes and does not constitute investment advice or a buy/sell recommendation.
I am not a SEBI-registered investment adviser. All observations are based on technical studies and publicly available information.
Trading and investing involve risk; please manage position size and stop-loss discipline as per your risk profile.
Always consult a SEBI-registered financial advisor before making trading decisions.
________________________________________
Position Status: No active position in (POLYMED) at the time of analysis.
Data Source: TradingView & NSE India
💬 Found this useful?
🔼 Boost this post if you value clean, structured analysis.
💭 Drop your views — can Torrent Pharma sustain this breakout above ₹3,835?
🔁 Share this with traders who track institutional breakouts.
👉 Follow for more price-action based institutional setups.
🚀 Stay Calm. Stay Clean. Trade With Patience.
Trade Smart | Learn Zones | Be Self-Reliant 📊
________________________________________
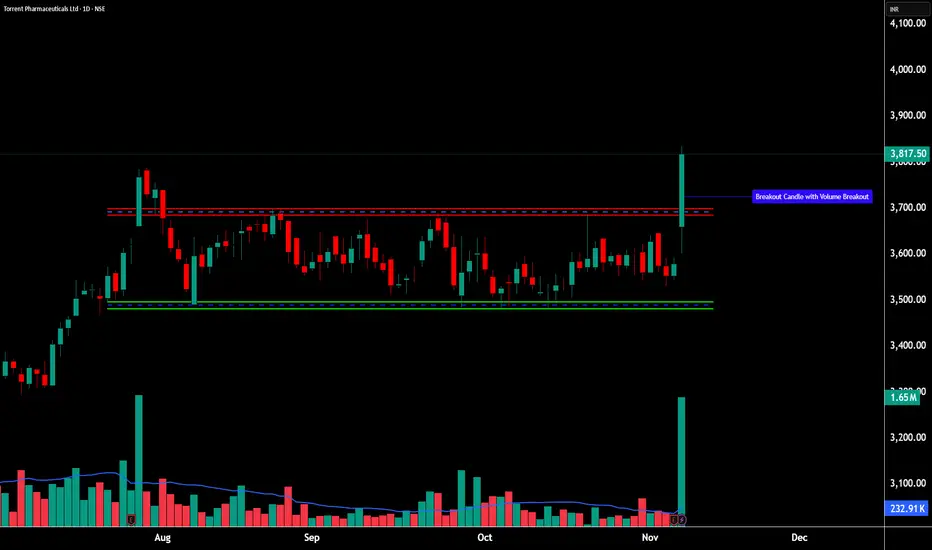
TORNTPHARM - 52-Week Breakout With Institutional Conviction________________________________________
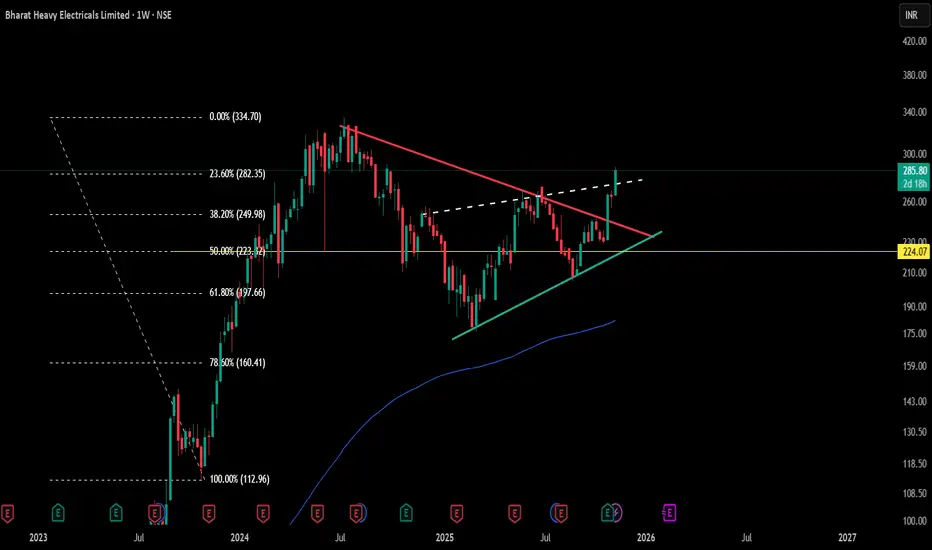
💹 Torrent Pharmaceuticals Ltd (NSE: TORNTPHARM)
Sector: Pharmaceuticals | CMP: ₹3,817.50 | View: 52-Week Breakout With Institutional Conviction
________________________________________
📊 Price Action:
Torrent Pharma delivered a powerful 52-week breakout candle backed by exceptionally high volume, confirming strong institutional participation and renewed leadership momentum within the pharma space.
After consolidating for several weeks between ₹3,400–₹3,650, the stock broke through resistance with a wide-range bullish candle, signaling a structural shift from accumulation to expansion.
The follow-through strength and delivery volume highlight conviction buying, positioning Torrent Pharma for potential short- to medium-term trend continuation.
________________________________________
💼 HNI Trade Levels (STWP Setup):
Aggressive Entry: ₹3,817–₹3,835 | Stop Loss: ₹3,660
Low-Risk Entry: ₹3,770 | Stop Loss: ₹3,594.09
The breakout session recorded 1.65M shares vs 0.23M average, confirming institutional footprints.
Price structure has cleanly shifted into higher territory, with ₹3,665–₹3,700 now acting as the new demand base.
Sustaining above this zone keeps the bias firmly bullish with room for further upside extension.
________________________________________
📉 Chart Pattern Analysis – 52-Week Breakout (Institutional Structure):
Torrent Pharma has been in a multi-week compression phase, forming a tight base under the ₹3,700 resistance zone.
Such base formations often precede high-conviction institutional breakouts, and the explosive candle with volume confirmation validates that the breakout is not speculative but driven by genuine accumulation.
The move aligns with sectoral strength seen across quality pharma counters, where price action is transitioning from range-bound to trending behavior.
This breakout now places Torrent Pharma in the leadership bracket within the pharma index structure, supported by momentum and delivery expansion.
________________________________________
📈 STWP Trading Analysis:
Bullish Breakout: ₹3,817–₹3,835 | Stop Loss: ₹3,660.06
The breakout candle exhibited strong momentum with a 7x volume surge, indicating clear participation from institutions and long-only funds.
Price has decisively closed above short- and medium-term EMAs, confirming trend alignment across daily and weekly timeframes.
Holding above ₹3,665–₹3,700 will maintain the bullish bias, keeping the setup active toward ₹3,935–₹4,015 in the short term.
A sustained close above ₹3,935 can potentially open the next expansion leg toward ₹4,145 levels.
________________________________________
📈 Candlestick Structure – Bullish Strength Confirmation:
The breakout candle represents a strong bullish engulfing formation, signaling complete control by buyers.
The large body-to-wick ratio and volume expansion confirm institutional momentum entry rather than retail-driven strength.
Such candles following a multi-week base often mark early-stage uptrend resumption phases, where risk-to-reward remains highly favorable if trend levels hold.
________________________________________
📏 Fibonacci Analysis:
From swing low ₹3,079 to swing high ₹3,835:
61.8% retracement @ ₹3,436 → Major base support
50% retracement @ ₹3,457 → Structural accumulation zone
23.6% retracement @ ₹3,666 → Confirmed demand zone
Sustaining above the 23.6% level keeps the momentum firmly intact, while a clean close above ₹3,935 validates continuation toward ₹4,145–₹4,185 Fibonacci extension levels.
________________________________________
🧭 STWP Support & Resistance:
Resistances: ₹3,901 | ₹3,984 | ₹4,134
Supports: ₹3,667 | ₹3,518 | ₹3,344
The ₹3,665–₹3,700 area remains the immediate accumulation pocket, aligning with EMA support and Fibonacci confluence.
The breakout above ₹3,835 confirms strength, while supports around ₹3,500 represent deeper institutional demand zones.
________________________________________
📊 STWP Volume & Technical Setup:
Today’s session saw 1.65M shares traded vs 0.23M average, validating strong institutional accumulation and conviction buying.
Indicators confirm trend strength:
RSI (70+) – sustaining above bullish zone.
MACD – positive crossover maintained.
CCI & Stochastic – both elevated, reflecting momentum expansion.
Overall alignment across daily and weekly charts confirms trend continuation potential.
Trend Direction: UPTREND | Volume Confirmation: Strong Institutional Activity
________________________________________
🧩 STWP Summary View:
Final Outlook:
Momentum: Strong | Trend: Bullish | Risk: Moderate | Volume: High
Torrent Pharma’s breakout signifies a transition from accumulation to expansion, supported by clear institutional conviction and strong technical structure.
As long as the price sustains above ₹3,665–₹3,700, the bias remains bullish with targets toward ₹3,935–₹4,145 in the near term.
The setup continues to display a clean risk–reward framework within an evolving leadership trend in the pharma sector.
________________________________________
⚠️ Disclosure & Disclaimer – Please Read Carefully
This post is created purely for educational and informational purposes and does not constitute investment advice or a buy/sell recommendation.
I am not a SEBI-registered investment adviser. All observations are based on technical studies and publicly available information.
Trading and investing involve risk; please manage position size and stop-loss discipline as per your risk profile.
Always consult a SEBI-registered financial advisor before making trading decisions.
________________________________________
Position Status: No active position in (TORNTPHARM) at the time of analysis.
Data Source: TradingView & NSE India
💬 Found this useful?
🔼 Boost this post if you value clean, structured analysis.
💭 Drop your views — can Torrent Pharma sustain this breakout above ₹3,835?
🔁 Share this with traders who track institutional breakouts.
👉 Follow for more price-action based institutional setups.
🚀 Stay Calm. Stay Clean. Trade With Patience.
Trade Smart | Learn Zones | Be Self-Reliant 📊
________________________________________
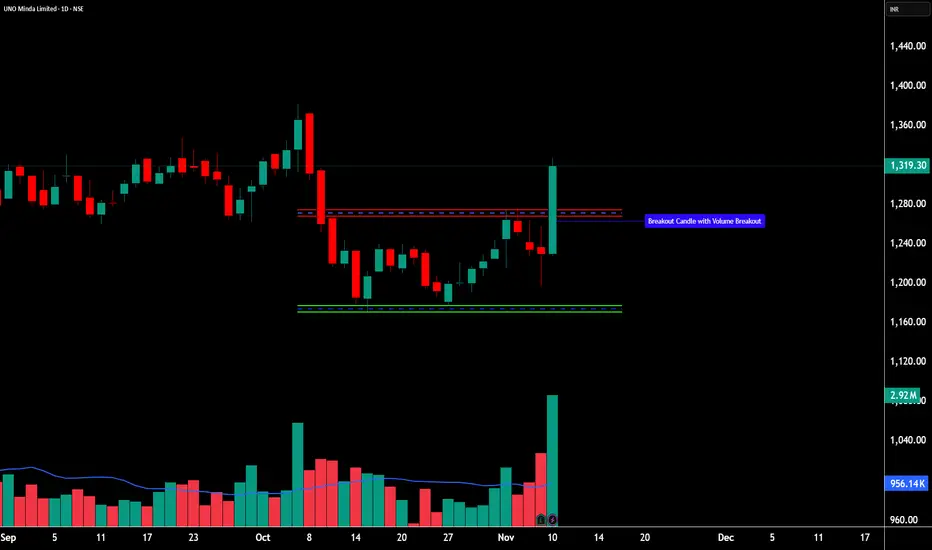
UNOMINDA - Institutional Breakout After Price Compression________________________________________
💹 UNO Minda Ltd (NSE: UNOMINDA)
Sector: Auto Components | CMP: ₹1,319.30 | View: Institutional Breakout After Price Compression
________________________________________
📊 Price Action:
UNO Minda has delivered a strong breakout candle after a prolonged phase of price compression within a rising channel, confirming a shift from consolidation to directional momentum.
The stock rebounded sharply from the ₹1,190 zone and pierced through the upper trendline with an exceptionally high volume spike, signaling renewed institutional interest.
This breakout structure now positions the stock for a potential continuation move as long as price sustains above the ₹1,255–₹1,270 support base.
________________________________________
💼 HNI Trade Levels (STWP Setup):
Aggressive Entry: ₹1,319–₹1,327 | Stop Loss: ₹1,238.57
Low-Risk Entry: ₹1,297 | Stop Loss: ₹1,210.74
The breakout candle recorded volume of 2.9M vs 0.95M average, confirming heavy accumulation and strong HNI participation.
The near-term momentum bias remains bullish, supported by both volume expansion and favorable price structure.
________________________________________
📉 Chart Pattern Analysis – Compression Breakout (Bullish Structure):
Over the past few weeks, UNO Minda formed a rising channel pattern characterized by narrowing ranges and lower volatility — a classic price compression structure.
This phase often precedes large directional moves, and the breakout above ₹1,310 confirms the volatility expansion phase.
Such structures typically indicate early-stage accumulation by institutional hands before momentum expansion begins.
The confirmation of breakout with both volume and candle strength reflects clear smart money participation.
________________________________________
📈 STWP Trading Analysis:
Bullish Breakout: ₹1,319–₹1,327 | Stop Loss: ₹1,195.20
The breakout candle displayed strong momentum and 3x volume expansion, validating aggressive buying from higher timeframes.
Price action has now closed firmly above short- and mid-term EMAs, aligning all major timeframes — Daily, Weekly, and Monthly — in a unified uptrend.
Holding above ₹1,255–₹1,270 will maintain the bullish bias, keeping the setup active toward ₹1,379–₹1,420 in the near term.
A decisive close above ₹1,355 could further accelerate the next leg of the uptrend, extending the move toward ₹1,455.
________________________________________
📈 Candlestick Structure – Bullish Engulfing Confirmation:
The current breakout candle is a strong bullish engulfing formed after a brief sideways phase — signaling renewed dominance of buyers.
Such candles, especially when paired with volume spikes and EMA crossovers, mark the beginning of institutional-led expansion legs.
The price-volume confluence validates that the short-term correction phase has likely ended, and the stock is transitioning into an active swing momentum phase.
________________________________________
📏 Fibonacci Analysis:
From swing low ₹1,114 to swing high ₹1,327.8:
61.8% retracement @ ₹1,190 → Strong support zone defended.
78.6% retracement @ ₹1,255 → Current breakout retest area.
100% extension @ ₹1,327 → Confirmed expansion level.
Sustaining above ₹1,255 keeps the structure intact and supports continuation toward the ₹1,379–₹1,420 target band.
________________________________________
🧭 STWP Support & Resistance:
Resistances: ₹1,355 | ₹1,391 | ₹1,456
Supports: ₹1,255 | ₹1,191 | ₹1,155
The ₹1,255–₹1,270 zone remains a high-probability demand pocket, supported by both Fibonacci confluence and recent volume base formation.
The ₹1,355–₹1,390 zone acts as a minor resistance band, where partial booking or temporary supply may appear before momentum resumes.
________________________________________
📊 STWP Volume & Technical Setup:
Today’s breakout session recorded 2.92M shares vs 0.95M average, confirming exceptional institutional participation.
Indicators such as RSI (68.7) and MACD bullish crossover reinforce the continuation potential.
Stochastic and CCI both remain in strong zones, consistent with trend alignment across timeframes.
Trend Direction: UPTREND | Volume Confirmation: Strong Institutional Activity
________________________________________
🧩 STWP Summary View:
Final Outlook:
Momentum: Strong | Trend: Bullish | Risk: Moderate | Volume: High
UNO Minda has transitioned from a consolidation phase into a clean institutional breakout setup.
The combination of price compression, breakout volume, and bullish engulfing confirmation signals a fresh impulse wave beginning within the existing uptrend.
Holding above ₹1,255–₹1,270 will sustain the bullish structure, with potential upside toward ₹1,420–₹1,455 zones in the coming sessions.
________________________________________
⚠️ Disclosure & Disclaimer – Please Read Carefully
This analysis is intended solely for educational and informational purposes and does not constitute investment advice or a buy/sell recommendation.
I am not a SEBI-registered investment adviser. All observations are based on chart study, technical structure, and publicly available data.
Trading involves risk; please manage position size, stop-loss levels, and discipline as per your risk appetite.
Consult a SEBI-registered financial advisor before acting on any trade setup.
________________________________________
Position Status: No active position in (UNOMINDA) at the time of analysis.
Data Source: TradingView & NSE India
💬 Found this useful?
🔼 Boost this post to help more traders learn from structured setups.
💭 Drop your insights — how do you view this breakout’s sustainability?
🔁 Share with traders who value clean, volume-backed analysis.
👉 Follow for more price structure + institutional logic breakdowns.
🚀 Stay Calm. Stay Clean. Trade With Patience.
Trade Smart | Learn Zones | Be Self-Reliant 📊
________________________________________