BRITANNIA - Falling Wedge + Bullish Engulfing Combo💹 Britannia Industries Ltd (NSE: BRITANNIA)
Sector: FMCG | CMP: ₹5,892.50 | View: Falling Wedge + Bullish Engulfing Reversal Setup
📊 Price Action:
Britannia is currently displaying a strong confluence setup where both a chart pattern and a candlestick pattern align perfectly to signal a potential trend reversal.
After weeks of consolidation within a downward-sloping structure, the stock has formed a Falling Wedge pattern — a classic bullish reversal formation.
Adding strength to this structure, a Bullish Engulfing Candle on 4 Nov 2025 emerged from the wedge’s lower boundary, confirming buyer dominance and hinting at a near-term trend reversal.
📉 Chart Pattern Analysis – Falling Wedge (Bullish Setup):
The Falling Wedge pattern is marked by two converging downward trendlines, each connecting a series of lower highs and lower lows.
This structure reflects seller exhaustion and early buying interest.
Britannia’s wedge formation is now reaching its apex, where breakout probability is highest.
Volume contraction throughout the wedge also supports the notion that supply is drying up, preparing for a breakout above the upper trendline.
📈 Candlestick Pattern – Bullish Engulfing Confirmation:
The Bullish Engulfing Candle formed on 4 Nov 2025 precisely at the lower support line of the wedge, validating the pattern with strong timing. It represents a shift in control from sellers to buyers, with the green candle completely engulfing the prior red body. Volume expansion on that session further confirmed active participation by institutions ahead of the upcoming news catalysts. This one-day reversal candle acts as the first technical confirmation, while a breakout above the upper trendline will serve as the structural confirmation for the wedge pattern.
📏 Fibonacci Analysis:
From swing low ₹5,298 to swing high ₹5,930:
78.6% retracement @ ₹5,795 → Key reversal level defended.
61.8% retracement @ ₹5,888 → Currently reclaimed zone.
100% extension @ ₹5,930 → Short-term breakout threshold.
The Fibonacci structure aligns beautifully with the wedge’s geometry, implying that the reversal zone is complete and buyers are regaining momentum.
🧭 STWP Support & Resistance:
Resistances: ₹5,940 | ₹5,987 | ₹6,055
Supports: ₹5,825 | ₹5,775 | ₹5,710
The ₹5,775–₹5,825 range is acting as a high-confidence accumulation base, while ₹6,090–₹6,150 represents the key breakout trigger zone.
📊 STWP Volume & Technical Setup:
Volume on 4 Nov surged to 363.4K vs 248.7K average, confirming institutional interest at lower levels. VWAP recovery and improving RSI (47→52+) show that momentum is gradually returning.
MACD is approaching a bullish crossover, while Stochastic and CCI have both turned upward — all aligning with a reversal confirmation setup.
Trend Direction: UPTREND (Transitioning) | Volume Confirmation: Possible Accumulation in Progress
🧩 STWP Summary View:
Final Outlook:
Momentum: Strengthening | Pattern: Falling Wedge + Bullish Engulfing | Risk: Moderate | Volume: Increasing
Britannia’s technical structure now showcases dual confirmation — a chart pattern (Falling Wedge) supported by a candlestick reversal (Bullish Engulfing).
This confluence enhances the reliability of the reversal signal and increases the probability of an upside breakout. As long as the price holds above ₹5,825, the bias remains bullish with potential continuation toward ₹6,150–₹6,250.
⚠️ Disclosure & Disclaimer – Please Read Carefully
This analysis is for educational purposes only and should not be treated as financial or investment advice.
I am not a SEBI-registered investment adviser. All views are based on technical observations and publicly available information.
Trading involves risk; please assess your financial suitability, position size, and stop-loss levels before entering any trade.
Always consult a SEBI-registered financial adviser for personalized guidance.
Position Status: No active position in (BRITANNIA) at the time of this analysis.
Data Source: TradingView & NSE India
💬 Found this useful?
🔼 Give this post a Boost if you value clean technical confluence studies.
💭 Comment your thoughts — does this wedge-breakout setup look convincing to you?
🔁 Share this post to help others understand pattern + candlestick synergy.
👉 Follow for more institutional-style technical breakdowns built on clarity and patience.
🚀 Stay Calm. Stay Clean. Trade With Patience.
Trade Smart | Learn Zones | Be Self-Reliant 📊
Volumeanalysis

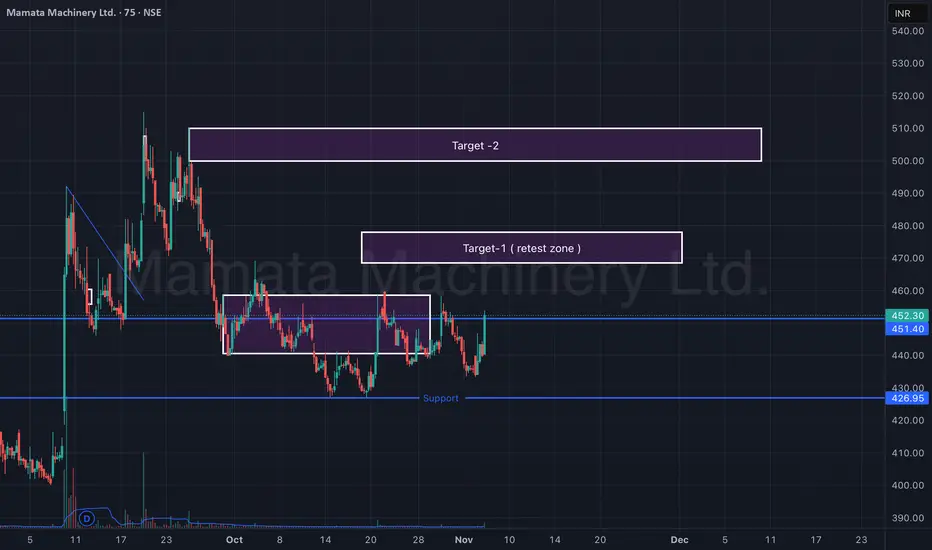
Mamata Machinery Ltd – Support Reversal & Retest Zone (75-min)Mamata Machinery is showing early signs of reversal from a strong support zone around ₹425–₹430. After forming a double-bottom-like structure, the stock has bounced sharply with rising volumes, indicating a possible short-term trend reversal.
Currently, price action is approaching a retest zone (Target-1) near ₹465–₹470. Sustaining above this level can open the path toward the next resistance cluster (Target-2) near ₹505–₹515.
🎯 Key Levels:
CMP: ₹452.30 (+3.81%)
Support Zone: ₹425 – ₹430
Target-1 (Retest Zone): ₹465 – ₹470
Target-2: ₹505 – ₹515
Stop-Loss: ₹425 (on 75-min close basis)
📊 Technical View:
Price rebounded from major support with visible volume spike.
Structure forming higher lows — early indication of momentum shift.
Short-term EMAs turning upward; potential crossover likely soon.
Sustained move above ₹470 can confirm breakout continuation toward ₹510+.
🧠 View:
Mamata Machinery has reversed from key support and is testing its retest zone. A breakout above ₹470 could trigger a short-term rally toward ₹510, while maintaining a stop-loss below ₹425.
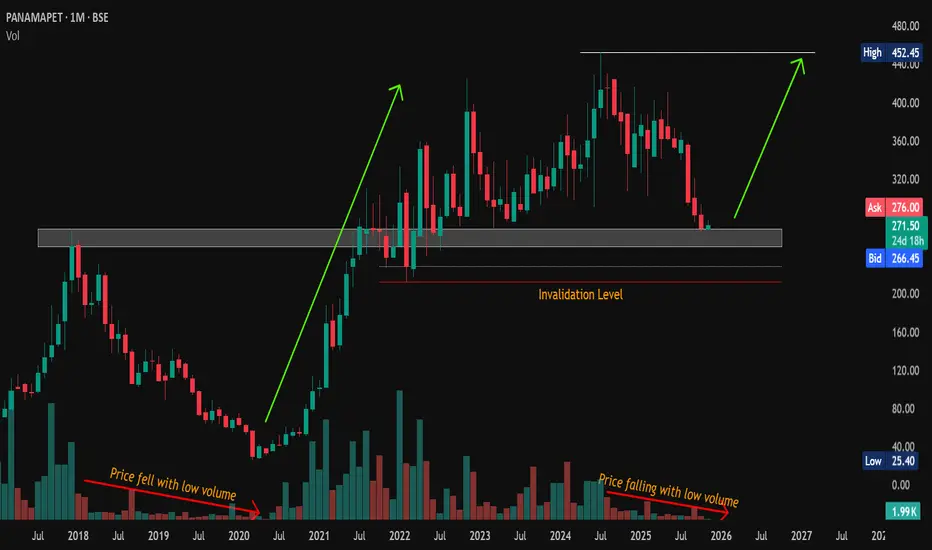
#PANAMAPET | Low-Volume Pullback at Key SupportCMP: 271.50
Price has returned to a major demand zone , and the decline came on low volume , hinting at weak selling pressure.
Could this be the calm before another rally toward 450+? 🚀
📊 Breakout–Retest–Continuation setup forming!
🛡 Supports: 268-249 / 229
🚧 Resistances: 279 / 347
❌ Invalidation: Below 212.50 (WCB)
🎯 Targets: 380 / 415 / 452+ (ATH)
📊 Volume Trend: Price falling on declining volume → typical sign of healthy corrections within an uptrend .
This setup resembles the early accumulation phase of 2020 , where the trend began to reverse from the base zone.
If buyers defend this area, we could see a continuation of the larger bullish trend that started in 2020. 📈
Watch for strength & volume pickup near the support zones for confirmation. 👀
#PANAMAPET #PriceAction #VolumeAnalysis #MarketStructure #LongTerm
📌 Disclaimer: This analysis is shared for educational purposes only. It is not a buy/sell recommendation. Please do your own research before making any trading decisions.
Timken India Ltd – Strong Breakout Momentum (Daily Chart)Timken India is showing strong bullish momentum after multiple rejections near ₹3,000 levels. The stock has now given a clean breakout from its short-term resistance zone, supported by rising volumes and bullish candles, indicating renewed buying interest.
The price has reclaimed key moving averages and is now eyeing the next resistance zone near ₹3,500–₹3,520, which acts as the target zone on the chart.
🎯 Key Levels:
CMP: ₹3,144 (+2.89%)
Breakout Zone: ₹3,080 – ₹3,100
Target Zone: ₹3,480 – ₹3,520
Stop-Loss: ₹3,000 (on daily close basis)
📊 Technical View:
Breakout above recent swing highs with volume confirmation.
Price now trading above key EMAs, indicating trend reversal.
Bullish continuation likely if price sustains above ₹3,100.
Volume spike adds strength to the breakout setup.
🧠 View:
The breakout from consolidation backed by volume makes Timken India a strong candidate for short-term momentum trades. Sustaining above ₹3,100 can open room toward ₹3,500+, with a stop-loss below ₹3,000.

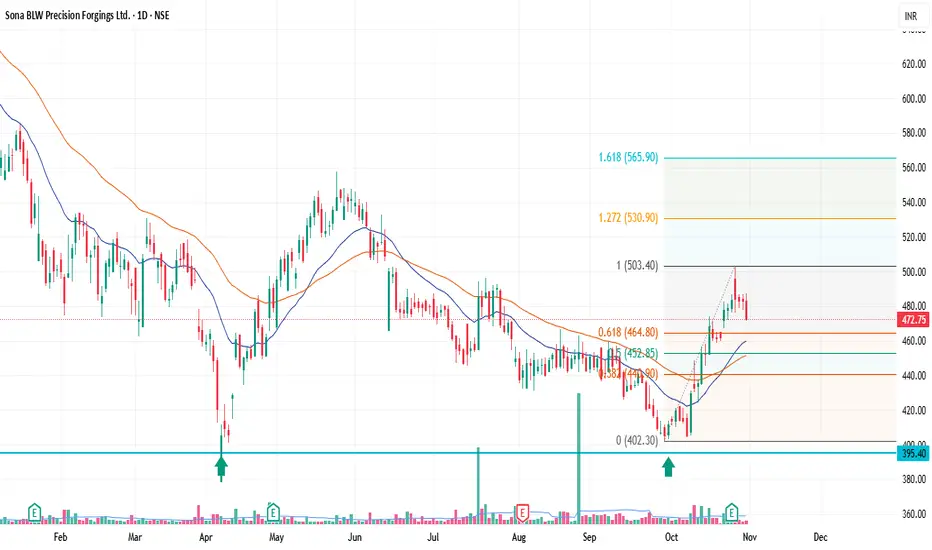
Sona BLW Precision Forgings Ltd. (SONACOMS) — pullback setup(SONACOMS) — Bullish Pullback Setup
📅 Timeframe: 1D | 💰 CMP: ₹472.75 | 📈 Volume: Above average
Technical View
Sona BLW has completed a strong impulse wave from ₹402 → ₹503, followed by a healthy pullback.
Price is now retracing near the 0.618 Fib level (₹464.8), aligning with the 21EMA — a zone that often acts as support during trend continuation.
Volume on the breakout was strong, showing accumulation interest.
Trade Plan
Entry Zone: ₹465–₹470
Stop Loss: ₹450 (below 0.5 Fib and 20EMA)
Targets:
🎯 T1: ₹503
🎯 T2: ₹530 (Fib 1.272)
🎯 T3: ₹566 (Fib 1.618)
Summary
✅ Uptrend resumption likely if ₹450 holds
✅ Rising 21EMA & 50EMA support the structure
✅ Strong breakout volume confirms institutional buying
Bias: Bullish
Risk–Reward: ~1:2.5+
Invalidation: Close below ₹450
Disclaimer : Risk management is crucial in this volatile market, so keep position sizing appropriate. This analysis is intended for educational purposes and not financial advice.
Bullish Momentum Revival Near Key Support | STWP💹 Aurobindo Pharma Ltd (NSE: AUROPHARMA)
Sector: Pharmaceuticals | CMP: ₹1,138.90 | View: Bullish Momentum Setup
📊 Price Action:
Aurobindo Pharma shows strong bullish momentum after reclaiming key support zones near ₹1,100.
The stock has printed a bullish engulfing candle with institutional-grade volume, signaling a potential continuation of the uptrend.
Price action confirms demand absorption at lower levels with buyers defending the ₹1,080–1,100 zone effectively.
💼 HNI Trade Levels (STWP Setup):
Aggressive Entry: ₹1,138.90–₹1,155.80 | Stop Loss: ₹1,087.35
Low-Risk Entry: ₹1,137.12 | Stop Loss: ₹1,080.02
The STWP HNI Setup reflects a well-defined bullish structure supported by EMA 200 crossover and strong candle confirmation.
Smart money activity is visible through expanding volume footprints and VCP contraction signs fading toward breakout.
📉 VCP Analysis:
Aurobindo Pharma has undergone 112 VCP contractions, forming a tight base before breakout attempts.
Although the current candle is yet to confirm a clean VCP breakout, the setup suggests a pre-breakout stage, aligning with institutional interest.
The ongoing contraction phase combined with a bullish RSI breakout supports accumulation by strong hands.
📈 STWP Trading Analysis:
Entry: ₹1,155.80 | Stop Loss: ₹1,098.70 | Risk: ₹57.10
The bullish structure is reinforced by a 5x volume expansion and a strong buyer-dominated candle.
EMA 200 crossover, MACD bullish alignment, and RSI strength above 52 confirm upside bias.
Holding above ₹1,120 keeps the short-term structure firmly bullish toward ₹1,177–₹1,208 levels.
📏 Fibonacci Analysis:
From the swing low of ₹1,016.10 to the recent swing high of ₹1,208.20 — price currently hovers around the 61.8% retracement zone at ₹1,134.82, a critical Fibonacci pivot.
Sustaining above this level indicates strength and supports the ongoing uptrend.
Fibonacci extensions project targets near ₹1,208–₹1,218 on breakout confirmation.
🧭 STWP Support & Resistance:
Resistances: ₹1,163.13 | ₹1,187.37 | ₹1,218.93
Supports: ₹1,107.33 | ₹1,075.77 | ₹1,051.53
The ₹1,075–₹1,107 zone serves as a strong institutional support, aligning with prior demand clusters.
Weak resistance pockets lie between ₹1,163–₹1,208, opening space for a clean momentum push if price sustains above ₹1,155.
📊 STWP Volume & Technical Setup:
Today’s volume surged to 3.56M vs 1.3M average, confirming high institutional participation.
The chart highlights multiple technical confirmations — a strong EMA crossover, momentum breakout, and volatility expansion supported by a bullish candle formation.
Key momentum oscillators are turning upward, reflecting renewed strength and sustained bullish bias across timeframes.
🧩 STWP Summary View:
Final Outlook:
Momentum: Strong | Trend: Uptrend | Risk: High| Volume: High
Aurobindo Pharma is exhibiting robust institutional footprints with trend confirmation across all major indicators.
As long as the price holds above ₹1,107–₹1,120, the structure remains intact with scope for a short-term move toward ₹1,177–₹1,208.
The bias remains bullish with uptrend continuation potential into the next few sessions.
⚠️ Disclosure & Disclaimer – Please Read Carefully
This post is shared only for educational and informational purposes. It is not a buy/sell recommendation or financial advice.
I am not a SEBI-registered investment adviser; all views are based on technical observation and public market data.
Trading involves risk. Market movements can be unpredictable and may result in losses.
Always perform your own research or consult a SEBI-registered financial advisor before trading.
Position Status: No active position in (AUROPHARMA) at the time of this analysis.
Data Source: TradingView & NSE India
💬 Found this useful?
🔼 Give this post a Boost if you value structured, professional breakdowns.
✍️ Share your thoughts or charts below — let’s learn together!
🔁 Spread this post to help more traders adopt data-driven analysis.
👉 Follow for more clean, institutional-style setups with clarity and discipline.
🚀 Stay Calm. Stay Clean. Trade With Patience.
Trade Smart | Learn Zones | Be Self-Reliant 📊

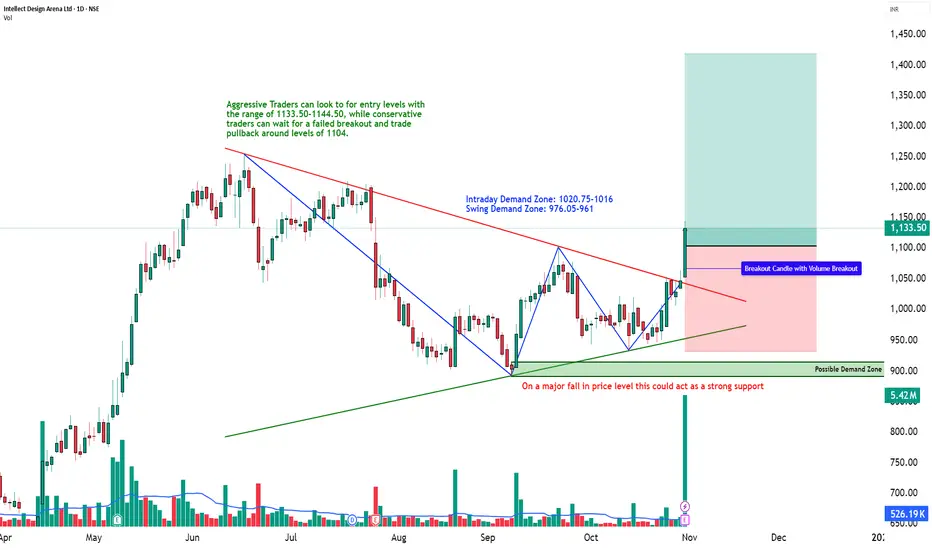
Descending Triangle Breakout with Institutional Volume | STWP💹 Intellect Design Arena Ltd (NSE: INTELLECT)
Sector: IT – FinTech Solutions | CMP: ₹1,133.50 | View: Bullish Momentum Breakout Setup
📊 Price Action:
Intellect Design Arena has delivered a strong bullish breakout from its multi-month descending trendline, marking a structural shift from a consolidation base to a clear uptrend.
The stock reversed sharply from the ₹890 swing low and confirmed momentum above the ₹1,100–₹1,120 zone with an explosive 10x volume expansion.
The wide-range bullish candle and sustained higher close suggest institutional breakout participation and trend continuation toward upper resistance zones.
💼 HNI Trade Levels (STWP Setup):
Aggressive Entry: ₹1,114.50 | Stop Loss: ₹1,044.35
Low-Risk Entry: ₹1,076.5 | Stop Loss: ₹1,019.5
HNI and institutional activity is visible through heavy delivery-based volume and strong follow-up momentum.
The bullish structure remains intact as long as price sustains above ₹1,075–₹1,080, where short-term demand has been confirmed.
📉 VCP Analysis:
Intellect displays a multi-stage Volatility Contraction Pattern (VCP) — 8 visible contractions as per the VCP dashboard.
Each contraction narrowed with decreasing volume before the final 20-day breakout candle confirmed a volatility expansion phase.
This marks the beginning of a trend acceleration stage, aligning perfectly with RSI, MACD, and Supertrend confirmations.
📈 STWP Trading Analysis:
Entry: ₹1,114.50 | Stop Loss: ₹1,044.35
The breakout candle exhibits strong momentum with 5.42M volume vs an average of 0.52M, indicating institutional footprints.
The price is now sustaining above short- and medium-term EMAs, with all major timeframes (Daily–Weekly–Monthly) confirming an uptrend alignment.
Holding above ₹1,095–₹1,075 will maintain the bullish bias, keeping momentum setups active toward ₹1,175–₹1,255 zones.
📏 Fibonacci Analysis:
From swing low ₹890.25 to swing high ₹1,255.0:
61.8% @ ₹1,115.7 → Confirmed breakout level.
78.6% @ ₹1,176.9 → Next momentum target.
100% @ ₹1,255.0 → Swing resistance.
A daily close above ₹1,116 validates the Fibonacci continuation path toward ₹1,255–₹1,285, with an extended potential to ₹1,354 (Fibo 127.2% projection).
🧭 STWP Support & Resistance:
Resistances: ₹1,167.5 | ₹1,201.5 | ₹1,255.0
Supports: ₹1,076.5 | ₹1,019.5 | ₹985.5
The ₹1,076–₹1,020 zone acts as a key accumulation pocket, while the ₹1,255 area marks a significant swing barrier.
Structure indicates strong base support with progressive higher demand, suggesting buyers remain dominant on dips.
📊 STWP Volume & Technical Setup:
Today’s session recorded 5.42M shares vs 0.52M average, a 10x volume surge, confirming institutional breakout participation.
Indicators show bullish MACD crossover, RSI momentum above 70, and Stochastic strength across all timeframes.
The breakout is also validated by Bollinger Band expansion, signaling volatility release.
Trend Direction: UPTREND | Volume Confirmation: Strong Institutional Activity
🧩 STWP Summary View:
Final Outlook:
Momentum: Strong | Trend: Bullish | Risk: High | Volume: High
Intellect Design Arena has transitioned into a confirmed bullish continuation phase with institutional footprints and multi-indicator confirmation.
Holding above ₹1,075 keeps the pattern valid for a potential rally toward ₹1,175–₹1,255 levels.
The setup remains technically clean, high-volume backed, and trend-aligned — favoring bullish bias continuation in the near term.
⚠️ Disclosure & Disclaimer – Please Read Carefully
The information shared here is meant purely for learning and awareness. It is not a buy or sell recommendation and should not be construed as investment advice.
I am not a SEBI-registered investment adviser, and this analysis is based on chart observations, technical patterns, and public data.
Trading involves risk; market movements can be sudden, and losses may exceed invested capital.
Past performance or setups do not guarantee future results.
Please evaluate your risk management and suitability before taking any trading decision.
Consult a SEBI-registered financial adviser before acting on any trade idea.
Position Status: No active position in (INTELLECT) at the time of analysis.
Data Source: TradingView & NSE India (Past Chart Reference).
💬 Found this useful?
🔼 Give this post a Boost to help more traders discover structured learning.
✍️ Drop your thoughts, queries, or setups in the comments — let’s grow together!
🔁 Share this with fellow traders and learners to promote structured analysis.
👉 “If you liked this breakdown, follow for more clean, disciplined setups with patience at the core.”
🚀 Stay Calm. Stay Clean. Trade With Patience.
Trade Smart | Learn Zones | Be Self-Reliant 📊
Aditya Birla Capital | Bullish Momentum with Exceptional Volume 💹 Aditya Birla Capital Ltd (NSE: ABCAPITAL)
Sector: Financial Services | CMP: ₹326.80 | View: Bullish Continuation Setup
📊 Price Action:
Aditya Birla Capital witnessed a bullish breakout from a tight consolidation range, confirming renewed buying interest.
Price action shows strong momentum as the stock reclaimed short-term resistance with conviction.
Sustaining above 325 can open the path toward 340–347 in the short term, supported by high-volume expansion.
💼 HNI Trade Levels (STWP Setup):
Aggressive Entry: 326.80–328.81 | Stop Loss: 310.58
Low-Risk Entry: 323.14 | Stop Loss: 305.51
HNI and institutional traders have shown clear accumulation interest backed by strong volumes.
The bullish structure with expanding range candles indicates smart money positioning early into the trend.
Momentum continuation is likely as long as price sustains above 314–316 support.
📉 VCP Analysis:
Aditya Birla Capital displays a classic Volatility Contraction Pattern, tightening across the last few weeks before the breakout.
Today’s 20-day volume breakout confirms the end of contraction and the beginning of a volatility expansion phase.
The setup indicates strong institutional intent aligning with the final stage of the VCP breakout.
📈 STWP Trading Analysis:
Entry: 328.80 | Stop Loss: 310.58
Strong bullish candle supported by a 5x surge in volume highlights aggressive participation.
The trend structure remains positive with a series of higher highs and higher lows.
Holding above 320 will keep the bias firmly bullish and validate the ongoing uptrend.
📏 Fibonacci Analysis:
The Fibonacci retracement from the recent swing low at 269.84 to swing high at 350.50 places the price near the 38.2% zone, maintaining a healthy correction within trend.
Holding above 314–316 (23.6%) keeps the pattern intact and supports trend continuation.
A breakout above 333.87 (resistance 1) could drive a move toward 347–353, aligning with the Fibonacci extension projections.
🧭 STWP Support & Resistance:
Resistances: 333.87 | 340.93 | 353.07
Supports: 314.67 | 302.53 | 295.47
While resistance zones near 333–353 may face mild supply, supports between 302–314 appear strong with institutional defense.
Major demand zones are visible near 283–295, confirming deep accumulation pockets.
The setup structure remains bullish with strong support and relatively weak resistance above 333.
📊 STWP Volume & Technical Setup:
Today’s session recorded exceptional volume at 27.94M vs 5.43M average, a 5.14x surge, confirming institutional activity.
The yellow label highlights multiple confirmations — bullish engulfing candle, RSI breakout, and Bollinger Band expansion, signaling volatility release from compression.
Indicators like MACD and Stochastic remain bullish across daily to weekly timeframes, strengthening the continuation outlook.
🧩 STWP Summary View:
Final Outlook:
Momentum: Strong | Trend: Bullish | Risk: Moderate | Volume: High
Aditya Birla Capital is showing a strong technical structure with institutional footprints, rising volumes, and momentum confirmation.
Sustaining above 320 keeps risk controlled, while a decisive move above 333 could accelerate momentum toward higher resistance zones.
The bias remains bullish with trend continuation potential in the near term.
⚠️ Disclosure & Disclaimer – Please Read Carefully
The information shared here is meant purely for learning and awareness. It is not a buy or sell recommendation and should not be taken as investment advice.
I am not a SEBI-registered investment adviser, and all views expressed are based on personal study, chart patterns, and publicly available market data.
Trading—whether in stocks or options—carries risk. Markets can move unexpectedly, and losses can sometimes exceed the money you have invested.
Past performance or past setups do not guarantee future results. Always assess your risk, position sizing, and strategy suitability before entering trades.
Consult a SEBI-registered financial adviser before making any real trading decision.
Position Status: No active position in (ABCAPITAL) at the time of analysis.
Data Source: TradingView & NSE India (Past Chart Reference)
💬 Found this useful?
🔼 Give this post a Boost to help more traders discover structured learning.
✍️ Drop your thoughts, questions, or setups in the comments — let’s grow together!
🔁 Share with fellow traders and beginners to spread awareness.
👉 “If you liked this breakdown, follow for more clean, structured setups with discipline at the core.”
🚀 Stay Calm. Stay Clean. Trade With Patience.
Trade Smart | Learn Zones | Be Self-Reliant 📊

Oil India | Bullish Breakout with Institutional Volume Surge💹 Oil India Ltd (NSE: OIL)
Sector: Energy | CMP: ₹438.05 | View: Bullish Breakout Setup
📊 Price Action:
Oil India has shown a strong bullish candle breakout after weeks of consolidation between 410–420. Buyers stepped in aggressively with volume confirmation, pushing price above the short-term resistance. A sustained close above 435 could trigger a fresh up-move toward the 450–455 zone.
HNI Trade Levels (STWP Setup):
Aggressive Entry: 434.75–436.20 | Stop Loss: 416.08
Low-Risk Entry: 432.57 | Stop Loss: 411.75
HNI and institutional buyers are showing strong accumulation interest with rising volumes. The breakout candle indicates smart money entering early into the trend. Sustained buying momentum suggests continued institutional participation ahead.
VCP Analysis:
Oil India is forming a smooth Volatility Contraction Pattern with clear price tightening in recent weeks. Volume contraction followed by today’s strong expansion indicates a potential VCP breakout stage. The surge in volume confirms institutional activity aligning with the final contraction phase breakout.
STWP Trading Analysis:
Entry: 436.20 | Stop Loss: 410.30
Strong bullish momentum with a wide-range candle backed by heavy institutional volumes. The breakout structure signals renewed trend strength with clear directional intent. Sustaining above 430 will keep the momentum in favor of buyers.
Fibonacci Analysis:
Oil India’s Fibonacci structure is plotted from the Swing Low at 384.6 to the Swing High at 491.5, capturing the recent trend wave. The stock is currently trading near the 50% retracement level at 438.05, showing a strong recovery within the ongoing uptrend. Holding above the 38.2% zone at 425.44 will keep momentum intact, while a breakout above the 61.8% level at 450.66 could extend the move toward 468–491, confirming trend continuation.
STWP Support & Resistance:
Resistances: 440.53 | 446.32 | 456.43
Supports: 424.63 | 414.52 | 408.73
While we note the above technical levels, the chart displays resistance zones at 448–456 and 478–491 as relatively weak, indicating limited selling pressure. However, supports near 392–384 and 325–350 appear strong, reflecting firm institutional demand and accumulation interest. This structure suggests a bullish bias, where sustained buying above 440 could trigger continuation momentum toward higher levels.
STWP Volume & Technical Setup:
Oil India delivered a power-packed bullish session today, marked by a strong Marubozu candle that reflected uninterrupted buying momentum from open to close. The chart’s yellow label captures a perfect storm of bullish confirmations — from exceptional volume (6.03M vs 2.48M avg, ratio 2.43x) to a Bollinger Band breakout emerging right after a compression phase, signaling fresh volatility expansion. The RSI breakout, 200 EMA crossover, and BB Squeeze trigger all align to validate institutional accumulation and trend strength. With buyer dominance clearly visible, Oil India stands poised for a momentum-driven continuation in the sessions ahead.
STWP Summary View:
Final Outlook:
Momentum: Strong | Trend: Bullish | Risk: Low | Volume: High
Oil India displays a textbook bullish setup with strong price action, expanding volume, and visible institutional activity.
A high-volume breakout from a tight base confirms trend strength and upside potential. Holding above key supports keeps risk low and the bullish momentum intact.
________________________________________
________________________________________
⚠️ Disclosure & Disclaimer – Please Read Carefully
The information shared here is meant purely for learning and awareness. It is not a buy or sell recommendation and should not be taken as investment advice. I am not a SEBI-registered investment adviser, and all views expressed are based on personal study, chart patterns, and publicly available market data.
Trading—whether in stocks or options—carries risk. Markets can move unexpectedly, and losses can sometimes exceed the money you have invested. Past performance or past setups do not guarantee future results.
If you are a beginner, treat this as a guide to understand how the market works and practice on paper trades before risking real money. If you are experienced, always assess your own risk, position sizing, and strategy suitability before entering trades.
Consult a SEBI-registered financial adviser before making any real trading decision. By engaging with this content, you acknowledge full responsibility for your trades and investments.
Position Status: No active position in (OIL) at the time of analysis.
Data Source: TradingView & NSE India (Past Chart Reference) (Historical levels)
💬 Found this useful?
🔼 Give this post a Boost to help more traders discover clean, structured learning.
✍️ Drop your thoughts, questions, or setups in the comments — let’s grow together!
🔁 Share with fellow traders and beginners to spread awareness.
👉 “If you liked this breakdown, follow for more clean, structured setups with discipline at the core.”
🚀 Stay Calm. Stay Clean. Trade With Patience.
Trade Smart | Learn Zones | Be Self-Reliant 📊

Jaicorp ltdCup handle pattern with good volume in green days,
Negative days low dry volume .
178 resistance if it break then easily move more up side
Stop loss below handle
9%

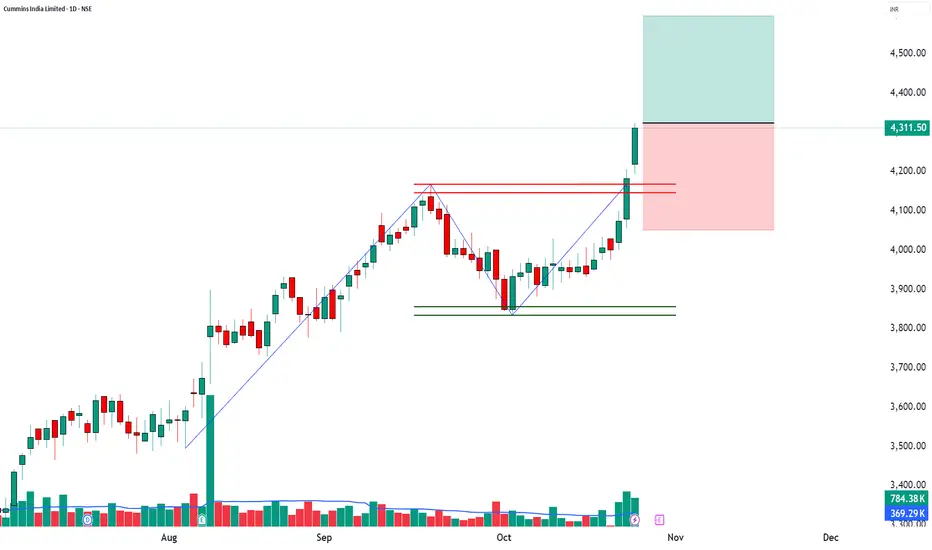
CUMMINSIND | 52-Week Breakout + Volume Expansion📈 CUMMINSIND | 52-Week Breakout + Volume Expansion + Institutional Momentum 🚀
🔹 Entry Zone: ₹4,311.50 – ₹4,324.00
🔹 Stop Loss: ₹4,051.05 (Risk ~273 pts)
🔹 Supports: 4,230 / 4,148.5 / 4,101.5
🔹 Resistances: 4,358.5 / 4,405.5 / 4,487
🔹 Swing Demand Zone: ₹4,096.70 – ₹4,060.10
🔹 Intraday Demand Zone: ₹4,086.20 – ₹4,065.00
🔑 Key Highlights
✅ 52-Week Breakout – strong bullish sentiment and trend expansion
✅ Exceptional Volume (2.12x avg) – clear institutional participation
✅ Bollinger Band Expansion – rising volatility supporting fresh rally
✅ Buy Today, Sell Tomorrow Setup – high momentum carryover expected
✅ VWAP Alignment – buyers maintaining upper hand
🎯 STWP Trade View
📊 Stock has shown powerful bullish momentum with record volume; however, post-breakout consolidation may occur near ₹4,358–₹4,405.
⚠️ The ₹4,086–₹4,065 intraday zone and ₹4,096–₹4,060 swing zone act as crucial support for momentum traders to plan re-entries.
💡 Learning Note
A 52-week breakout supported by heavy volume and VWAP strength signals potential institutional accumulation. Traders should trail profits gradually and watch for sustained volume to confirm continuation.
Final Outlook: Momentum: Moderate | Trend: Neutral | Risk: Low | Volume: High
________________________________________
________________________________________
⚠️ Disclosure & Disclaimer – Please Read Carefully
The information shared here is meant purely for learning and awareness. It is not a buy or sell recommendation and should not be taken as investment advice. I am not a SEBI-registered investment adviser, and all views expressed are based on personal study, chart patterns, and publicly available market data.
Trading—whether in stocks or options—carries risk. Markets can move unexpectedly, and losses can sometimes exceed the money you have invested. Past performance or past setups do not guarantee future results.
If you are a beginner, treat this as a guide to understand how the market works and practice on paper trades before risking real money. If you are experienced, always assess your own risk, position sizing, and strategy suitability before entering trades.
Consult a SEBI-registered financial adviser before making any real trading decision. By engaging with this content, you acknowledge full responsibility for your trades and investments.
Position Status: No active position in CUMMINSIND at the time of analysis.
Data Source: TradingView & NSE India (Past Chart Reference) (Historical levels)
💬 Found this useful?
🔼 Give this post a Boost to help more traders discover clean, structured learning.
✍️ Drop your thoughts, questions, or setups in the comments — let’s grow together!
🔁 Share with fellow traders and beginners to spread awareness.
👉 “If you liked this breakdown, follow for more clean, structured setups with discipline at the core.”
🚀 Stay Calm. Stay Clean. Trade With Patience.
Trade Smart | Learn Zones | Be Self-Reliant 📊
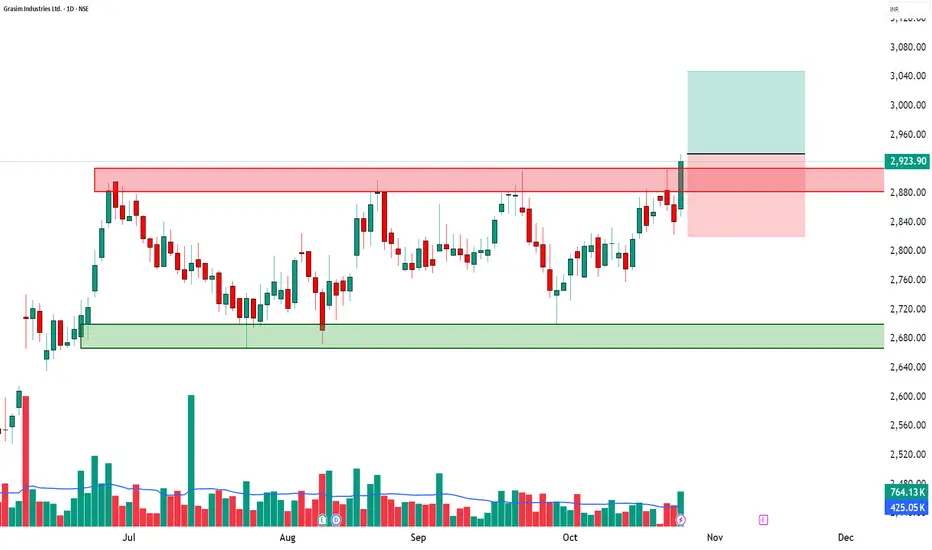
GRASIM | 52-Week Breakout + RSI Surge + High Volume📈 GRASIM | 52-Week Breakout + RSI Surge + High Volume Confirmation 🚀
🔹 Entry Zone: ₹2,923.90 – ₹2,934.00
🔹 Stop Loss: ₹2,820.45 (Risk ~113 pts)
🔹 Supports: 2,869.67 / 2,815.43 / 2,783.27
🔹 Resistances: 2,956.07 / 2,988.23 / 3,042.47
🔹 Swing Demand Zone: ₹2,787 – ₹2,764.50
🔑 Key Highlights
✅ 52-Week Breakout – strong confirmation of bullish momentum continuation
✅ RSI Breakout – trend acceleration backed by strength
✅ Bollinger Band Expansion – volatility breakout indicates fresh momentum
✅ VWAP Alignment – buyers maintaining control across sessions
✅ Volume Spike (1.8x avg) – institutional buying and strong follow-up interest
🎯 STWP Trade View
📊 Momentum favors continued bullish strength. Sustaining above ₹2,956 could extend the move toward ₹2,988–₹3,042 levels.
⚠️ The ₹2,787–₹2,764 zone acts as a key swing base where accumulation is likely to continue if prices retest.
💡 Learning Note
This setup demonstrates how a 52-week breakout with RSI and VWAP confirmation can mark a major trend continuation point. Volume expansion adds conviction, making such setups ideal for momentum-based swing trades.
Final Outlook: Momentum: Strong | Trend: Bullish | Risk: Low | Volume: High
________________________________________
________________________________________
⚠️ Disclosure & Disclaimer – Please Read Carefully
The information shared here is meant purely for learning and awareness. It is not a buy or sell recommendation and should not be taken as investment advice. I am not a SEBI-registered investment adviser, and all views expressed are based on personal study, chart patterns, and publicly available market data.
Trading—whether in stocks or options—carries risk. Markets can move unexpectedly, and losses can sometimes exceed the money you have invested. Past performance or past setups do not guarantee future results.
If you are a beginner, treat this as a guide to understand how the market works and practice on paper trades before risking real money. If you are experienced, always assess your own risk, position sizing, and strategy suitability before entering trades.
Consult a SEBI-registered financial adviser before making any real trading decision. By engaging with this content, you acknowledge full responsibility for your trades and investments.
Position Status: No active position in GRASIM at the time of analysis.
Data Source: TradingView & NSE India (Past Chart Reference) (Historical levels)
💬 Found this useful?
🔼 Give this post a Boost to help more traders discover clean, structured learning.
✍️ Drop your thoughts, questions, or setups in the comments — let’s grow together!
🔁 Share with fellow traders and beginners to spread awareness.
👉 “If you liked this breakdown, follow for more clean, structured setups with discipline at the core.”
🚀 Stay Calm. Stay Clean. Trade With Patience.
Trade Smart | Learn Zones | Be Self-Reliant 📊
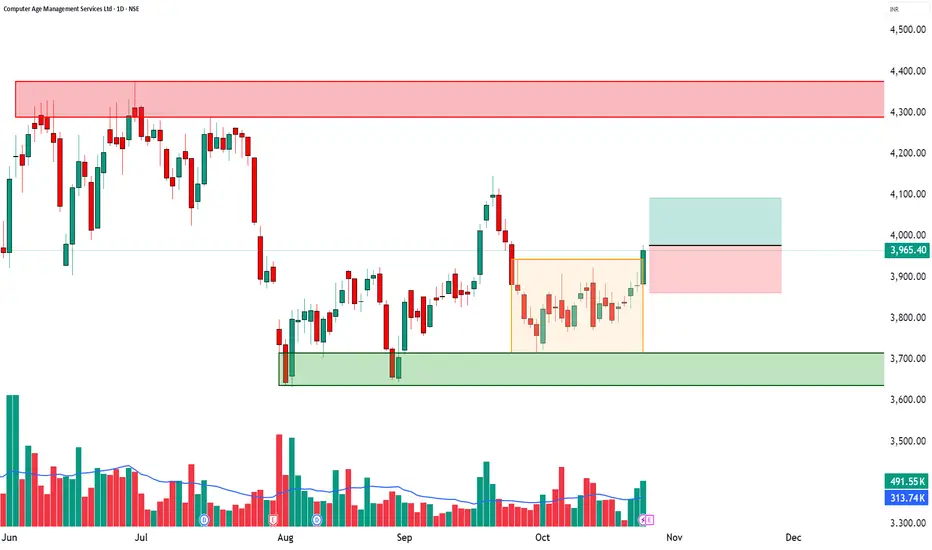
CAMS | Bullish Breakout + RSI Surge + High Volume📈 CAMS | Bullish Breakout + RSI Surge + High Volume Confirmation 🚀
🔹 Entry Zone: ₹3,965.40 – ₹3,977.80
🔹 Stop Loss: ₹3,862.45 (Risk ~115 pts)
🔹 Supports: 3,905.67 / 3,845.93 / 3,809.87
🔹 Resistances: 4,001.47 / 4,037.53 / 4,097.27
🔹 Swing Demand Zone: ₹3,815.50 – ₹3,789.90
🔹 Intraday Demand Zone: ₹3,885.70 – ₹3,877.00 | ₹3,875.90 – ₹3,868.10
🔑 Key Highlights
✅ Strong Bullish Candle – powerful continuation signal backed by strong volume
✅ RSI Breakout – confirms renewed buying momentum
✅ Bollinger Band Expansion – volatility breakout underway
✅ VWAP Alignment – sustained buyer dominance across sessions
✅ Volume Surge (1.57x avg) – active institutional participation
🎯 STWP Trade View
📊 Momentum favors a short-term bullish continuation. A close above ₹4,001 could extend the rally toward ₹4,037–₹4,097 zones.
⚠️ The ₹3,885–₹3,868 range offers intraday demand, while ₹3,815–₹3,789 serves as the swing demand base for positional traders.
💡 Learning Note
This setup combines RSI breakout + VWAP alignment + high volume — a potent trio for identifying momentum-backed bullish reversals. Traders can use intraday zones for tactical entries with clear stop placement.
Final Outlook: Momentum: Strong | Trend: Bullish | Risk: Low | Volume: High
________________________________________
________________________________________
⚠️ Disclosure & Disclaimer – Please Read Carefully
The information shared here is meant purely for learning and awareness. It is not a buy or sell recommendation and should not be taken as investment advice. I am not a SEBI-registered investment adviser, and all views expressed are based on personal study, chart patterns, and publicly available market data.
Trading—whether in stocks or options—carries risk. Markets can move unexpectedly, and losses can sometimes exceed the money you have invested. Past performance or past setups do not guarantee future results.
If you are a beginner, treat this as a guide to understand how the market works and practice on paper trades before risking real money. If you are experienced, always assess your own risk, position sizing, and strategy suitability before entering trades.
Consult a SEBI-registered financial adviser before making any real trading decision. By engaging with this content, you acknowledge full responsibility for your trades and investments.
Position Status: No active position in CAMS at the time of analysis.
Data Source: TradingView & NSE India (Past Chart Reference) (Historical levels)
💬 Found this useful?
🔼 Give this post a Boost to help more traders discover clean, structured learning.
✍️ Drop your thoughts, questions, or setups in the comments — let’s grow together!
🔁 Share with fellow traders and beginners to spread awareness.
👉 “If you liked this breakdown, follow for more clean, structured setups with discipline at the core.”
🚀 Stay Calm. Stay Clean. Trade With Patience.
Trade Smart | Learn Zones | Be Self-Reliant 📊
NUVAMA | Bullish Engulfing + VWAP Alignment📈 NUVAMA | Bullish Engulfing + VWAP Alignment + Strong Momentum Reversal 🚀
🔹 Entry Zone: ₹7,420.50 – ₹7,436.00
🔹 Stop Loss: ₹7,151.90 (Risk ~284 pts)
🔹 Supports: 7,244.33 / 7,068.17 / 6,972.33
🔹 Resistances: 7,516.33 / 7,612.17 / 7,788.33
🔹 Swing Demand Zone: ₹7,086 – ₹6,998.50
🔹 Intraday Demand Zone: ₹7,253.50 – ₹7,223
🔑 Key Highlights
✅ Bullish Engulfing Candle – powerful reversal confirmation
✅ VWAP Alignment – institutional bias turning bullish
✅ Momentum Strength – bullish follow-up after base formation
✅ Bollinger Squeeze-Off – volatility expansion expected
✅ Volume near average – healthy buyer participation, stable accumulation
🎯 STWP Trade View
📊 Strong bullish momentum supports a near-term rally toward ₹7,516–₹7,612. Sustaining above ₹7,612 could open upside potential to ₹7,788.
⚠️ The ₹7,253–₹7,223 zone provides intraday support, while ₹7,190–₹7,165 acts as a swing base for positional buyers to watch.
💡 Learning Note
This setup demonstrates how a Bullish Engulfing pattern with VWAP confirmation offers a reliable multi-signal entry. When aligned with tight demand zones, it allows traders to manage risk effectively while capitalizing on short-term breakouts.
Final Outlook: Momentum: Strong, Trend: Bullish, Risk: Low, Volume: High
________________________________________
________________________________________
⚠️ Disclosure & Disclaimer – Please Read Carefully
The information shared here is meant purely for learning and awareness. It is not a buy or sell recommendation and should not be taken as investment advice. I am not a SEBI-registered investment adviser, and all views expressed are based on personal study, chart patterns, and publicly available market data.
Trading—whether in stocks or options—carries risk. Markets can move unexpectedly, and losses can sometimes exceed the money you have invested. Past performance or past setups do not guarantee future results.
If you are a beginner, treat this as a guide to understand how the market works and practice on paper trades before risking real money. If you are experienced, always assess your own risk, position sizing, and strategy suitability before entering trades.
Consult a SEBI-registered financial adviser before making any real trading decision. By engaging with this content, you acknowledge full responsibility for your trades and investments.
Position Status: No active position in NUVAMA at the time of analysis.
Data Source: TradingView & NSE India (Past Chart Reference) (Historical levels)
💬 Found this useful?
🔼 Give this post a Boost to help more traders discover clean, structured learning.
✍️ Drop your thoughts, questions, or setups in the comments — let’s grow together!
🔁 Share with fellow traders and beginners to spread awareness.
👉 “If you liked this breakdown, follow for more clean, structured setups with discipline at the core.”
🚀 Stay Calm. Stay Clean. Trade With Patience.
Trade Smart | Learn Zones | Be Self-Reliant 📊

MCX | Strong Bullish Candle + VWAP Alignment + Swing Reversal Se📈 MCX | Strong Bullish Candle + VWAP Alignment + Swing Reversal Setup 🚀
🔹 Entry Zone: ₹9,305.50 – ₹9,335.00
🔹 Stop Loss: ₹8,962.50 (Risk ~343 pts)
🔹 Supports: 9,081 / 8,856.50 / 8,729.50
🔹 Resistances: 9,432.50 / 9,559.50 / 9,784.00
🔹 Swing Demand Zone: ₹7,880 – ₹7,725.50
🔹 Intraday Demand Zone: ₹9,052 – ₹8,975.50
🔑 Key Highlights
✅ Strong Bullish Candle signaling buyer dominance and swing reversal
✅ Bullish VWAP Alignment confirming upward control by buyers
✅ RSI improving from oversold region, supporting reversal momentum
✅ Bollinger Squeeze-Off indicating volatility expansion likely
✅ Volume near average levels – potential for fresh accumulation on breakout
🎯 STWP Trade View
📊 Momentum supports a bullish continuation if price sustains above ₹9,432. A breakout beyond ₹9,560 can extend the rally toward ₹9,784.
⚠️ The ₹9,052–₹8,975 zone offers intraday support, while ₹7,880–₹7,725 remains the long-term swing accumulation area for positional traders.
💡 Learning Note
This setup highlights how VWAP alignment with a strong bullish candle near demand zones acts as a multi-layer confirmation of trend reversal. Watching for volume pickup near resistances helps validate institutional buying strength.
Final Outlook: Momentum: Strong, Trend: Bullish, Risk: Low, Volume: High
________________________________________
________________________________________
⚠️ Disclosure & Disclaimer – Please Read Carefully
The information shared here is meant purely for learning and awareness. It is not a buy or sell recommendation and should not be taken as investment advice. I am not a SEBI-registered investment adviser, and all views expressed are based on personal study, chart patterns, and publicly available market data.
Trading—whether in stocks or options—carries risk. Markets can move unexpectedly, and losses can sometimes exceed the money you have invested. Past performance or past setups do not guarantee future results.
If you are a beginner, treat this as a guide to understand how the market works and practice on paper trades before risking real money. If you are experienced, always assess your own risk, position sizing, and strategy suitability before entering trades.
Consult a SEBI-registered financial adviser before making any real trading decision. By engaging with this content, you acknowledge full responsibility for your trades and investments.
Position Status: No active position in MCX at the time of analysis.
Data Source: TradingView & NSE India (Past Chart Reference) (Historical levels)
💬 Found this useful?
🔼 Give this post a Boost to help more traders discover clean, structured learning.
✍️ Drop your thoughts, questions, or setups in the comments — let’s grow together!
🔁 Share with fellow traders and beginners to spread awareness.
👉 “If you liked this breakdown, follow for more clean, structured setups with discipline at the core.”
🚀 Stay Calm. Stay Clean. Trade With Patience.
Trade Smart | Learn Zones | Be Self-Reliant 📊

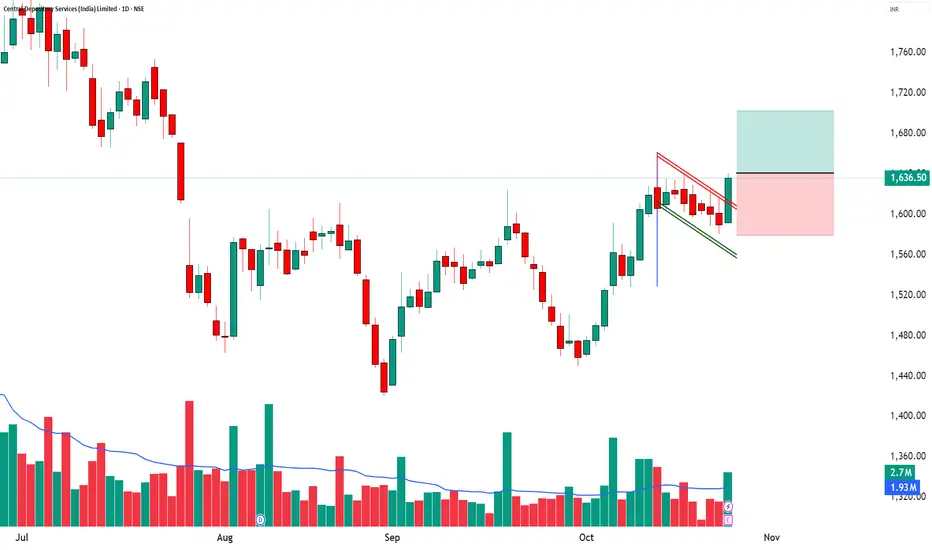
CDSL | Bullish Marubozu + RSI Breakout + Volume Expansion📈 CDSL | Bullish Marubozu + RSI Breakout + Volume Expansion 🚀
🔹 Entry Zone: ₹1,636.50 – ₹1,641.00
🔹 Stop Loss: ₹1,579.25 (Risk ~61 pts)
🔹 Supports: 1,605.33 / 1,574.17 / 1,556.33
🔹 Resistances: 1,654.33 / 1,672.17 / 1,703.33
🔹 Swing Demand Zone: ₹1,593.40 – ₹1,581.00
🔹 Intraday Demand Zone: ₹1,593.40 – ₹1,588.00
🔑 Key Highlights
✅ Bullish Marubozu Candle – clear sign of buyer dominance
✅ RSI Breakout – momentum strength confirmation
✅ Volume Surge (1.4x avg) – strong institutional participation
✅ Bollinger Squeeze-Off – breakout + volatility expansion expected
✅ VWAP Alignment – price sustaining above average buyer level
🎯 STWP Trade View
📊 Momentum supports a short-term bullish continuation. A decisive close above ₹1,654 may open the path toward ₹1,672–₹1,703.
⚠️ The ₹1,605–₹1,574 zone offers positional strength, while ₹1,593–₹1,588 acts as an intraday demand pocket for re-entry or dip-buying opportunities.
💡 Learning Note
This setup shows how combining price action (Marubozu) with RSI breakout and volume confirmation enhances conviction. Identifying multi-timeframe demand zones allows traders to plan entries with better precision and controlled risk.
Final Outlook: Momentum: Strong, Trend: Bullish, Risk: Low, Volume: High
________________________________________
________________________________________
⚠️ Disclosure & Disclaimer – Please Read Carefully
The information shared here is meant purely for learning and awareness. It is not a buy or sell recommendation and should not be taken as investment advice. I am not a SEBI-registered investment adviser, and all views expressed are based on personal study, chart patterns, and publicly available market data.
Trading—whether in stocks or options—carries risk. Markets can move unexpectedly, and losses can sometimes exceed the money you have invested. Past performance or past setups do not guarantee future results.
If you are a beginner, treat this as a guide to understand how the market works and practice on paper trades before risking real money. If you are experienced, always assess your own risk, position sizing, and strategy suitability before entering trades.
Consult a SEBI-registered financial adviser before making any real trading decision. By engaging with this content, you acknowledge full responsibility for your trades and investments.
Position Status: No active position in CDSL at the time of analysis.
Data Source: TradingView & NSE India (Past Chart Reference) (Historical levels)
💬 Found this useful?
🔼 Give this post a Boost to help more traders discover clean, structured learning.
✍️ Drop your thoughts, questions, or setups in the comments — let’s grow together!
🔁 Share with fellow traders and beginners to spread awareness.
👉 “If you liked this breakdown, follow for more clean, structured setups with discipline at the core.”
🚀 Stay Calm. Stay Clean. Trade With Patience.
Trade Smart | Learn Zones | Be Self-Reliant 📊
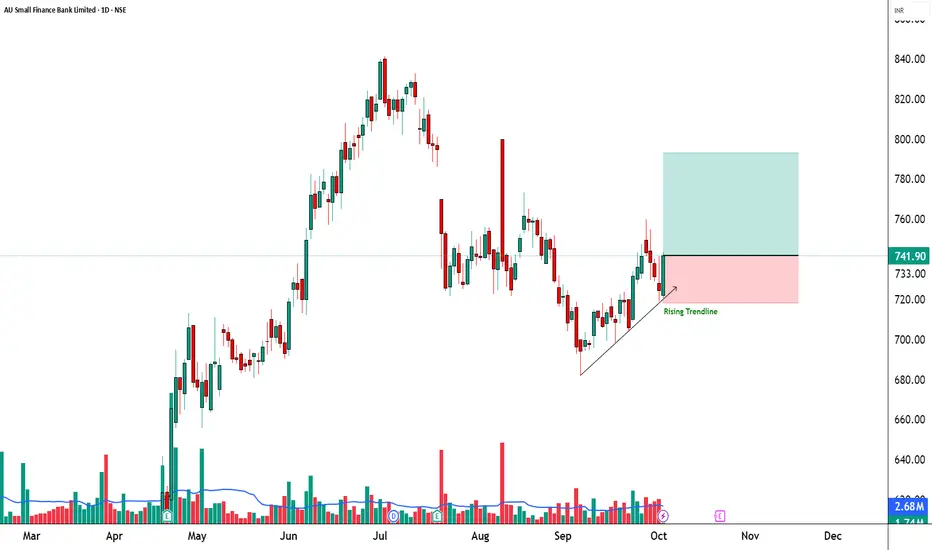
AUBANK - Bullish Engulfing + EMA50 Breakout = Power Rally Setup________________________________________
📈 AU Small Finance Bank | Bullish Engulfing + EMA50 Breakout 🚀
🔹 Entry Zone: ₹741.90 – ₹743.70
🔹 Stop Loss: ₹718.20 (Risk ~23 pts)
🔹 Supports: 727.17 / 712.43 / 704.17
🔹 Resistances: 750.17 / 758.43 / 773.17
________________________________________
🔑 Key Highlights
✅ Strong Bullish Candle – Engulfing pattern confirming reversal power
✅ EMA50 Breakout – trend shift signal
✅ Bullish VWAP Alignment – institutional buying confirmation
✅ Bollinger Squeeze-Off → breakout & volatility expansion expected
________________________________________
🎯 STWP Trade View
📊 Momentum indicates short-term bullish rally. A close above ₹750 may trigger an extended upside towards ₹758–773.
⚠️ Supports at ₹727 & ₹712 are important for trade protection.
________________________________________
💡 Learning Note
This setup demonstrates how a Bullish Engulfing pattern combined with EMA breakout + VWAP alignment can act as a multi-signal confirmation for a trend reversal.
________________________________________
⚠️ Disclosure & Disclaimer – Please Read Carefully
The information shared here is meant purely for learning and awareness. It is not a buy or sell recommendation and should not be taken as investment advice. I am not a SEBI-registered investment adviser, and all views expressed are based on personal study, chart patterns, and publicly available market data.
Trading—whether in stocks or options—carries risk. Markets can move unexpectedly, and losses can sometimes exceed the money you have invested. Past performance or past setups do not guarantee future results.
If you are a beginner, treat this as a guide to understand how the market works and practice on paper trades before risking real money. If you are experienced, always assess your own risk, position sizing, and strategy suitability before entering trades.
Consult a SEBI-registered financial adviser before making any real trading decision. By engaging with this content, you acknowledge full responsibility for your trades and investments.
💬 Found this useful?
🔼 Give this post a Boost to help more traders discover clean, structured learning.
✍️ Drop your thoughts, questions, or setups in the comments — let’s grow together!
🔁 Share with fellow traders and beginners to spread awareness.
👉 “If you liked this breakdown, follow for more clean, structured setups with discipline at the core.”
🚀 Stay Calm. Stay Clean. Trade With Patience.
Trade Smart | Learn Zones | Be Self-Reliant 📊
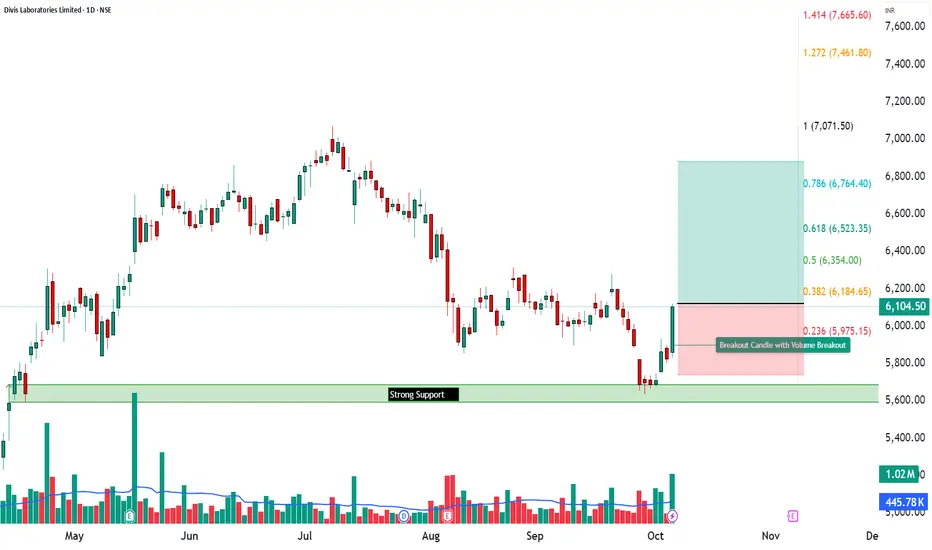
DIVISLAB - Bullish Momentum + RSI & MACD Breakout📈 Divis Laboratories Ltd | Bullish Momentum + RSI & MACD Breakout 🚀
🔹 Entry Zone: ₹6,100 – ₹6,120
🔹 Stop Loss: ₹5,739.80 (Risk ~₹380 pts)
🔹 Supports: 5,917.33 / 5,730.17 / 5,628.83
🔹 Resistances: 6,205.83 / 6,307.17 / 6,494.33
________________________________________
🔑 Key Highlights
✅ Strong Bullish Candle – powerful reversal from key support zone
✅ RSI Breakout – momentum confirmation after prolonged base
✅ MACD Crossover – positive trend shift visible
✅ Bullish SuperTrend + VWAP Alignment – institutional momentum confirmation
✅ BB Squeeze-Off → volatility expansion expected
________________________________________
🎯 STWP Trade View
📊 Momentum suggests a short-term bullish rally is in play.
A close above ₹6,200 may open further upside toward ₹6,307 – ₹6,494.
⚠️ Supports at ₹5,917 & ₹5,730 act as crucial protection zones.
Volume spike confirms fresh long build-up — a classic “Buy Today, Sell Tomorrow” setup.
________________________________________
💡 Learning Note
This setup beautifully showcases how combining RSI Breakout + MACD Crossover + VWAP alignment strengthens a momentum-based reversal.
When such signals converge near Fibonacci supports, they offer high-probability swing setups with strong follow-through potential.
________________________________________
⚠️ Disclosure & Disclaimer – Please Read Carefully
The information shared here is purely for learning and awareness purposes.
It is not a buy or sell recommendation and should not be treated as investment advice.
I am not a SEBI-registered investment adviser — all observations are based on personal chart study and publicly available data.
Trading involves risk — markets can move unexpectedly, and losses can exceed invested amounts.
Past setups or patterns do not guarantee future outcomes.
If you’re a beginner, treat this content as a learning reference and start with paper trades.
If you’re experienced, align setups with your own risk and position sizing strategy.
Always consult a SEBI-registered advisor before executing any trades.
By engaging with this content, you accept full responsibility for your actions.
________________________________________
💬 Found this useful?
🔼 Give this post a Boost to help more traders learn structured setups
💬 Drop your thoughts or chart views below — let’s grow together
🔁 Share with fellow traders who love clean, data-backed analysis
👉 “If you liked this breakdown, follow for more disciplined, structured setups.”
🚀 Stay Calm. Stay Clean. Trade With Patience.
Trade Smart | Learn Zones | Be Self-Reliant 📊
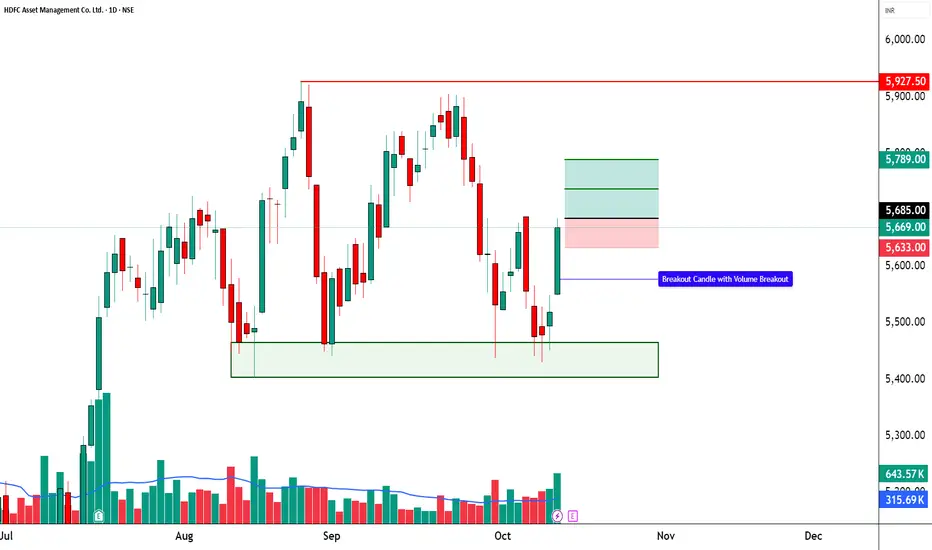
HDFC AMC LTD | Bullish Momentum + Possible Breakout📈 HDFC AMC LTD | Bullish Momentum + Possible Breakout 🚀
🔹 Bullish Breakout Zone: 5,660 – 5,685
🔹 Stop Loss: 5,633 (Risk ~₹52)
🔹 Supports: 5,584 / 5,499 / 5,448
🔹 Resistances: 5,719 / 5,770 / 5,855
🔑 Key Highlights
HDFC AMC has formed a strong bullish candle with a notable volume surge, clearly confirming aggressive buying interest. The RSI breakout signals a shift in momentum after a prolonged consolidation phase, indicating that the stock is gaining renewed strength. Additionally, a Bollinger Band Squeeze-Off pattern is visible, suggesting a potential volatility expansion and a short-term breakout on the upside. The spike in trading volume further reinforces the bullish sentiment, hinting at possible institutional participation behind this move.
🎯 STWP Trade View
📊 Price has reclaimed control above near-term resistances with improving momentum.
A sustained close above ₹5,719 can trigger a move toward ₹5,770–₹5,855 levels in the short term.
Pullbacks toward ₹5,640–₹5,660 may offer favorable entry zones with tight risk control.
⚠️ Supports at ₹5,584 and ₹5,499 remain crucial for maintaining the swing structure and protecting positions.
________________________________________
📊 Final Outlook
Momentum: 🔥 Strong
Trend: 📉 Bearish (but reversing)
Risk: 🟢 Low
Volume: 📈 High
________________________________________
💡 Learning Note
This setup demonstrates the power of confluence — RSI breakout + BB squeeze + volume surge.
Such multi-signal alignments often mark the start of a momentum phase, offering early entry opportunities before a confirmed breakout rally.
________________________________________
________________________________________
⚠️ Disclosure & Disclaimer – Please Read Carefully
The information shared here is meant purely for learning and awareness. It is not a buy or sell recommendation and should not be taken as investment advice. I am not a SEBI-registered investment adviser, and all views expressed are based on personal study, chart patterns, and publicly available market data.
Trading—whether in stocks or options—carries risk. Markets can move unexpectedly, and losses can sometimes exceed the money you have invested. Past performance or past setups do not guarantee future results.
If you are a beginner, treat this as a guide to understand how the market works and practice on paper trades before risking real money. If you are experienced, always assess your own risk, position sizing, and strategy suitability before entering trades.
Consult a SEBI-registered financial adviser before making any real trading decision. By engaging with this content, you acknowledge full responsibility for your trades and investments.
Position Status: No active position in HDFCAMC at the time of analysis.
Data Source: TradingView & NSE India (Past Chart Reference) (Historical levels)
💬 Found this useful?
🔼 Give this post a Boost to help more traders discover clean, structured learning.
✍️ Drop your thoughts, questions, or setups in the comments — let’s grow together!
🔁 Share with fellow traders and beginners to spread awareness.
👉 “If you liked this breakdown, follow for more clean, structured setups with discipline at the core.”
🚀 Stay Calm. Stay Clean. Trade With Patience.
Trade Smart | Learn Zones | Be Self-Reliant 📊
Trading Volume Spiking: Understanding Market Dynamics1. Causes of Trading Volume Spikes
Trading volume spikes are generally triggered by market-moving events, investor psychology, or technical market dynamics. These causes can be grouped into several categories:
a) Fundamental News Events
Fundamental news is one of the primary reasons for sudden spikes in trading volume. Market participants react to new information about a company, industry, or economy, leading to increased buying and selling activity. Key examples include:
Earnings Reports: When a publicly traded company releases quarterly or annual earnings, deviations from market expectations can trigger heavy trading. A strong earnings beat may cause buying volume to surge, while disappointing earnings can provoke panic selling.
Corporate Announcements: Mergers, acquisitions, dividends, or stock splits can trigger spikes as traders adjust positions based on anticipated impacts.
Economic Data Releases: Broader economic indicators such as unemployment rates, GDP growth, or inflation numbers can impact trading volume across sectors.
Policy Changes: Central bank rate announcements, government regulations, or geopolitical developments can also induce sudden spikes.
b) Technical Triggers
Many traders rely on technical analysis, using charts, indicators, and historical price patterns to make decisions. Certain price movements or indicator signals often trigger high-volume trades:
Breakouts and Breakdowns: When the price breaks through significant resistance or support levels, it often triggers a rush of orders from both retail and institutional traders.
Moving Averages and Indicators: Crossing key technical levels, such as the 50-day or 200-day moving average, can prompt automated or algorithmic trading to enter or exit positions.
Volume Confirmation Signals: Traders often look for volume spikes as confirmation of trend strength. A price move accompanied by unusually high volume is considered more reliable.
c) Market Sentiment and Psychology
Human behavior plays a large role in volume spikes. Fear, greed, and herd behavior can amplify trading activity:
Panic Selling or Buying Frenzy: Market participants may act collectively during periods of fear or exuberance, creating sudden surges in volume.
Speculation and Rumors: Even unverified news or market rumors can prompt significant spikes, as traders try to capitalize on potential opportunities.
d) Algorithmic and High-Frequency Trading
Modern markets are heavily influenced by algorithmic trading, which can amplify volume spikes. High-frequency trading (HFT) algorithms react in milliseconds to market signals, leading to bursts of buying or selling activity that may not reflect fundamental changes.
2. Interpreting Trading Volume Spikes
Volume spikes are not merely numerical anomalies; they carry deep implications for market participants. Understanding what a volume spike signifies is crucial for strategy development.
a) Confirmation of Price Movement
A spike in volume often confirms the strength of a price movement. For example:
A price surge with high volume indicates strong buying interest, suggesting the uptrend may continue.
Conversely, a price drop with high volume reflects strong selling pressure and can indicate a genuine downtrend.
Without significant volume, price movements may lack conviction and can be more prone to reversals.
b) Potential Trend Reversals
While high volume can confirm trends, extreme spikes can sometimes indicate trend exhaustion:
A rapid surge in volume after a prolonged price move may suggest that the market is overextended.
In some cases, this leads to a reversal, as traders take profits and new participants step in to bet against the trend.
c) Liquidity Insights
Volume spikes provide insight into market liquidity:
Higher volume generally improves liquidity, allowing larger trades to execute without significant price slippage.
Low volume during a spike, however, may indicate market thinness and volatility, making it riskier to trade large positions.
d) Institutional Activity
Unusually high volume often reflects institutional participation, such as hedge funds, mutual funds, or pension funds entering or exiting positions. These large trades can significantly influence price levels, especially in less liquid stocks.
3. Strategies for Traders During Volume Spikes
Traders and investors can use volume spikes strategically. Here are key approaches:
a) Momentum Trading
Momentum traders thrive on high-volume moves. A sudden increase in volume coupled with a breakout or breakdown can signal a strong directional trade opportunity. Traders often enter in the direction of the volume surge, expecting follow-through.
b) Volume-Based Confirmation
Technical analysts often use volume spikes as confirmation tools. For example:
Breakout Confirmation: A breakout above resistance accompanied by higher-than-average volume is more likely to sustain.
Trend Validation: Sustained trends confirmed by rising volume tend to be stronger and more reliable.
c) Contrarian Approach
Contrarian traders may interpret extreme volume spikes as signals of market exhaustion. After intense buying or selling, the market may be ripe for a pullback. This approach requires careful risk management.
d) Risk Management Adjustments
Volume spikes often coincide with higher volatility. Traders should adjust stop-loss levels, position sizes, and entry points to accommodate rapid price swings. Ignoring volume-related risk can result in significant losses.
4. Tools and Indicators for Monitoring Volume Spikes
Modern trading platforms provide a range of volume indicators to detect spikes and guide decisions:
Volume Bars: Basic histogram bars show volume per period and highlight anomalies relative to average volume.
On-Balance Volume (OBV): OBV measures cumulative buying and selling pressure, helping identify accumulation or distribution trends.
Volume Moving Averages: Traders often compare current volume against a 10-day or 20-day average to spot unusual spikes.
Volume-Price Trend (VPT): VPT combines volume and price changes to assess whether volume supports the direction of the trend.
These tools help traders distinguish between meaningful volume spikes and random market noise.
5. Case Studies of Trading Volume Spikes
Historical examples illustrate the significance of volume spikes:
Tech Stocks during Earnings Season: Companies like Apple or Microsoft often experience 3–5x average daily volume on earnings days, reflecting investor reaction to profits, guidance, or product announcements.
Market Crashes: During the 2020 COVID-19 market crash, trading volumes surged as investors panicked, providing liquidity but also amplifying volatility.
Cryptocurrency Market Events: Cryptocurrencies like Bitcoin often experience volume spikes during regulatory news or large institutional trades, resulting in rapid price swings.
6. Potential Pitfalls and Misinterpretations
While volume spikes are useful, traders must avoid over-reliance:
False Signals: Not all spikes indicate a trend continuation; some are caused by short-term speculative activity.
Thin Markets: Volume spikes in low-liquidity markets can exaggerate price moves and mislead traders.
Algorithmic Distortions: HFT can generate temporary spikes without any fundamental significance.
Proper analysis requires combining volume with other indicators such as price action, moving averages, and market news.
7. Conclusion
A trading volume spike is a key market signal reflecting a surge in trading activity, often triggered by fundamental events, technical movements, market sentiment, or institutional participation. For traders, volume spikes provide vital insights into the strength, liquidity, and sustainability of price movements. High volume confirms trends, signals potential reversals, and highlights institutional activity. However, spikes also bring risks due to higher volatility and potential market noise.
By integrating volume analysis into trading strategies, using technical indicators, and monitoring market news, traders can make more informed, strategic decisions. Whether you are a momentum trader, contrarian investor, or risk-conscious portfolio manager, understanding volume spikes is essential for navigating modern financial markets effectively.
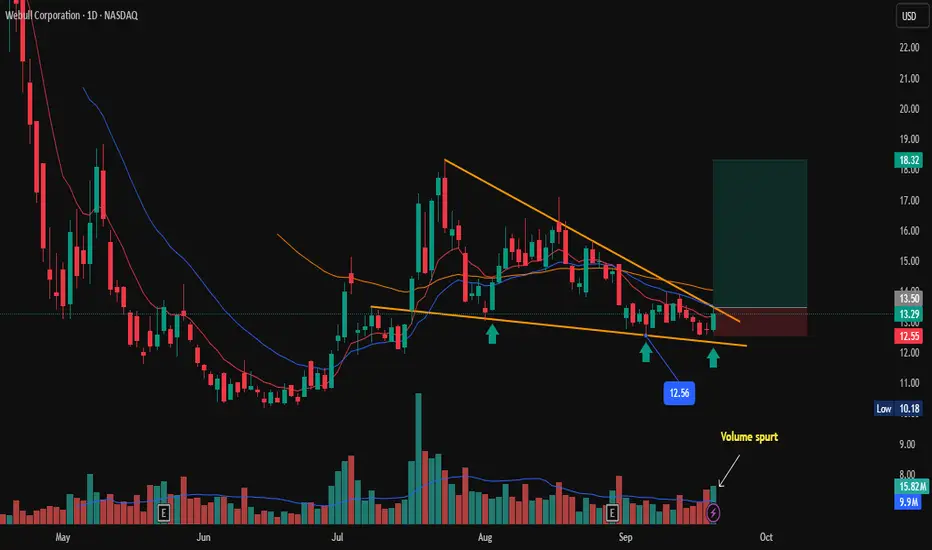
NASDAQ: Webbull Corporation - Long Setup, Reversal SignWebbull Corporation shows signs of a potential long opportunity after forming a Bullish reversal pattern (falling wedge) on the daily chart. Price respecting a trendline, and Volume spurt on last trading session. signaling Bullish momentum. hinting at a possible uptrend initiation.
Key Levels to Watch:
Immediate support at $12.56 (immediate low)
Trade Plan:
Enter long above $13.50 on confirmation of bullish candle close.
Stop loss above $12.60 to limit risk.
Target $18.00 as per falling wedge rule, or trail stop as price moves above.
Disclaimer : Risk management is crucial. so keep position sizing appropriate. This analysis is intended for educational purposes and not financial advice.
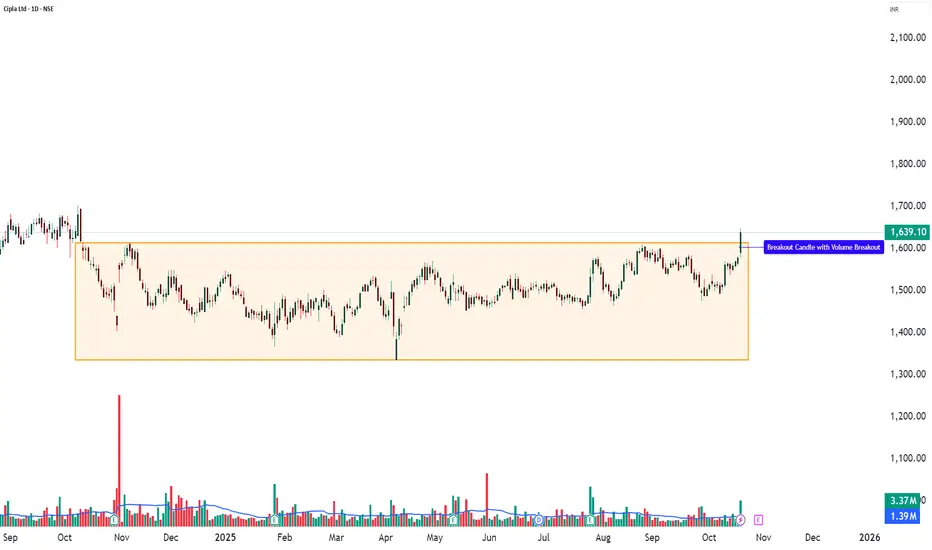
CIPLA – 10-Day Volume Breakout | Bullish Continuation Setup💹 Cipla Ltd (NSE: CIPLA)
Sector: Pharmaceuticals | CMP: ₹1,639.10 | View: Bullish Continuation Setup
🔹 Technical Analysis / Chart Pattern / Price Action / Volume Analysis:
Cipla Ltd shows strong bullish momentum with a clear breakout candle supported by a significant volume surge of 3,372,906 shares, compared to its 20-day average of 1,386,709 shares — a rise of over 2.4 times. This confirms fresh institutional buying and genuine participation behind the move. The open-equals-low formation reflects strong buyer control from the start, while a Bollinger Band breakout with a BB squeeze-off signals that volatility compression has ended, hinting at a sharp upward continuation. The RSI breakout further supports growing momentum, and consistent volume expansion validates trend strength. Overall, the setup represents a bullish continuation structure, where price, volume, and momentum align perfectly — a textbook example of a powerful breakout phase supported by conviction buying.
🔹 Key Levels:
Resistance: 1665 / 1690 / 1733
Support: 1566 / 1537 / 1498
🔹 STWP Trade Analysis:
Bias: Bullish
Breakout Level: 1647
Intraday Support: 1620
Swing Support: 1553
Intermediate Support: 1535
🔹 HNI Trade Analysis:
Possible Accumulation Level: 1639 - 1647
Possible Low Levels: 1629
Support Levels: 1624 - 1606
🔹 Final Outlook:
Momentum: Moderate | Trend: Neutral | Risk: Low | Volume: High
🔹 Learning Note (Educational Purpose):
This setup is a great example of how a breakout with strong volume and RSI confirmation can signal a shift from consolidation to momentum. It helps learners understand that when price, volume, and indicators align together, it often leads to a trend continuation phase. Always observe how volume expands during breakouts — it’s one of the strongest clues of institutional activity.
🔹 STWP Mentor Note:
A clean breakout backed by strong volume is not just a signal — it’s a lesson in patience and timing. Smart traders wait for clarity, not noise. As a learner, focus on identifying structure, strength, and sustainability in every move. Remember, every breakout teaches discipline — stay consistent, study reactions, and always trade with patience and purpose.
───────────────────────────────────────────────
⚠️ **DISCLOSURE & DISCLAIMER (SEBI-Compliant)**
───────────────────────────────────────────────
📘 **Purpose:**
This content is created **solely for educational and informational purposes** to help readers understand market structure, price action, and technical analysis.
It does **not constitute investment advice**, research recommendation, or a solicitation to buy or sell any security.
👤 **Author Disclosure:**
The author is **not a SEBI-registered investment adviser or research analyst.**
All chart studies, price levels, and observations are based on publicly available data (e.g., **NSE India**, **TradingView**) and are presented purely for **learning illustration**.
📊 **Position Status:**
No active position in * * at the time of publication.
“The author may sometimes trade in the securities discussed, but such trades are independent and shared here only for educational understanding.”
⚠️ **Risk Disclosure:**
Trading and investing involve financial risk. Market movements can be unpredictable, and losses may exceed invested capital.
Readers are strongly advised to consult a **SEBI-registered investment adviser** before making any trading or investment decisions.
🧠 **Responsibility Clause:**
By engaging with this post, you acknowledge that you are **solely responsible for your own trading or investment decisions**, and that this content is intended only for **market education and awareness**.
───────────────────────────────────────────────
💬 **Did You Find This Useful?**
If this analysis helped you understand price structure or market psychology better:
🔼 **Boost** to support transparent & structured financial education.
✍️ **Comment** your insights, observations, or questions — let’s learn together.
🔁 **Share** this post with learners and aspiring traders who value discipline.
📚 **Follow stwp** for more structured, educational breakdowns on stocks & setups.
🚀 *Stay Calm. Stay Clean. Trade With Patience.*
💡 *Trade Smart | Learn Zones | Be Self-Reliant.*
───────────────────────────────────────────────
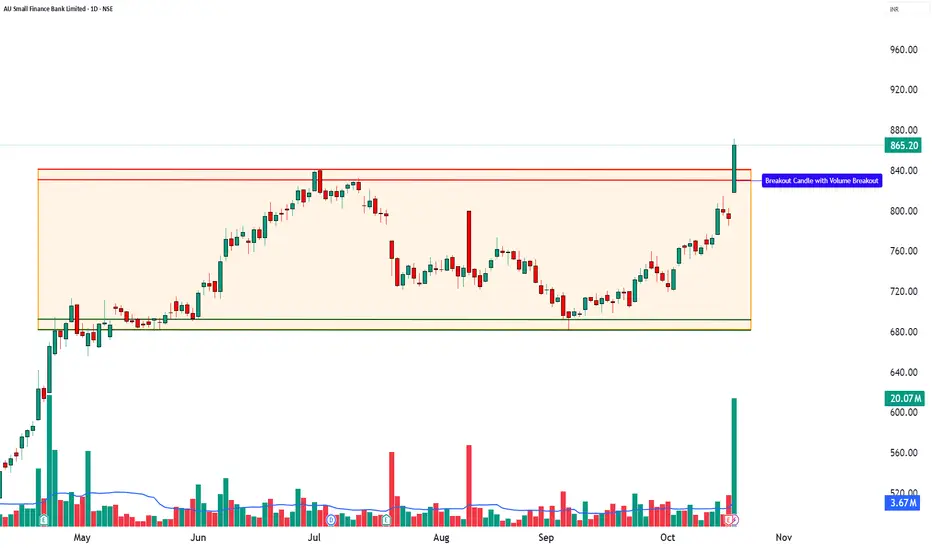
AUBANK – 52-Week Breakout with Strong Volume💹 A.U. Small Finance Bank Ltd (NSE: AUBANK)
Sector: Banking & Finance | CMP: ₹865.20 | View: Bullish Momentum Setup
🔹Price Action:
A.U. Small Finance Bank showed strong upward movement with a big green candle and very high trading volume. The stock opened at its lowest point and kept rising all day, which means buyers were in full control. It also made a new 52-week high, showing that momentum and confidence are strong. In simple words, the stock is breaking out with power, and buyers are clearly leading the trend.
🔹 Technical Analysis:
AUBANK is showing strong bullish momentum with a clear 52-week breakout, signaling fresh buying interest and strong confidence among traders. The big green candle with open-equals-low formation shows that buyers were active right from the start of the session. The RSI at 81 reflects strong momentum, while MACD at 9.35 confirms a positive crossover, adding to the bullish view. Similarly, CCI at 258 and Stochastic at 96 indicate powerful buying pressure, suggesting that the uptrend is well-supported. The VWAP at ₹855.39 is acting as an important support level, helping the price stay stable even during intraday pullbacks. Meanwhile, a Bollinger Band breakout and a BB squeeze-off pattern hint that the stock may continue its sharp upward move. Altogether, the indicators show a well-supported bullish setup, ideal for short to medium-term swing trades.
🔹 Volume Analysis:
The stock saw a huge rise in trading volume — almost 5 times higher than normal! This is a strong sign that big investors or institutions are showing interest. Such a jump in both price and volume means the breakout is real and reliable, not just a short-term move. This kind of volume confirms fresh buying and positive sentiment, suggesting the stock could stay strong for some time.
🔹 Chart Analysis:
For months, AUBANK was moving sideways between ₹680 and ₹840. Now, it has broken above ₹840 with heavy volume, showing that the stock has ended its consolidation phase and started a new bullish trend. This breakout shows that buyers are taking charge, and if the volume remains high, the stock may continue to move upward in the coming sessions.
🔹 Demand Zone: ₹814 – ₹785
This area acts as a strong demand zone, where earlier buying interest was visible. If the price revisits this zone, it may attract fresh accumulation or renewed buying activity. Traders and learners can observe this region for potential re-entry setups once the price shows signs of stability or reversal — purely for educational understanding of demand zone behavior in momentum setups.
🔹 Key Levels:
Resistance: 885/905/939
Support: 832/798/778
🔹 STWP Trade Analysis:
Bias: Bullish
Breakout Level: 872
Intraday Support: 851
Swing Support: 783
Intermediate Support: 680
Observation:
🔹 Final Outlook:
Momentum: Moderate | Trend: Neutral | Risk: High | Volume: High
The setup shows strong bullish signs but comes after a sharp rally, so short-term volatility can be expected. Sustained volume above ₹850 will keep the trend positive.
🔹 Learning Note (Educational Purpose):
This setup is a good example of how volume + breakout candles signal a shift in momentum. It teaches traders that when price breaks resistance with strong volume, it often marks the beginning of a new trend rather than the end of one. Always confirm with RSI/MACD alignment for reliability.
🔹 STWP Mentor Note:
Momentum trading works best when price, structure, and volume align together. Always look for clean breakouts backed by heavy volume — they tell you where smart money is moving. As a trader, focus more on learning price behavior than just chasing the move. Every breakout teaches patience, confidence, and timing — three pillars of successful trading.
───────────────────────────────────────────────
⚠️ **DISCLOSURE & DISCLAIMER (SEBI-Compliant)**
───────────────────────────────────────────────
📘 **Purpose:**
This content is created **solely for educational and informational purposes** to help readers understand market structure, price action, and technical analysis.
It does **not constitute investment advice**, research recommendation, or a solicitation to buy or sell any security.
👤 **Author Disclosure:**
The author is **not a SEBI-registered investment adviser or research analyst.**
All chart studies, price levels, and observations are based on publicly available data (e.g., **NSE India**, **TradingView**) and are presented purely for **learning illustration**.
📊 **Position Status:**
No active position in * * at the time of publication.
“The author may sometimes trade in the securities discussed, but such trades are independent and shared here only for educational understanding.”
⚠️ **Risk Disclosure:**
Trading and investing involve financial risk. Market movements can be unpredictable, and losses may exceed invested capital.
Readers are strongly advised to consult a **SEBI-registered investment adviser** before making any trading or investment decisions.
🧠 **Responsibility Clause:**
By engaging with this post, you acknowledge that you are **solely responsible for your own trading or investment decisions**, and that this content is intended only for **market education and awareness**.
───────────────────────────────────────────────
💬 **Did You Find This Useful?**
If this analysis helped you understand price structure or market psychology better:
🔼 **Boost** to support transparent & structured financial education.
✍️ **Comment** your insights, observations, or questions — let’s learn together.
🔁 **Share** this post with learners and aspiring traders who value discipline.
📚 **Follow STWP** for more structured, educational breakdowns on stocks & setups.
🚀 *Stay Calm. Stay Clean. Trade With Patience.*
💡 *Trade Smart | Learn Zones | Be Self-Reliant.*
───────────────────────────────────────────────