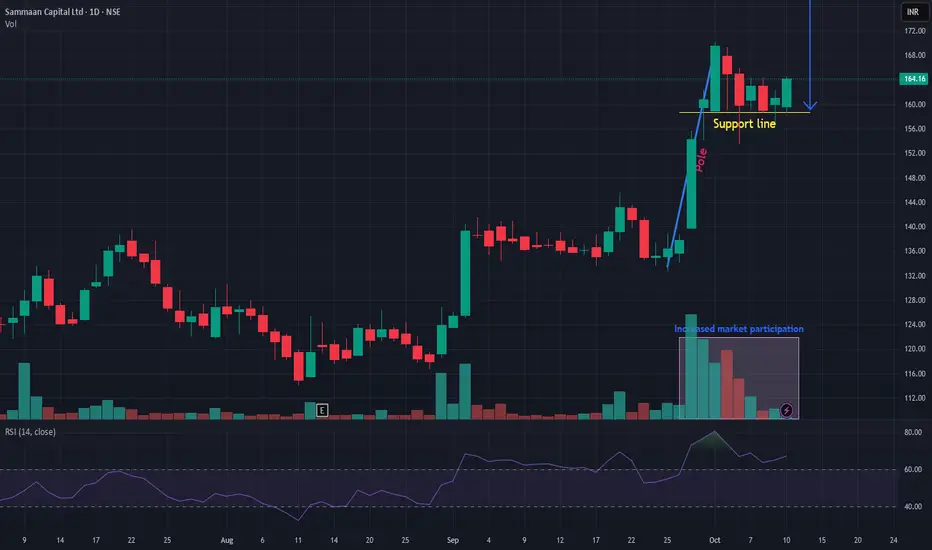
SAMMAANCAP SAMMAANCAP is showing very good strength and currently available at low risk. Forming VCP pattern. Seems like currently facing from sideways and may come out of the range and will take a new ride above resistance line. Risk-reward quite in favor. Keep it in a watchlist.
Volumeanalysis
Waree Renewable Technologies Ltd: Chart ObservationThe daily chart for Waree Renewable Technologies Ltd (NSE) highlights a period of price consolidation over 59 trading sessions (86 days), during which approximately 55.75 million shares were traded. The stock has displayed movement within a defined range, bounded by a long-term trendline resistance and an ascending support line, forming a narrowing price channel.
Trendlines: A descending resistance line has guided price limitations, while an ascending support line maintained the base
Volatility: Periods of expansion and contraction in daily price bars reflect shifting volatility and trading sentiment
Volume Analysis: The consolidation phase saw steady volume with periodic surges
This setup provides a useful illustration of how price compressions and trends appear on technical charts, helping learners recognize phases of accumulation, resistance, and support.
Disclaimer: This post is intended for educational purposes only and does not constitute investment advice. Markets are subject to risk and unpredictable movements; investors should consult financial advisors and perform their own research before making any investing decisions.

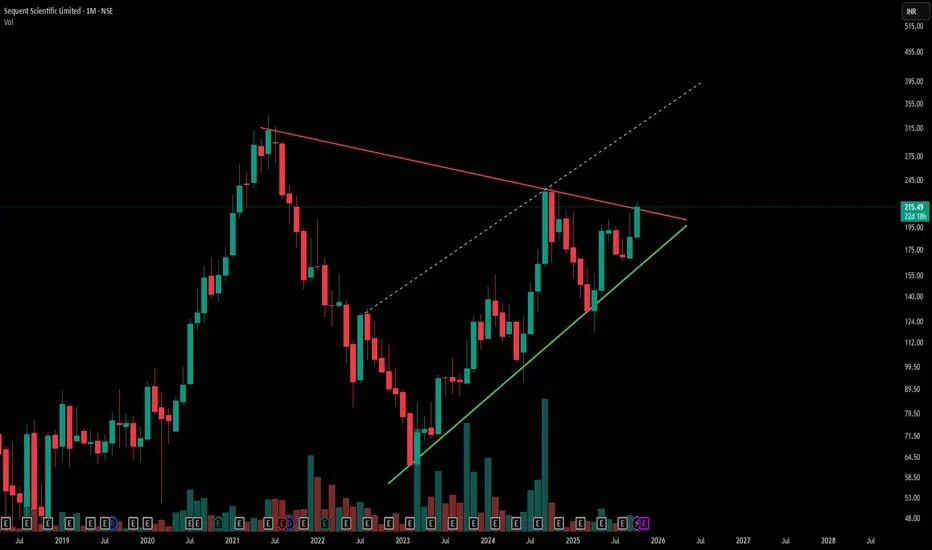
Symmetrical Triangle Breakout Watch | Sequent Scientific-Red line marks a key counter trendline (resistance) from previous swing highs, acting as a short-term ceiling.
-Green line indicates the primary trendline (support) from recent swing lows, showing steady price strength.
-Hidden dashed lines reveal underlying resistance zones, adding complexity to potential breakout levels.
-The overall chart displays a large symmetrical triangle pattern—a classic consolidation setup, Simple .
- Disclaimer: Trading involves significant risk and is not suitable for all investors. Past performance does not guarantee future results. Always conduct your own research, consider seeking advice from a qualified financial advisor, and trade only with capital you can afford to lose.
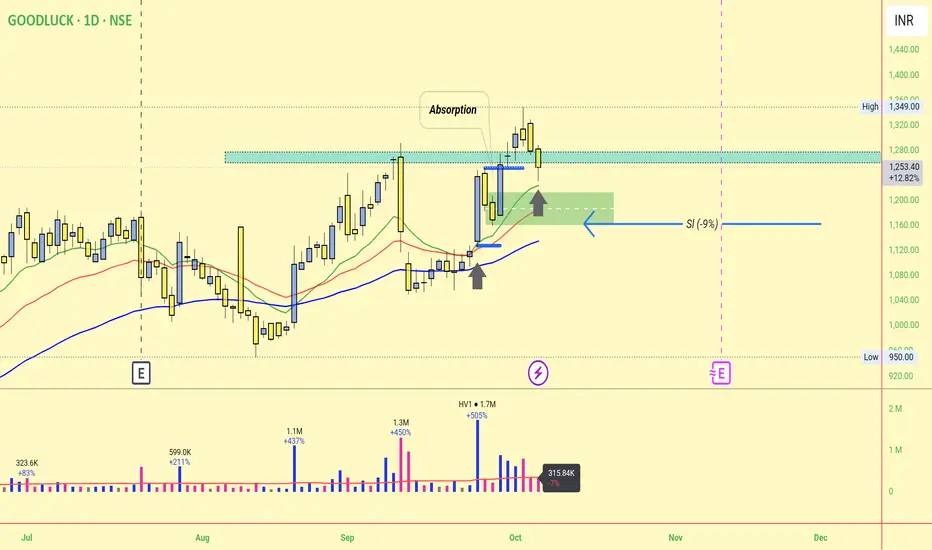
Goodluck swing500% big volume after price fall and quickly recover , now look like maybe sustain and move upside,
Here i just look
Huge volume
But price move , after profit booking, then fast way recovery.
And some News for affect in short to midium term
Sbi mutual fund bought that time , and some defences news
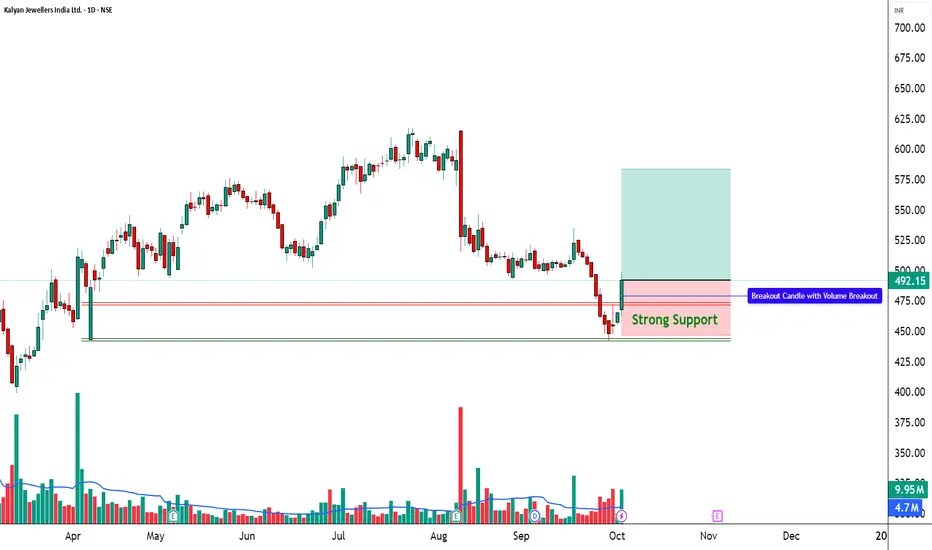
Kalyan Jewellers | RSI Breakout + High Volume Alert________________________________________
📈 Kalyan Jewellers | RSI Breakout + High Volume Alert 🚨
🔹 Entry Zone: ₹492.15
🔹 Stop Loss: ₹446.55 (Risk ~45.60 pts)
🔹 Supports: 470.48 / 448.82 / 434.93
🔹 Resistances: 506.03 / 519.92 / 541.58
________________________________________
🔑 Key Highlights
✅ Strong Bullish candle after a sharp downtrend
✅ Volume spike (9.95M vs avg 4.7M) – smart money activity detected
✅ RSI breakout – momentum shifting towards bulls
✅ Bollinger Band squeeze-off breakout expected – volatility expansion on cards
________________________________________
🎯 STWP Trade View
📊 Structure suggests short-term rebound rally possible towards ₹506–520 if momentum sustains.
⚠️ Strong supports at ₹470–448 should be watched for risk control.
________________________________________
💡 Learning Note
This setup shows how RSI breakouts with volume confirmation often lead to trend reversals. Adding multi-level support–resistance zones gives a clear trade map for both traders & investors.
________________________________________
⚠️ Disclosure & Disclaimer – Please Read Carefully
The information shared here is meant purely for learning and awareness. It is not a buy or sell recommendation and should not be taken as investment advice. I am not a SEBI-registered investment adviser, and all views expressed are based on personal study, chart patterns, and publicly available market data.
Trading—whether in stocks or options—carries risk. Markets can move unexpectedly, and losses can sometimes exceed the money you have invested. Past performance or past setups do not guarantee future results.
If you are a beginner, treat this as a guide to understand how the market works and practice on paper trades before risking real money. If you are experienced, always assess your own risk, position sizing, and strategy suitability before entering trades.
Consult a SEBI-registered financial adviser before making any real trading decision. By engaging with this content, you acknowledge full responsibility for your trades and investments.
💬 Found this useful?
🔼 Give this post a Boost to help more traders discover clean, structured learning.
✍️ Drop your thoughts, questions, or setups in the comments — let’s grow together!
🔁 Share with fellow traders and beginners to spread awareness.
👉 “If you liked this breakdown, follow for more clean, structured setups with discipline at the core.”
🚀 Stay Calm. Stay Clean. Trade With Patience.
Trade Smart | Learn Zones | Be Self-Reliant 📊
________________________________________
Extended Inverted Head & Shoulders Structure in Price ActionThis chart features an extended inverted head and shoulders pattern, illustrating how these classic formations can significantly vary in length and shape across timeframes. The left and right shoulders frame a deeper head, while the neckline is not strictly horizontal but angled, reflecting real market dynamics. Observing these variations enhances one’s ability to identify patterns in imperfect conditions.
Key aspects include the evolving symmetry between the shoulders, the consistency of the head’s depth, and the interaction of price with the neckline angle. This post encourages traders to look beyond textbook structures and develop a refined eye for authentic technical setups, emphasizing pattern recognition without predicting price direction.
Disclaimer: This analysis is for educational purposes only and does not constitute investment advice. Always conduct your own research before making trading decisions.
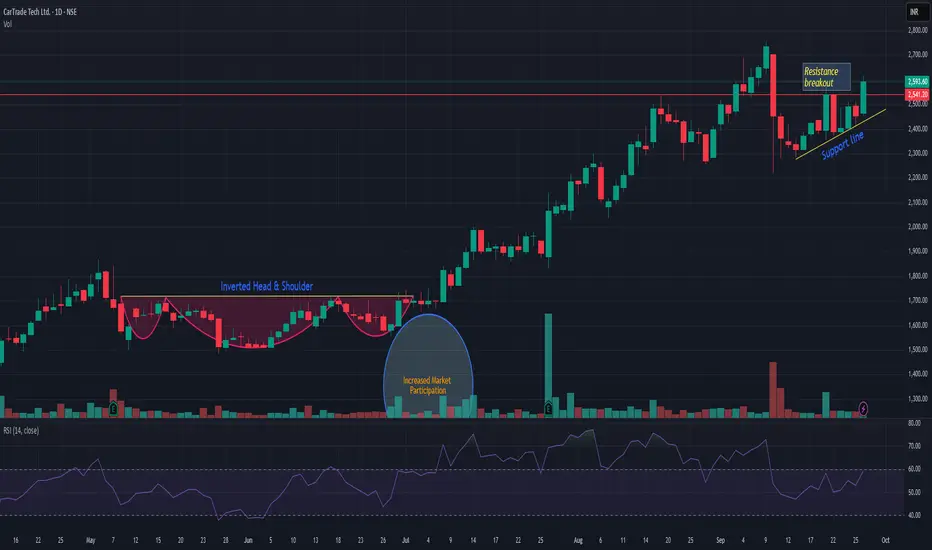
CARTRADECARTRADE is trying to come out from consolidation zone. Consolidation after good uptrend is a very good accumulation zone. Volume spike is also observed. There is v high probablity that the stock will resume its rally. So now as long as it is trading above support line it may give good bounce from current level. Keep it on radar.
HCCHCC showing strength and giving resistance breakout. As long as it is closing above 27 then it may continued its journey north side. Keep it in watchlist. 33/36 is seems on the table

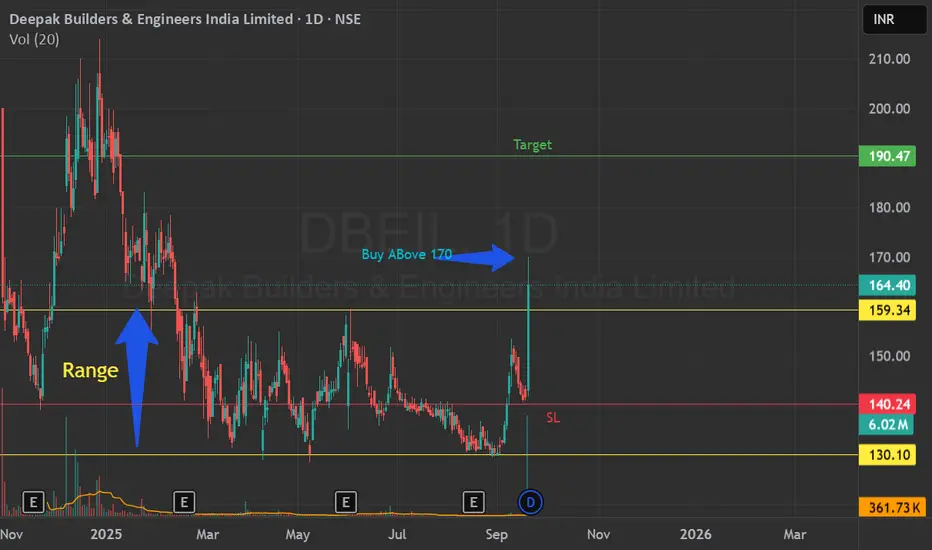
Range breakout, Partial entry as not a good Risk reward ratioRange breakout
Only partial entry now
Can average if price gets any retracement before reaching the target
The target was as equal as the range movement
CHOLAFIN Technical & Trade AnalysisCHOLAFIN Technical & Trade Analysis
1️⃣ Price Action
CHOLAFIN surged +4.31% to close at ₹1,583.10, marking a strong bullish candle on the daily chart. Price action shows a clean breakout attempt, with momentum reclaiming higher zones. The stock is now eyeing ₹1,662 → ₹1,737 → ₹1,845 as upside targets, while support holds near ₹1,536 – ₹1,490 – ₹1,463.
Key Levels:
🔴 Resistance: 1,609 | 1,635 | 1,681
🟢 Support: 1,536 | 1,490 | 1,463
________________________________________
2️⃣ Volume Analysis
Breakout is strongly backed by heavy volume. On breakout day, traded volume stood at 3.34M shares, almost 3.89× its 20-day average (1.15M shares). Such abnormal activity indicates institutional participation, confirming this is not a random spike but a move with strong backing.
________________________________________
3️⃣ Technical Indicators
✅ RSI: 65 → Bullish but not overbought yet
✅ MACD: Daily & Weekly bullish crossover confirmed
✅ CCI: 152 → Shows overbought momentum, supports trend
✅ Stochastic: 97 (Daily) → High momentum zone, short-term overheated
⚡ Multi-timeframe View: Daily & Weekly bullish, Monthly still sideways → Good for swing traders, long-term investors should stagger entries
________________________________________
4️⃣ Trade Setup
📈 Daily Closing Basis Trade
Entry: ₹1,588.20
SL: ₹1,513.77
Target 1: ₹1,662.63
Target 2: ₹1,737.06
⚖️ Risk–Reward: ~1:2 | Momentum strongly in favor
📊 Swing Trade Setup
Entry: ₹1,588.20
SL: ₹1,489.40
Target 1: ₹1,687
Target 2: ₹1,785
🚀 Higher potential: ₹1,845 (Fib extension)
Intraday Pullback level: 1560
Swing Pullback level: 1577
________________________________________
5️⃣ Investment Outlook
📈 Bullish Case – Why CHOLAFIN may go up
Strong bullish candle with massive volume (3.89× avg.)
RSI breakout with MACD crossover
Sectoral momentum in NBFC/finance space
Strong support zone near 1,490–1,460 ensures limited downside
📉 Bearish Case – Watch out for
Overheated stochastic (near 97) may cause short-term pullback
Resistance around ₹1,681–1,735 is critical supply zone
Broader market weakness could stall momentum
________________________________________
⚡ Final Outlook
Momentum: Strong | Trend: Bullish | Risk: Low | Volume: High
________________________________________
💡 Learning Note
This setup is a classic high-volume breakout trade → when price action, RSI, MACD, and volume align, probability of success is high. NBFC sector plays like CHOLAFIN can deliver strong short-term swing moves when backed by 3–4× volume spikes.
________________________________________
📈 Chart Pattern Analysis
CHOLAFIN on the daily timeframe has given a Double Bottom / Inverse Head & Shoulders–type breakout, a classic bullish reversal setup. The two key lows were formed near the ₹1,470–1,490 zone, showing strong demand absorption at that level. The neckline breakout came around ₹1,544–1,550, confirmed with a big green candle and 3.89× average volume, which validates institutional participation. This breakout indicates that sellers failed to push the stock lower twice, and buyers have now taken control, shifting momentum firmly to the upside. Based on the pattern projection and Fibonacci extensions, the upside potential extends towards ₹1,684 → ₹1,760 → ₹1,800, aligning with the 1.0 and 1.272 Fib levels.
________________________________________
⚠️ Disclaimer – Please Read Carefully
The information shared here is meant purely for learning and awareness. It is not a buy or sell recommendation and should not be taken as investment advice. I am not a SEBI-registered investment advisor, and all views expressed are based on personal study, chart patterns, and publicly available market data.
Trading — whether in stocks or options — carries risk. Markets can move unexpectedly, and losses can sometimes exceed the money you have invested. Past performance or past setups do not guarantee future results.
If you are a beginner, treat this as a guide to understand how the market works — practice on paper trades before risking real money. If you are experienced, always assess your own risk, position sizing, and strategy suitability before entering trades.
Consult a SEBI-registered financial advisor before making any real trading decision. By engaging with this content, you acknowledge full responsibility for your trades and investments.
💬 Found this useful?
🔼 Give this post a Boost to help more traders discover clean, structured learning.
✍️ Drop your thoughts, questions, or setups in the comments — let’s grow together!
🔁 Share with fellow traders and beginners to spread awareness.
👉 “If you liked this breakdown, follow for more clean, structured setups with discipline at the core.”
🚀 Stay Calm. Stay Clean. Trade With Patience.
Trade Smart | Learn Zones | Be Self-Reliant 📊

LT - Technical & Trade Analysis📊 Larsen & Toubro (L&T) – Technical & Trade Analysis
________________________________________
1️. Price Action
L&T has displayed a powerful bullish move, closing at ₹3,667.80 (+2.28%) with a strong green candle on the daily chart. The price has broken above the neckline at 3,649, which coincides with the 0.786 Fibonacci retracement level, confirming a bullish reversal from recent lows. With this breakout, the stock is now well-placed to test higher levels at ₹3,731, ₹3,802, and eventually ₹3,931, while key support zones remain intact near ₹3,615 – ₹3,535. This price action clearly indicates a shift in momentum from weakness to strength.
Key Levels:
🔴 Resistance: 3696.83 | 3725.87 | 3777.73
🟢 Support: 3615.93 | 3564.07 | 3535.03
________________________________________
2️. Volume Analysis
The bullish breakout is strongly validated by volume data. On the breakout day, L&T recorded a traded volume of 2,928,060 shares, which is more than 2.38 times its 20-day average volume (1,376,896 shares). Such a significant spike in activity signals institutional buying and strong market participation, a hallmark of reliable breakouts. A VolX reading of 2.38 highlights that the move is not a random uptick but a surge backed by heavy accumulation, adding conviction to the ongoing rally.
________________________________________
3️. Technical Indicators
The technical setup offers multiple confirmations for the bullish bias. The yellow-tagged highlights show that the stock has given an RSI breakout, MACD crossover, Bollinger Band breakout, bullish VWAP signal, and a BB squeeze release, all pointing towards the start of a momentum expansion phase. Additionally, the multi-timeframe indicator table on the top right reinforces this view: Stochastic and CCI are bullish across daily and weekly timeframes, while the MACD is bullish on daily and weekly but still bearish on the monthly, hinting at some caution for long-term investors. Meanwhile, RSI at 61 signals healthy strength without yet entering overbought territory. Together, these indicators align to support the short-term bullish momentum in L&T.
________________________________________
4. Latest Update
Larsen & Toubro (L&T) has been in the spotlight recently with a series of significant developments. The company’s Heavy Civil Infrastructure vertical secured a “significant” order worth ₹1,000–2,500 crore from NPCIL for the Kudankulam Nuclear Power Project (Units 5 & 6) in Tamil Nadu, while it also bagged a major contract from NHSRCL to construct 156 km of ballastless track for the Mumbai–Ahmedabad bullet train corridor. On the flip side, L&T has expressed its intent to exit the Hyderabad Metro Phase I operations citing financial and operational challenges and confirmed it will not participate in the Phase II expansion. Financially, the company posted nearly 30% YoY profit growth in Q1FY26, supported by strong execution and a robust order book, further boosted by these fresh wins. Meanwhile, Chairman S. N. Subrahmanyan highlighted long-term succession planning and clarified remarks on work culture that recently drew public debate.
________________________________________5. Investment Outlook
📈 Bullish Case – Why L&T could go up
Breakout above neckline with volume confirmation
RSI & MACD both turning positive on Daily
Strong support zone at 3615–3560 ensures limited downside
Sectoral rotation into infra/engineering plays could fuel upside
📉 Bearish Case – Potential downside risks
Heavy resistance around ₹3,731–₹3,777 (previous supply zone)
If it fails to hold above ₹3,649, profit booking may drag it back to ₹3,585 / ₹3,535
Macro headwinds (interest rate or project delays) could stall the momentum
⚡ Momentum Case – Short-term Trading Edge
Current move shows "Buy Today – Sell Tomorrow" setup
Entry @ ₹3,674, SL @ ₹3,590.44, Target 1: ₹3,757.56, Target 2: ₹3,841.12
Risk Reward is favorable, supported by strong bullish volume
________________________________________
📅 Short-term vs Long-term Perspective
Short-Term (Swing Trade): Strong bullish case, momentum intact, low risk with clear entry/SL/targets.
Medium-Term (1–3 months): Stock can test ₹3,900–₹4,000 zone if momentum sustains.
Long-Term: Monthly MACD still bearish; investors should add gradually only above ₹3,800+ confirmation.
________________________________________
📝 STWP Trade Analysis
📊 Daily Closing Basis Trade
Entry 3,674, SL 3,590.44, T1 3,757.56 (R:R 1:1), T2 3,841.12 (R:R 1:2).
📊 Swing Trade Setup
Entry 3,674, SL 3,545.40, T1 3,802.60 (R:R 1:1), T2 3,931.20 (R:R 1:2).
Pullback level for Intraday Traders: 3643
Pullback level for swing Traders: 3585
________________________________________
Final Outlook
Momentum: Strong | Trend: Bullish | Risk: Low | Volume: High
________________________________________
💡 Learning Note
This setup demonstrates the power of combining price action, Fibonacci levels, and volume confirmation. A bullish breakout above the neckline with heavy volume plus indicator alignment is one of the most reliable swing trade setups. Double Bottom breakouts with neckline retests + volume confirmation are among the highest probability setups in technical trading
________________________________________
📈 Chart Pattern Analysis
L&T on the daily timeframe has given a Double Bottom Pattern breakout, a classic bullish reversal setup. The two bottoms were formed near the 3,535–3,560 zone, showing strong demand absorption at that level. The neckline breakout came at 3,649, confirmed with a big green candle and 2.38× average volume, which validates institutional participation. This pattern indicates that sellers failed to push the stock lower twice, and buyers have now taken control, opening the path for higher targets. Based on the pattern projection, the upside potential extends towards 3,802 → 3,931, aligning with the Fibonacci extension levels.
⚠️ Disclaimer – Please Read Carefully
The information shared here is meant purely for learning and awareness. It is not a buy or sell recommendation and should not be taken as investment advice. I am not a SEBI-registered investment advisor, and all views expressed are based on personal study, chart patterns, and publicly available market data.
Trading — whether in stocks or options — carries risk. Markets can move unexpectedly, and losses can sometimes exceed the money you have invested. Past performance or past setups do not guarantee future results.
If you are a beginner, treat this as a guide to understand how the market works — practice on paper trades before risking real money. If you are experienced, always assess your own risk, position sizing, and strategy suitability before entering trades.
Consult a SEBI-registered financial advisor before making any real trading decision. By engaging with this content, you acknowledge full responsibility for your trades and investments.
💬 Found this useful?
🔼 Give this post a Boost to help more traders discover clean, structured learning.
✍️ Drop your thoughts, questions, or setups in the comments — let’s grow together!
🔁 Share with fellow traders and beginners to spread awareness.
👉 “If you liked this breakdown, follow for more clean, structured setups with discipline at the core.”
🚀 Stay Calm. Stay Clean. Trade With Patience.
Trade Smart | Learn Zones | Be Self-Reliant 📊

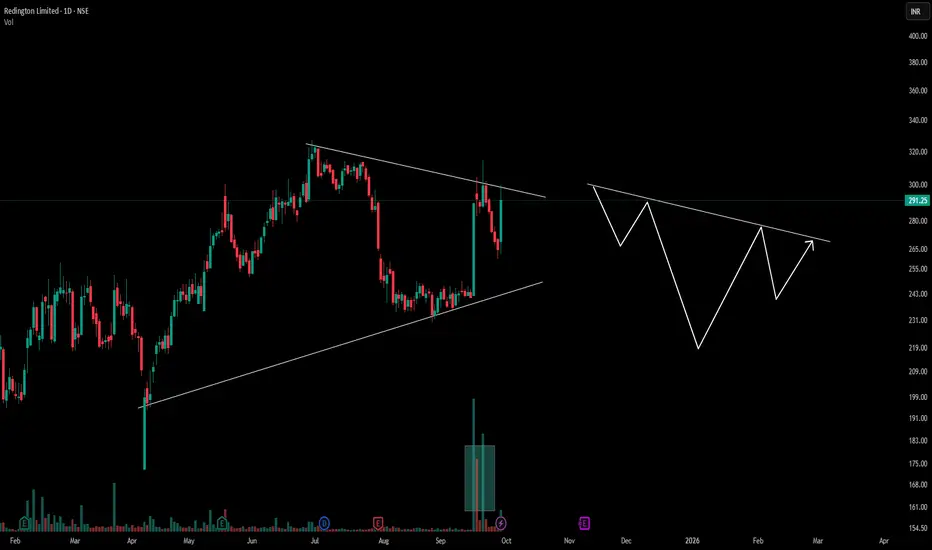
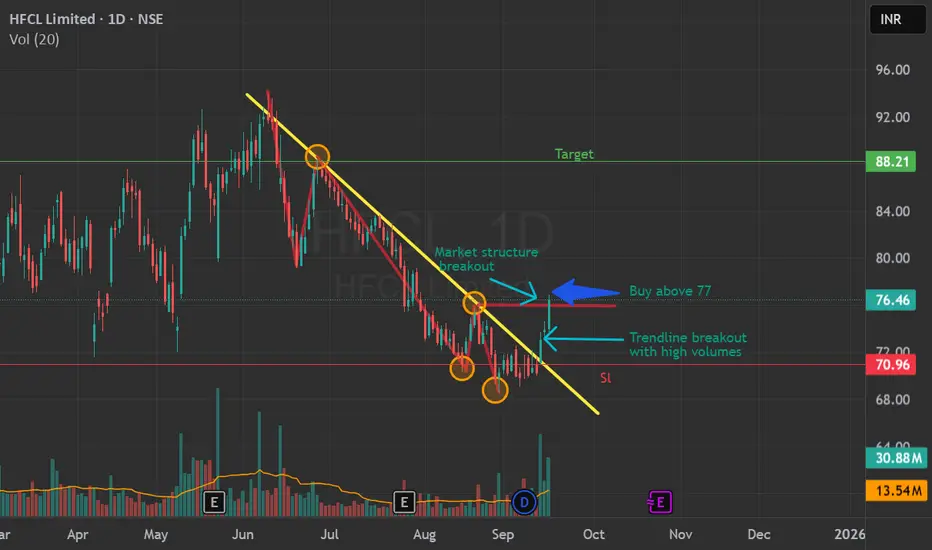
Trendline Breakout and Markt Strctr BreakoutA clear trendline has broken with huge volumes
Market structure of lower lows and lower highs was broken
Price can touch the high of the trendline
Follow with strict target and stoploss
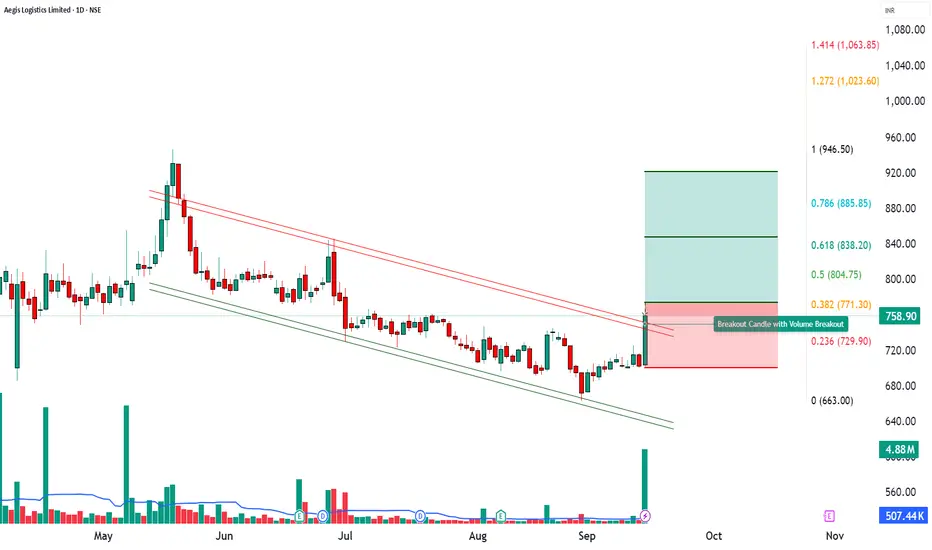
“Aegis Logistics | 20x Volume Breakout Signals Fresh Upside MomAegis Logistics Ltd (CMP: ₹758.90 | +8.07%)
🔎 Technical Outlook:
Aegis Logistics witnessed a 20-day volume breakout with an extraordinary 20X spike in price-volume activity, signaling strong market participation. The stock formed a powerful bullish candle, indicating robust momentum and accumulation interest.
The breakout above recent consolidation zones suggests the potential for a trend continuation if follow-up buying sustains.
________________________________________
📈 Key Levels:
Entry Zone: ₹774
Stop Loss: ₹700.25
Support Levels: 715.5 / 672.1 / 642.85
Resistance Levels: 788.15 / 817.4 / 860.8
Major Resistance Zone: ₹946 – ₹995
________________________________________
🎯 Upside Targets:
Target 1 → ₹847.75
Target 2 → ₹921.50
Target 3 → ₹995.25
Target 4 → ₹1,069
________________________________________
⚡ Why Bullish?
20-Day & 52-Week Volume Breakout confirmation
RSI, Stochastic & MACD supporting bullish bias on daily & weekly charts
Strong momentum candle near breakout zone
Rising interest seen from institutional volumes
________________________________________
📢 Summary:
Aegis Logistics is entering a high-momentum zone. Sustaining above ₹774 can trigger multi-level rallies toward ₹921–₹1,069 in the coming sessions. However, a dip below ₹700 will negate this bullish structure.
📰 Latest News
Aegis Logistics shares surged ~10% in a single day, driven by strong volumes. It was the stock’s highest single-day gain since March. Trading volume hit a four-month high (~31 lakh shares) much above its 20-day average. Business Today
The stock exceeded its 50-day moving average around ₹724, touching resistance zones around ₹763 to ₹772 (100- & 200-day moving averages). Business Today
Additional longer-term news: The joint-venture Aegis Vopak Terminals (AVTL) is planning a ₹2,800 crore IPO to reduce debt and fund expansion; Aegis Logistics has ~50.1% stake in that JV. The Economic Times
Also, an in-principle approval for a new LPG siding (rail facility) at Panambur (New Mangalore Port) for AEGIS Vopak was granted by Palakkad railway division. This could improve LPG logistic flows. The Times of India
📈 Investment Outlook
Aegis Logistics delivered a strong 20-day volume breakout (VolX ≈ 20x) with a sharp bullish candle. Technical momentum plus upcoming catalysts like the JV IPO and new LPG siding approval are fueling sentiment.
________________________________________
📈 Bullish Case – Why the stock could go up
High-volume breakout (20x average) signals institutional accumulation.
Momentum indicators: RSI 63, CCI 177, Stochastic 86 – still bullish.
Sustaining above ₹774 can open upside toward ₹847 – ₹921 initially, then ₹995 – ₹1069.
Positive news: JV IPO plans and LPG siding approval provide structural growth drivers.
📉 Bearish Case – Potential downside risks
Resistance near ₹788 – ₹817 may trigger profit booking.
Failure to sustain above ₹774 could lead to correction back toward ₹729 – ₹715.
Sectoral risks: energy/logistics costs, regulatory delays may hurt sentiment.
⚡ Momentum Case – Short-term Trading Edge
20x volume + bullish MACD on daily and weekly = strong near-term edge.
Bollinger Band breakout adds volatility momentum.
Holding ₹774 may fuel a rally toward ₹847 – ₹921 in 2–5 sessions.
📅 Short-term vs Long-term Perspective
Short-term (1–2 weeks): Test of ₹847–₹921 likely; supports 729–715 are critical.
Long-term (1–3 months): Sustained breakout plus IPO news flow can re-rate stock higher toward ₹995–₹1069.
________________________________________
⚠️ Disclaimer – Please Read Carefully
The information shared here is meant purely for learning and awareness. It is not a buy or sell recommendation and should not be taken as investment advice. I am not a SEBI-registered investment advisor, and all views expressed are based on personal study, chart patterns, and publicly available market data.
Trading — whether in stocks or options — carries risk. Markets can move unexpectedly, and losses can sometimes exceed the money you have invested. Past performance or past setups do not guarantee future results.
If you are a beginner, treat this as a guide to understand how the market works — practice on paper trades before risking real money. If you are experienced, always assess your own risk, position sizing, and strategy suitability before entering trades.
Consult a SEBI-registered financial advisor before making any real trading decision. By engaging with this content, you acknowledge full responsibility for your trades and investments.
💬 Found this useful?
🔼 Give this post a Boost to help more traders discover clean, structured learning.
✍️ Drop your thoughts, questions, or setups in the comments — let’s grow together!
🔁 Share with fellow traders and beginners to spread awareness.
👉 “If you liked this breakdown, follow for more clean, structured setups with discipline at the core.”
🚀 Stay Calm. Stay Clean. Trade With Patience.
Trade Smart | Learn Zones | Be Self-Reliant 📊
Explosive Volume Breakout StocksHello Traders!
Today’s session we have an explosive breakout on record volumes. The setup is not only backed by price action but also confirmed by multiple technical indicators such as RSI, Bollinger Bands, SuperTrend, VWAP, and BB Squeeze. Let’s decode this in detail 👇
________________________________________________________________________________
________________________________________________________________________________
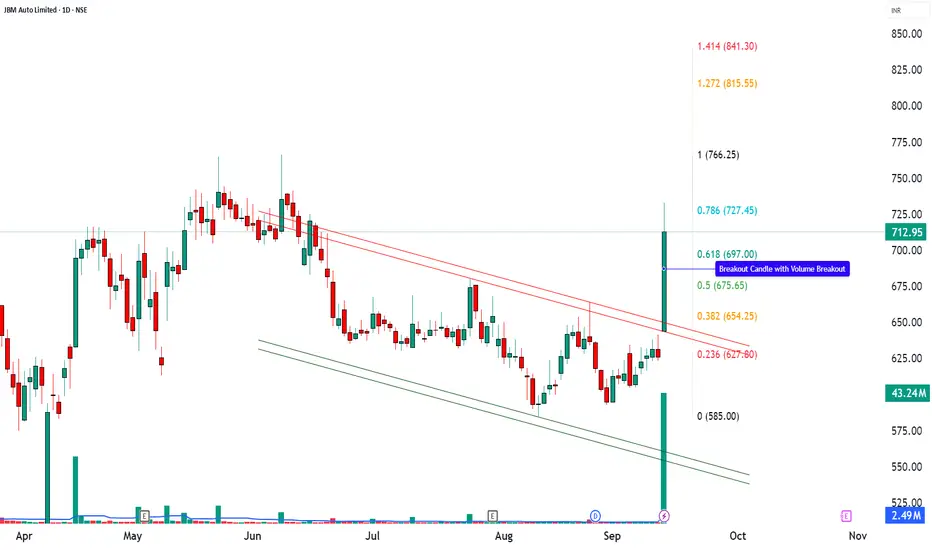
JBM Auto Ltd (NSE: JBMA)
CMP: 712.95 (+13.92%)
Breakout: Strong 52-week volume breakout with momentum
Key Supports: 660 / 608 / 571
Key Resistances: 749 / 785 / 838
Setup Explanation
JBM Auto delivered a powerful bullish breakout candle backed by 20x volume against its average, confirming strong accumulation. The stock has broken a long-term downtrend with a surge in momentum. This looks like a technically strong breakout setup as per chart patterns, but risks remain. The chart highlights multiple bullish signals: RSI breakout ⚡ shows renewed strength. Bollinger Band breakout 📊 signals volatility expansion. Bullish SuperTrend & VWAP align with upward momentum. BB Squeeze Off 🔥 confirms the end of consolidation and beginning of a trending move. As long as the stock holds above 697–712, momentum is likely to extend towards higher resistances, with 843 as a near-term swing target. A sustained close below 607 would negate the bullish structure.
Latest Update – JBM Auto (JBMA)
JBM Auto is buzzing after its subsidiary JBM Ecolife Mobility secured a $100 million investment from IFC, marking IFC’s largest e-mobility funding in India. The capital will accelerate deployment of over 1,400 electric buses across multiple states, boosting JBMA’s already strong ₹12,900 crore order book. The stock surged ~9–11% on record volumes as the news reinforced confidence in India’s EV and green mobility push.
While momentum is strong, analysts also flag elevated valuations, thin margins, and execution risks, making it important for traders to watch key levels closely.
Investment Outlook & Conclusion
Bullish Case – The stock has given a 52-week breakout with 20x average volumes. If momentum sustains, it may attempt levels of ₹749 → ₹785 → ₹815 → ₹838 → ₹843.
Bearish Case – A sustained slip below ₹622 could weaken the structure and open downside risk.
Momentum Case – Current price action with heavy volumes indicates a short-term momentum phase. However, this is a high-risk, high-reward scenario suitable only for aggressive swing setups.
Perspective – Short-term structure is positive, while long-term outcomes will depend on execution of EV bus orders, government policy support, and maintaining profitability margins.
📊 STWP Trade Analysis – JBM Auto (JBMA)
👉 In my chart study, I have marked ₹732.80 as an entry level with ₹621.95 as an invalidation level.
👉 If the stock dips towards ₹627–607 (Pullback Zone), I will treat it as a conservative re-entry with tighter risk.
Invalidation Level: A sustained move below ₹607 will negate my bullish view.
⚠️ This is my swing trading approach as long as supports hold, shared only for learning how I structure trades. It is not a buy/sell recommendation.
________________________________________________________________________________
________________________________________________________________________________
⚠️ Disclaimer – Please Read Carefully
The information shared here is meant purely for learning and awareness. It is not a buy or sell recommendation and should not be taken as investment advice. I am not a SEBI-registered investment advisor, and all views expressed are based on personal study, chart patterns, and publicly available market data.
Trading — whether in stocks or options — carries risk. Markets can move unexpectedly, and losses can sometimes exceed the money you have invested. Past performance or past setups do not guarantee future results.
If you are a beginner, treat this as a guide to understand how the market works — practice on paper trades before risking real money. If you are experienced, always assess your own risk, position sizing, and strategy suitability before entering trades.
Consult a SEBI-registered financial advisor before making any real trading decision. By engaging with this content, you acknowledge full responsibility for your trades and investments.
💬 Found this useful?
🔼 Give this post a Boost to help more traders discover clean, structured learning.
✍️ Drop your thoughts, questions, or setups in the comments — let’s grow together!
🔁 Share with fellow traders and beginners to spread awareness.
👉 “If you liked this breakdown, follow for more clean, structured setups with discipline at the core.”
🚀 Stay Calm. Stay Clean. Trade With Patience.
Trade Smart | Learn Zones | Be Self-Reliant 📊
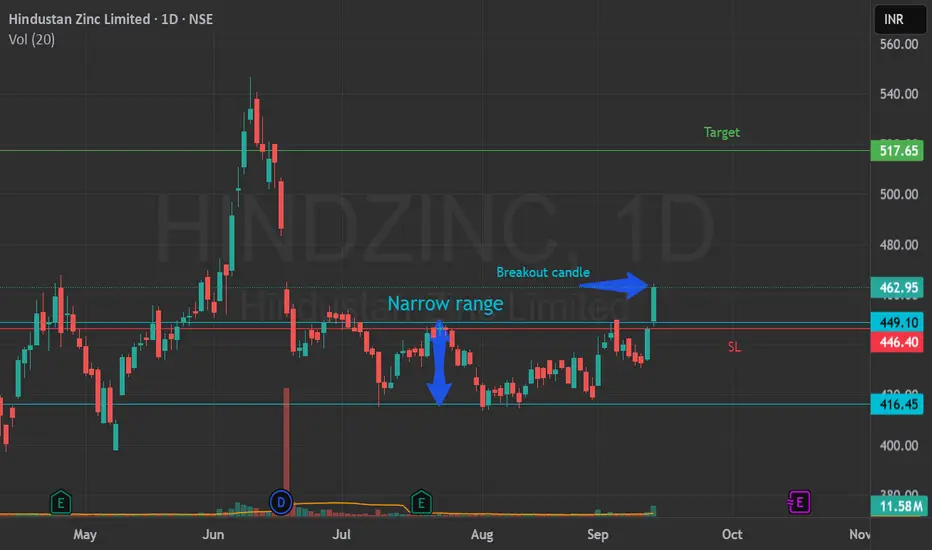
Narrow range breakout .Buy above 465A good breakout candle with high volume from narrow range could draw the price up.Follow with strict SL and target. Only for education purpose*.
Explosive Volume Breakout StocksHello Traders! Today’s session was packed with action as several midcap names showed explosive breakouts on record volumes. These setups are not only backed by price action but also confirmed by multiple technical indicators such as RSI, Bollinger Bands, SuperTrend, VWAP, and BB Squeeze. Let’s decode them in detail 👇
1️ Greenpanel Industries Ltd (NSE: GREENPANEL)
CMP: ₹322.15 (+18.09%)
Breakout with Heavy Volumes
Key Supports: ₹288 / ₹254
Resistances: ₹341 / ₹361 / ₹395
🔑 Strong 52-week breakout with bullish follow-through. Sustaining above ₹288 could keep the momentum alive.
The stock witnessed a 52-week volume breakout, supported by a strong bullish candle that confirms aggressive buying interest. The RSI has broken out, highlighting fresh momentum, while the Bollinger Band breakout shows volatility expansion after a period of consolidation. Alongside this, the Bullish SuperTrend and VWAP indicators confirm trend alignment with volume, suggesting institutional participation. Interestingly, the BB Squeeze turning off signals that the low-volatility phase has ended, and the stock may now enter a trending move.
________________________________________
2️ Indoco Remedies Ltd (NSE: INDOCO)
CMP: ₹308.60 (+11.47%)
RSI Breakout + Volume Expansion
Key Supports: ₹280 / ₹252
Resistances: ₹334 / ₹360 / ₹388
🔑 Open = Low + strong bullish candle. Short-term traders may keep an eye on ₹280 as support.
Indoco Remedies also recorded a powerful 52-week volume breakout, signaling accumulation at higher levels. The RSI breakout validates the momentum shift, while the “open = low” pattern reflects intraday buying from the very start of the session. The Bollinger Band breakout points to volatility expansion, and the Bullish SuperTrend along with VWAP confirms that both trend and volume are favoring the bulls. Additionally, the BB Squeeze compression breakout shows that the stock has just moved out of a tight consolidation, opening the doors for a strong upside continuation.
________________________________________
3️ Piccadilly Agro Industries Ltd (NSE: PICCADIL)
CMP: ₹723.80 (-13.58%)
Strong Bullish Candle on Massive Volumes
Key Supports: ₹660 / ₹598
Resistances: ₹765 / ₹806 / ₹869
🔑 Despite closing off highs, volumes indicate institutional interest. Watch ₹660 as a key level.
Piccadilly Agro displayed a strong bullish candle backed by exceptional volumes, which suggests fresh interest from market participants. The RSI breakout supports the strength of the momentum, while the Bollinger Band breakout indicates that the stock has entered a new volatility phase. Both Bullish SuperTrend and VWAP confirm that the price move is well-supported by trend-following and volume-based systems. With the BB Squeeze off, the compression phase has ended, further confirming the possibility of an extended rally if key supports hold.
________________________________________
4️ SMS Pharmaceuticals Ltd (NSE: SMSPHARMA)
CMP: ₹300.55 (+12.14%)
52-Week Volume Breakout
Key Supports: ₹273 / ₹247
Resistances: ₹319 / ₹339 / ₹365
🔑 Stock showing bullish momentum with multiple indicator confirmations. A close above ₹319 may trigger the next leg.
SMS Pharma registered a 52-week volume breakout combined with short-term bullish momentum, indicating a strong change in trend. The RSI breakout highlights renewed momentum, and the Bollinger Band expansion reflects volatility returning after consolidation. The Bullish SuperTrend and VWAP are both in sync with the buyers, suggesting sustainable strength. The BB Squeeze turning off is another confirmation that the quiet phase is over, and the stock could witness directional movement. Overall, multiple indicators align to suggest that this breakout has solid backing from both price and volume action.
________________________________________
💡 Technical Takeaway:
When volume expansion aligns with RSI, Bollinger Bands, and SuperTrend confirmations, breakouts have higher chances of sustaining. Always track key support levels for validation.
⚠️ Disclaimer – Please Read Carefully
The information shared here is meant purely for learning and awareness. It is not a buy or sell recommendation and should not be taken as investment advice. I am not a SEBI-registered investment advisor, and all views expressed are based on personal study, chart patterns, and publicly available market data.
Trading — whether in stocks or options — carries risk. Markets can move unexpectedly, and losses can sometimes exceed the money you have invested. Past performance or past setups do not guarantee future results.
If you are a beginner, treat this as a guide to understand how the market works — practice on paper trades before risking real money. If you are experienced, always assess your own risk, position sizing, and strategy suitability before entering trades.
Consult a SEBI-registered financial advisor before making any real trading decision. By engaging with this content, you acknowledge full responsibility for your trades and investments.
💬 Found this useful?
🔼 Give this post a Boost to help more traders discover clean, structured learning.
✍️ Drop your thoughts, questions, or setups in the comments — let’s grow together!
🔁 Share with fellow traders and beginners to spread awareness.
👉 “If you liked this breakdown, follow for more clean, structured setups with discipline at the core.”
🚀 Stay Calm. Stay Clean. Trade With Patience.
Trade Smart | Learn Zones | Be Self-Reliant 📊
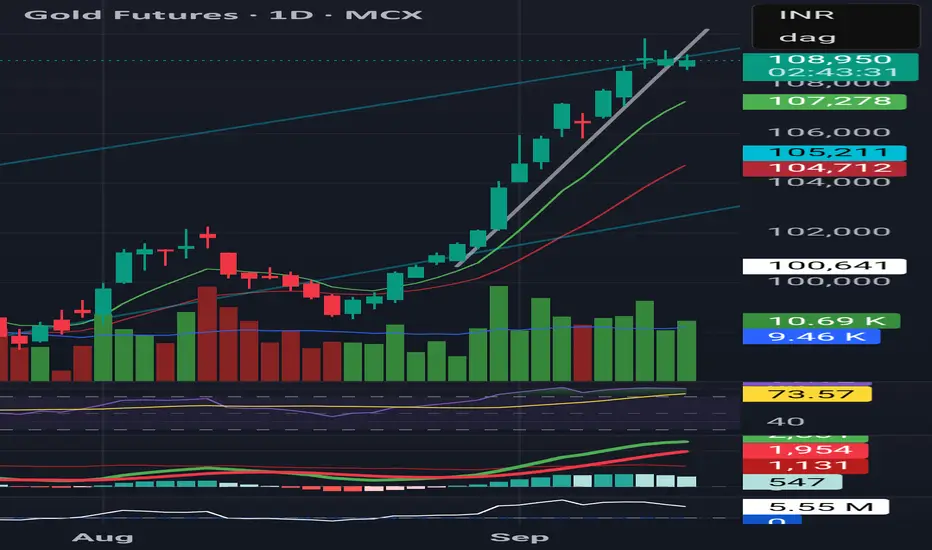
Technical View – Gold Futures (MCX)Trend: Sharp rally extended, but now showing pause with doji candles at the top.
Volume: Trendline breakout earlier came with strong participation; latest candles show reduced conviction.
Momentum: RSI near 74 → overbought, but stabilizing. MACD still positive, histogram flattening → signs of momentum cooling.
Support Levels: ₹107,250 (short-term EMA), ₹105,200 (swing support).
Bias: Rally intact, but risk of sideways/consolidation phase unless fresh volume confirms continuation.
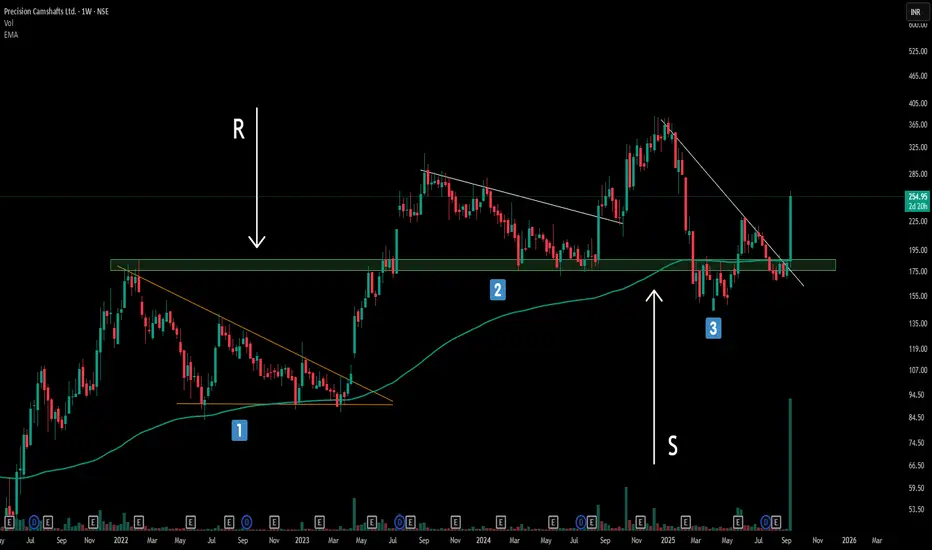
The Power of Trendline Angles : My Full time trading ExperienceBreaking Down Three Critical Trendline Structures - A Complete Analysis
Structure 1: The Power of Steep Angles (Primary Focus)
The first structure showcases what I consider the gold standard of trendline breakouts. Notice how the trendline is significantly tilted/slanted rather than following a gradual 45-degree angle.
Compressed Energy Release: Steep trendlines act like coiled springs, storing tremendous buying/selling pressure that explodes upon breakout
Key Observation: The resistance level (marked as 'R') held price down multiple times before the decisive breakout. Once broken, this level immediately flipped to become strong support (marked as 'S')—a textbook example of polarity flip dynamics.
Structure 2 & 3: Valid but Secondary Setups
While structures 2 and 3 represent legitimate continuation-based trendline breakouts, they pale in comparison to the explosive potential of Structure 1. However, they still qualify as CT (Continuation Trend) based breakout structures and shouldn't be ignored entirely
Remember: Not every trendline break deserves your attention. Focus on steep angles, exceptional volume, and clear flip confirmations for the highest probability setups. The market rewards patience and precision over frequency.
Disclaimer: Trading involves significant risk and is not suitable for all investors. Past performance does not guarantee future results. Always conduct your own research, consider seeking advice from a qualified financial advisor, and trade only with capital you can afford to lose.
CHAMBLFERT CHAMBLFERT is giving rectangle breakout with decent volume. Stock is in consolidation zone since 1 quarter. Near term support is near 552. Next resistance seems to be near 635/666. Keep it watchlist.
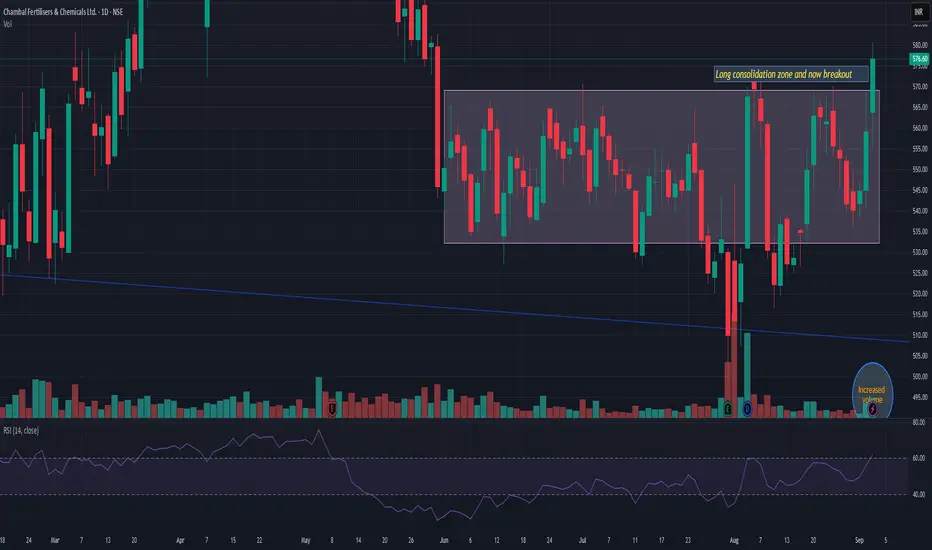
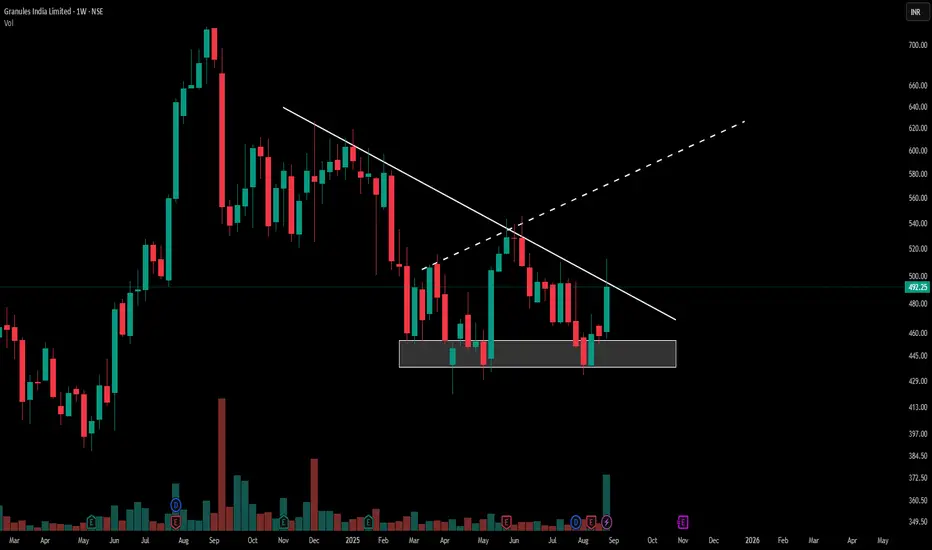
Granules India: Critical Descending TriangleGranules India Limited presents a descending triangle pattern on the weekly chart. The price has moved from the established support zone near ₹440-450 and is currently challenging the resistance trendline around ₹492.25. This movement appears with a marked increase in trading volume, highlighting the level where buyers and sellers are most active.
Pattern Character
A descending triangle pattern is identified by a series of lower highs against a stable support base. Granules India’s recent action displays persistence at support and upward momentum toward resistance. The volume expansion indicates notable participation during the current move.
Chart Observation
Price action above the triangle’s resistance can indicate a change in the prevailing sentiment if confirmed by continued volume. The current structure and market activity are being closely watched by participants for further development. No forecast or recommendation is made within this post.
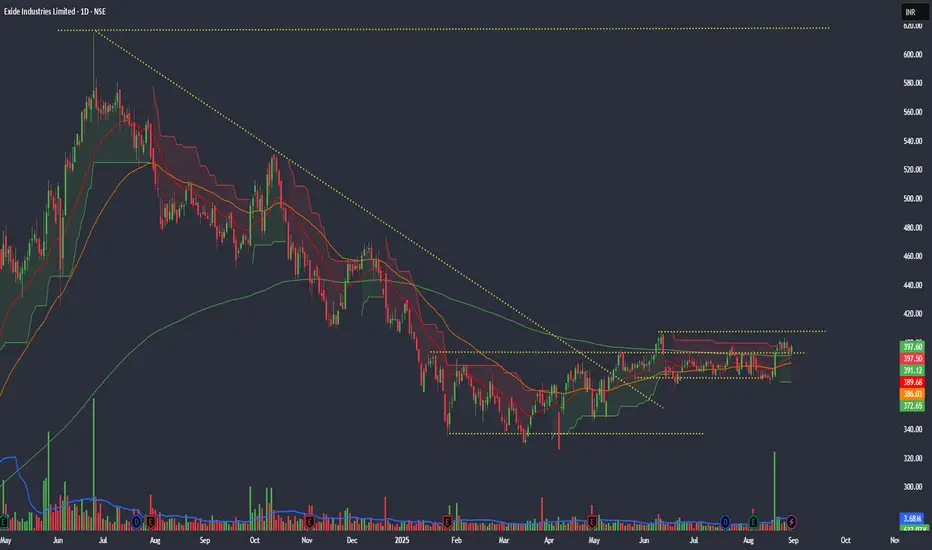
Exide Industries Ltd (EXIDEIND) – Breakout MomentumPrice Action
CMP: ₹396–400 (Aug 29, 2025)
Stock is consolidating near highs after strong rally.
Trading above 20 / 50 / 200 EMAs → confirms bullish structure.
Resistance: ₹405–410 (breakout zone)
Support: ₹389 → ₹385 → ₹365 (weekly base)
Upside Targets:
🎯 T1 = ₹430
🎯 T2 = ₹475
🎯 T3 = ₹535 (extended swing target)
Invalidation: Close below ₹385 → caution; below ₹365 → setup weakens.
Indicators & Momentum
RSI (14): ~62 → bullish, not extreme yet.
ADX: Strength building → supports continuation.
MFI: Above 70 → strong money inflow, but watch overbought.
MACD: Mixed; short-term pauses possible.
🧭 Trading View Bias
Bias: Bullish above ₹389
Short-Term: ₹405 → ₹430
Medium-Term: ₹475 → ₹535
Caution: Sustained close below ₹385 shifts bias neutral.
Disclaimer: This is a technical analysis for educational purposes only—not financial advice. Always perform your own due diligence before trading.
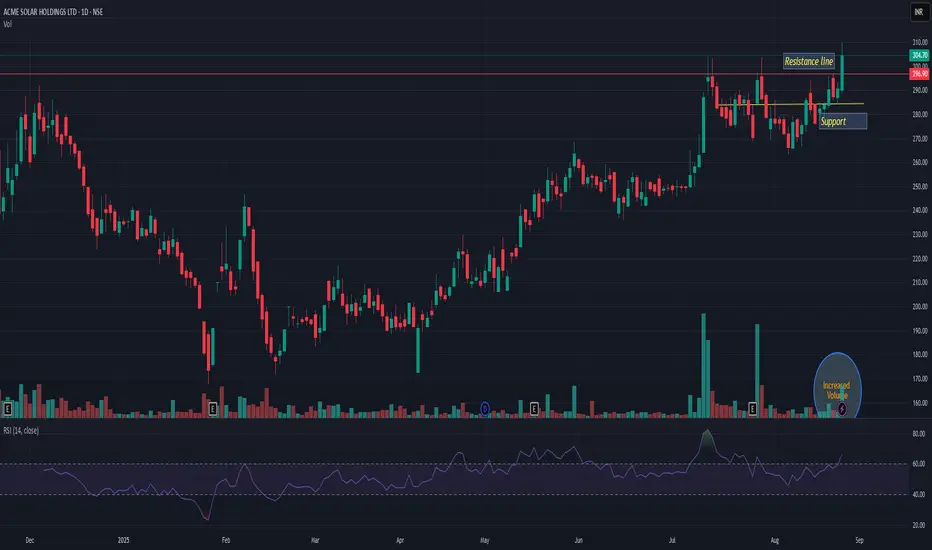
ACMESOLARACMESOLAR giving resistance breakout with decent volume. Support is near 280. Seems like this may take a new ride; trading at ATH. Very high probability that it can add up 12-15% from current level. Its very good risk-reward trade. Keep in yr watchlist
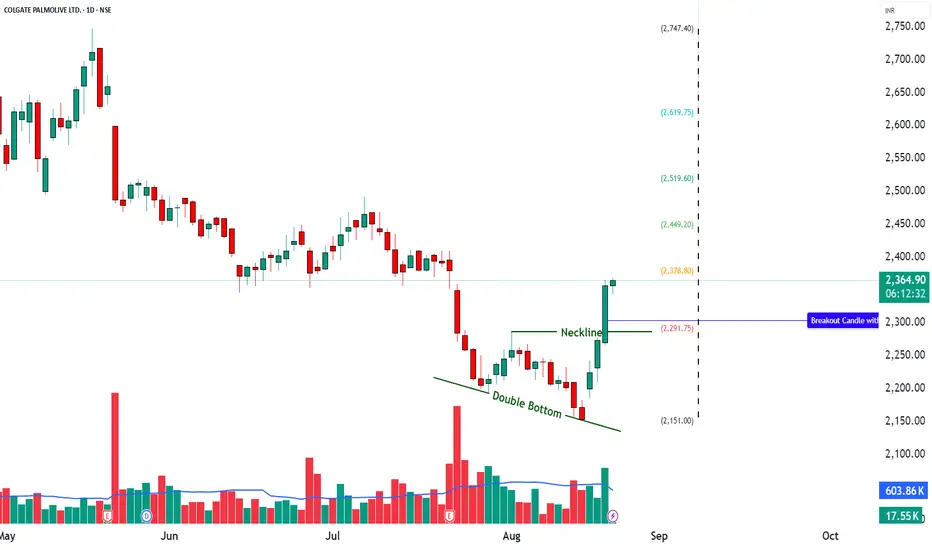
COLPAL - RSI Breakout + Bollinger Band Breakout📊 COLPAL – Technical & Educational Snapshot
Ticker: NSE: COLPAL | Sector: 🪥 FMCG
CMP: ₹ ▲ (as of 20 Aug 2025)
Rating (for learning purpose): ⭐⭐⭐⭐
Pattern Observed: 📈 RSI Breakout + Bollinger Band Breakout
COLPAL is showing strong bullish momentum supported by multiple technical indicators. The presence of a strong bullish candle, along with an RSI breakout at 61, highlights healthy buying pressure. A Bollinger Band breakout and BB Squeeze-Off indicate rising volatility and the possibility of a continuation move. The Bullish SuperTrend adds further confirmation, while momentum indicators (MACD bullish, CCI at 223, Stochastic at 96) signal strong near-term strength.
📊 Momentum Snapshot: Momentum indicators are aligned on the bullish side. While Stochastic shows overbought conditions, strong volume-backed momentum often sustains until key resistance levels are tested.
📊 Volume Check:
🔹 Current Volume: 1.01M
🔹 20SMA Volume: 710.56k ✅
💥 Significantly above average – confirms strong institutional / broad-based buying interest!
💡 Interpretation:
When volume is well above the 20-period average, it strengthens the reliability of a breakout.
It shows that the move is not just retail-driven but likely supported by larger participants.
Breakouts with high volume tend to sustain better compared to low-volume moves.
💡 Learnings:
Breakouts with Bollinger Band expansion often lead to strong follow-through moves.
RSI + MACD confirmation together strengthen trend reliability.
High CCI & Stochastic values show strong momentum but also highlight the importance of monitoring for pullbacks.
Defining pullback and invalidation levels helps in disciplined trade management.
Key Levels:
Resistance: 2393 | 2429 | 2492
Support: 2293 | 2229 | 2193
Pullback Area: 2294
Invalidation Level: Close below 2193
STWP Trade Setup:
Entry (Long): Above 2365
Stop Loss: 2262 or below
Reference Levels: 2467 | 2569
⚠️ Disclaimer – Please Read Carefully
The information shared here is meant purely for learning and awareness. It is not a buy or sell recommendation and should not be taken as investment advice. I am not a SEBI-registered investment advisor, and all views expressed are based on personal study, chart patterns, and publicly available market data.
Trading — whether in stocks or options — carries risk. Markets can move unexpectedly, and losses can sometimes be larger than the money you have invested. Past performance or past setups do not guarantee future results.
If you are a beginner, treat this as a guide to understand how the market works — practice on paper trades before risking real money. If you are an experienced trader, remember to assess your own risk, position sizing, and strategy suitability before entering any trade.
Consult a SEBI-registered financial advisor before making any real trading decision.
By reading, watching, or engaging with this content, you acknowledge that you take full responsibility for your own trades and investments.
💬 Found this useful?
🔼 Give this post a Boost to help more traders discover clean, structured learning.
✍️ Drop your thoughts, questions, or setups in the comments — let’s grow together!
🔁 Share with fellow traders and beginners to spread awareness.
✅ Follow simpletradewithpatience for beginner-friendly setups, price action insights & disciplined trading content.
🚀 Stay Calm. Stay Clean. Trade With Patience.
Trade Smart | Learn Zones | Be Self-Reliant 📊