ASIAN PAINTS LTD. – INTRADAY ZONE ANALYSIS________________________________________________________________________________
📈 ASIAN PAINTS LTD. – INTRADAY ZONE ANALYSIS
📆 Date: June 29, 2025 | ⏱ Timeframe: 15-Minute Chart
🔍 Educational Analysis for Learning Purposes Only
________________________________________________________________________________
📊 Zone Breakdown:
• 🔴 Top Range Resistance – 2,364.50
Marked in Red: This is a potential supply zone, where price may face resistance after a strong move up. Ideal for observing bearish reversal patterns like a shooting star, bearish engulfing, or a doji — especially if volume drops or candles show exhaustion.
• 🟠 Neutral Zone – Avoid Trade Area (2,320–2,340)
Marked in Orange: Historically indecisive. Avoid trades here as price often moves sideways or with false breakouts.
• 🟢 Demand Zone – 2,302.90 to 2,293.70 | SL: 2,292
Marked in Green: Price broke out with strong volume from this area. A retest may offer bullish pullback opportunities with proper confirmation candles.
• 🟩 Bottom Support – 2,275.40
Important base level. Breakdown below this zone may change overall short-term bias.
________________________________________________________________________________
🔍 Candlestick Observation:
At the resistance zone, the last candle shows slight upper rejection and reduced body size.
🧠 Interpretation: A possible early signal of exhaustion. Traders can watch for confirmation via volume drop or follow-up bearish candle for a short bias — or wait for breakout strength for long continuation.
________________________________________________________________________________
⚙️ Educational Trade Ideas (Study Purpose Only)
▶️ Reversal Setup – Bearish Bias
• Entry: Below ₹2,358 on bearish candle confirmation
• Stop Loss: Above ₹2,365
• Risk-Reward: 1:1 | 1:2+
• 🧠 Ideal for studying price rejection after a rally into resistance
________________________________________________________________________________
▶️ Pullback Setup – Bullish Bias
• Entry: Near ₹2,300 with bullish confirmation at demand zone
• Stop Loss: ₹2,292
• Risk-Reward: 1:1 | 1:2+
• 🧠 Useful example of “breakout → retest → continuation” pattern
________________________________________________________________________________⚠️ Disclaimer (SEBI-Compliant):
This content is shared strictly for educational and informational purposes. It is not investment advice or a trading recommendation. Please consult a SEBI-registered financial advisor before taking any investment decisions.
STWP | Learn. Trade. Grow.
________________________________________________________________________________
💬 What do you think about this setup?
Did you observe any other key patterns or zones?
👇 Drop your thoughts in the comments — let’s grow together!
________________________________________________________________________________
Volumeanalysis

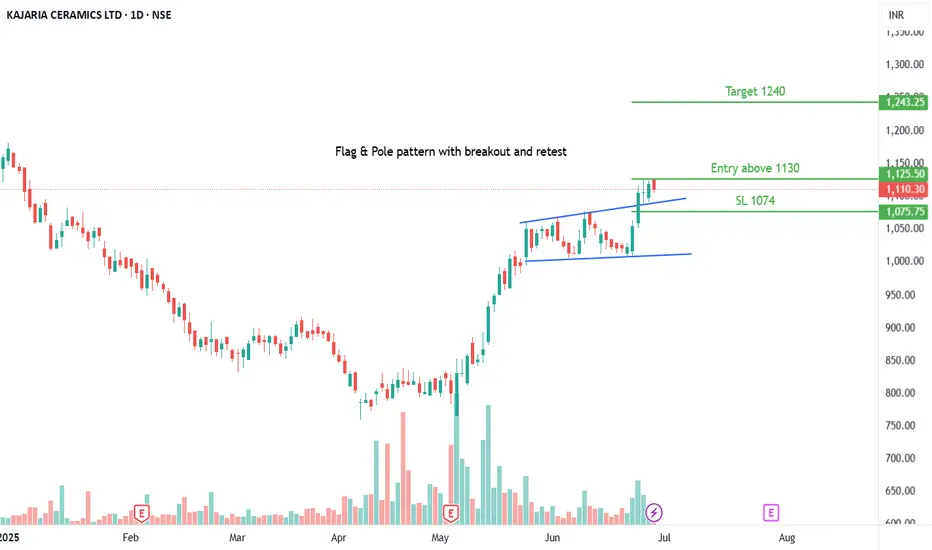
KAJARIACERAll details are given on chart for educational purpose only. If you like the analyses please do share it with your friends, like and follow me for more such interesting charts.
Disc - Am not a SEBI registered analyst. Please do your own analyses before taking position. Details provided on chart is only for educational purposes and not a trading recommendation
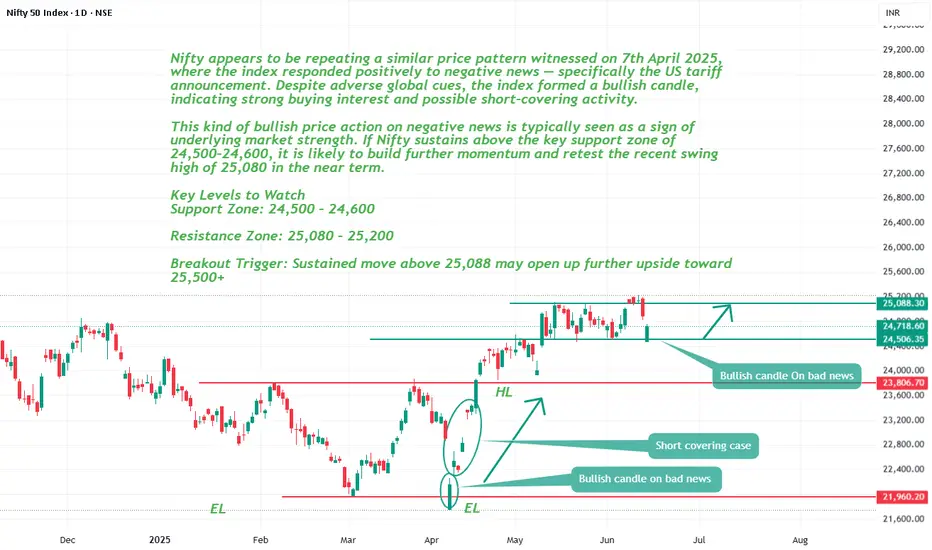
Nifty appears to be repeating price pattern of 7th April.Nifty appears to be repeating a similar price pattern witnessed on 7th April 2025, where the index responded positively to negative news — specifically the US tariff announcement. Despite adverse global cues, the index formed a bullish candle, indicating strong buying interest and possible short-covering activity.
This kind of bullish price action on negative news is typically seen as a sign of underlying market strength. If Nifty sustains above the key support zone of 24,500–24,600, it is likely to build further momentum and retest the recent swing high of 25,080 in the near term.
Key Levels to Watch
Support Zone: 24,500 – 24,600
Resistance Zone: 25,080 – 25,200
Breakout Trigger: Sustained move above 25,088 may open up further upside toward 25,500+
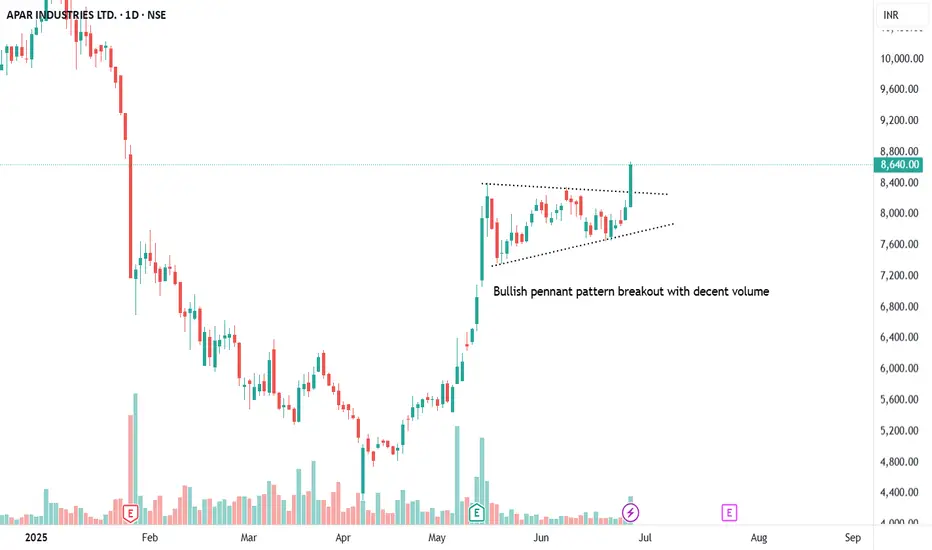
APARINDS - Bullish Pennant patternAll details are given on chart for educational purpose only. If you like the analyses please do share it with your friends, like and follow me for more such interesting charts.
Disc - Am not a SEBI registered analyst. Please do your own analyses before taking position. Details provided on chart is only for educational purposes and not a trading recommendation
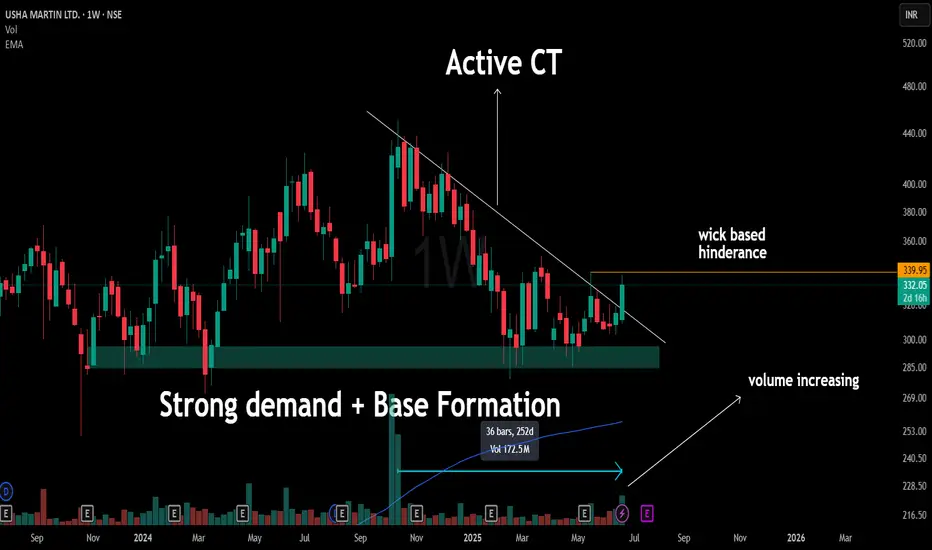
USHA MARTIN – Weekly Structure SnapshotA clean White CT that had acted as a multi-month resistance is now being engaged. Price is attempting to push above it, but the current candle is still developing — small-bodied so far, which is typical during early phases of structural tests on the weekly timeframe (WTF).
🟧 Just above lies a wick-based hindrance — a level that previously reacted with strong rejection. It's also where the current active CT had its last struggle, making it a structurally relevant zone, not something to ignore.
The base that formed in the ₹270–290 region stands out — multiple rejections without deeper breakdowns, a sign of demand stability. Volume expansion this week is notable — especially after 252 days of subdued activity — marking a shift in participation worth observing.
📌 This is not a prediction. Not a forecast. Not a trading call.
Just a structural walkthrough of what price is doing — and where attention has historically been paid.
Let the price write the story — our job is to read structure, not write headlines.
ROTOROTO is showing good strength and currently trading above previous resistance line. It is in to consolidation phase. It seems like accumulation has been observed in recent sessions. Now as long as it is closing above 279 then ROTO is very strong and available at very good risk-reward. One may expect 12% to 21% in next rally once it comes from consolidation phase.

Samvardhana Motherson BreakoutMOTHERSON Stock Analysis
MOTHERSON stock is breaking out again on the monthly chart after previously reaching a new all-time high and then declining. It recently broke the trend-line with good buying pressure. The target could be the all-time high or lower, but it may take a few months to reach if things go well. Stop-loss should be set based on individual risk appetite.
Index Inclusion : Part of NIFTY NEXT 50 and NIFTY 100 indices, indicating significant market presence.
Financial Highlights:
- Revenue Growth : Consistent increase over recent quarters, reaching Rs 113,662 crore in Mar 2025.
- Net Profit : Also rising, with Rs 3,618 crore in Mar 2025.
- EPS : Improved to Rs 5.50 in Mar 2025.
- Annual Revenue & Profit : Steady growth over the past five years, with revenue surpassing Rs 113,662 crore and net profit over Rs 3,618 crore in 2025.
Financial Performance:
- Profit Margins : Net profit margin around 3.18% in Mar 2025.
- Valuations : P/E ratio at approximately 23.81, indicating moderate valuation.
- Debt Levels : Debt-to-equity ratio at 0.42, reflecting manageable debt.
- Cash Flow & Balance Sheet : Operating cash flow remains strong; assets and liabilities Show growth aligned with revenue expansion.
These financial insights are sourced from Moneycontrol.
Conclusion :
Motherson International shows a consistent growth in revenue and profits, with stable financial ratios and manageable debt levels. Its inclusion in major indices and recent financial performance suggest it remains a significant player in its sector. However, the recent stock decline indicates market caution, so investors should monitor market sentiment closely.
This is for educational purposes only and not a buy or sell recommendation.

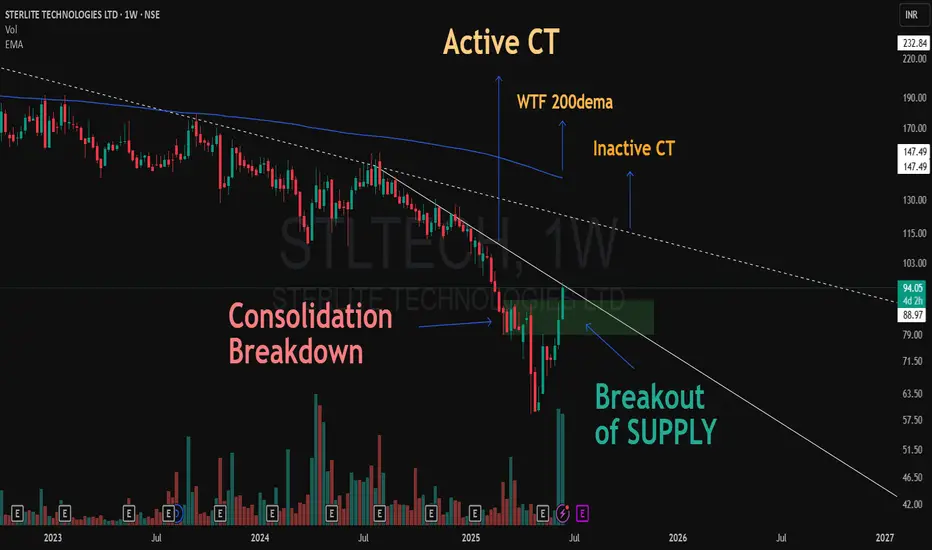
From Breakdown to Breakout: A V-Shaped Surprise!This chart of Sterlite Technologies (W1) tells a compelling price action story:
📉 The stock initially consolidated at a demand zone, only to break down sharply, flipping that zone into a fresh supply area.
💥 What followed was a strong V-shaped recovery, accompanied by significant volume expansion.
🚀 The reclaimed supply zone was decisively taken out, leading price right into the Active Counter Trendline (CT).
🔁 This Active CT now stands as a key structure; the stock needs to form a higher low near the reclaimed demand zone for structural strength.
⚠️ Ahead, we have two higher-timeframe resistances in sight:
📏 An Inactive Weekly CT (dotted)
📡 The WTF 200 DEMA, a major trend filter
While this is not a call or forecast, the shift in structure, volume, and reclaiming of supply tells a story of possible trend transition — something worth keeping on the radar.
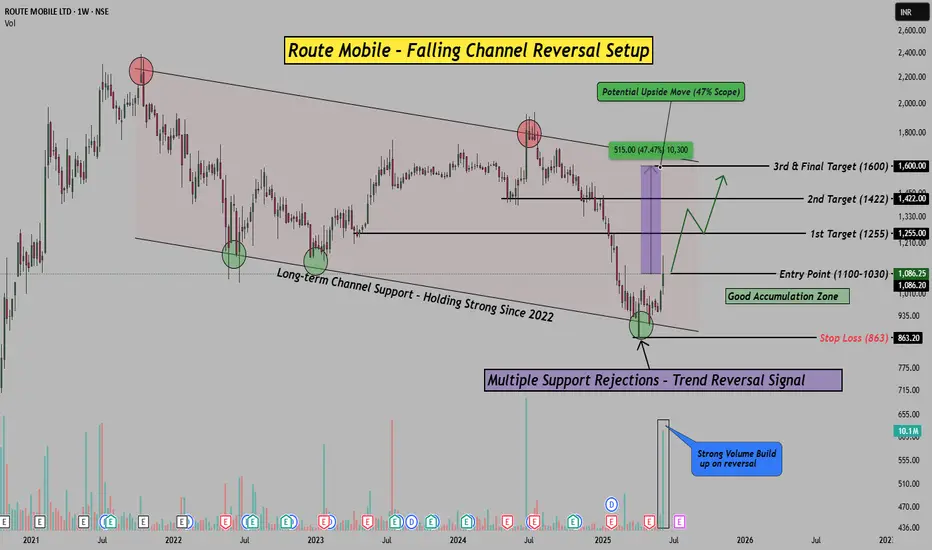
47% Potential Upside in Route Mobile? Channel Reversal Analysis!Hello Everyone, i hope you all will be doing good in your life and your trading as well! In today's post, i have brought a very interesting reversal setup on Route Mobile Ltd.
After spending over 2 years inside a falling channel , the stock has recently shown a sharp bounce right from the long-term channel support , which has held strong since 2022. Not just that, this bounce came with a strong volume spike , hinting at fresh buying interest.
The current price action structure is clearly indicating a potential trend reversal from the lows. I have marked a Good Accumulation Zone between (1100-1030) , where smart money seems to have stepped in. If this setup works out, I am looking we can see good spike in coming few weeks, Please check chart above to know about the targets.
To manage risk, I have kept a safe Stop Loss at 863 , which is approx 12% downside , while potential upside is over 47% . That gives us a solid risk-reward structure for positional traders.
Technicals Match Fundamentals:
Route Mobile is a strong player in global cloud communications, working with big names across the world. Long-term fundamentals remain stable, and the chart now supports a technical reversal.
If you enjoy such chart-based trade setups backed by structure and logic, don’t forget to LIKE & FOLLOW for more.
Disclaimer: This idea is purely educational. Please consult your advisor before investing.
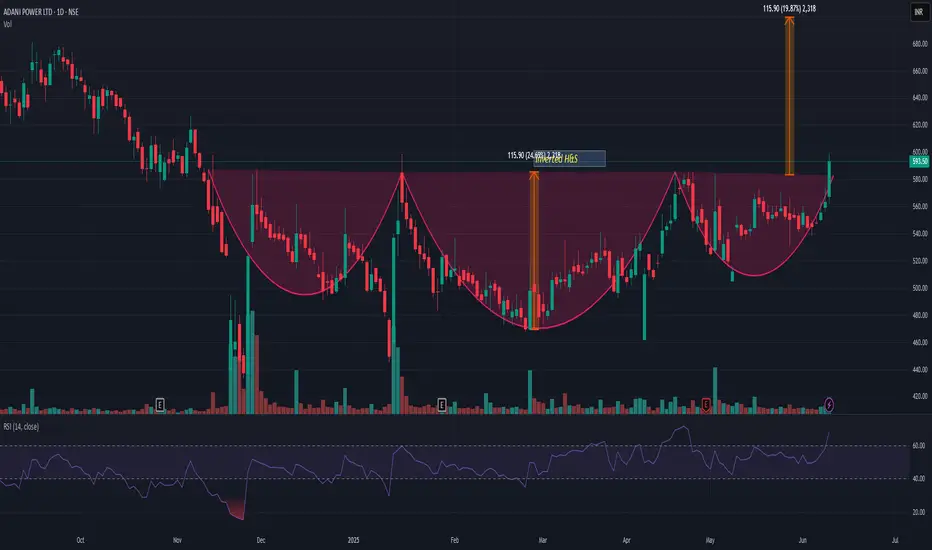
ADANIPOWERADANIPOWER has given inverted H&S breakout with very good volume. All ADANI stocks showing a strength. If we look at the pattern then it may add more 18-20% from here. My view may change we it closes below 540.
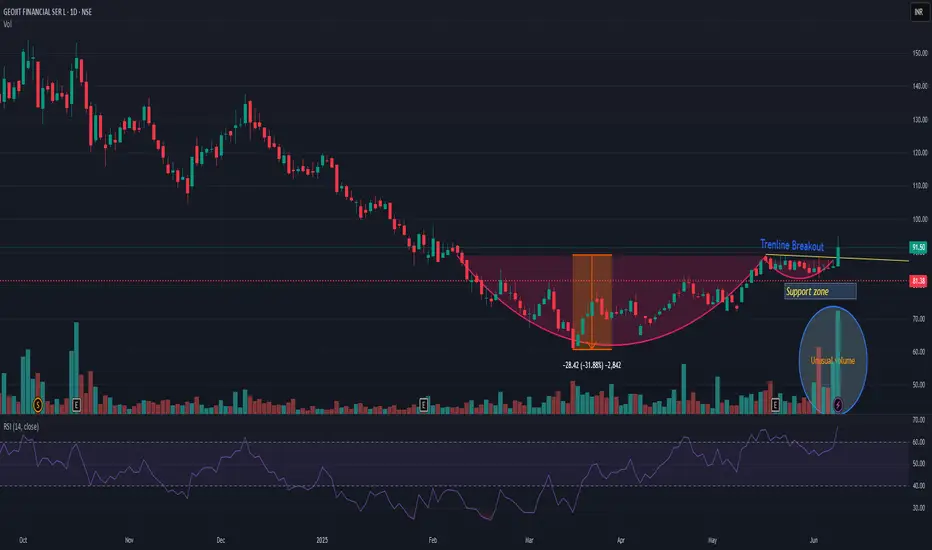
GEOJITFSLGEOJITFSL showing strength and has given short term breakout. Cup and handle pattern has also been observed. Now if I see pattern target then 25-30% up side is possible. Since September highest volume also observed today. My view will be changed if it closes below 81. Risk reward is quite in favor.
BANKINDIABANKINDIA is currently trading above resistance breakout and also recently has shown Inverted H&S breakout as well. Volume in recent session has been increased. If we check pattern target then it has a potential to go up to 160-70 level. I may change my view if it closes below 120. In recent time I have observed traction in all PSU banking stock. Is it something that we don't know!! Chart is indicating something to be watched very closely. Keep it on radar.

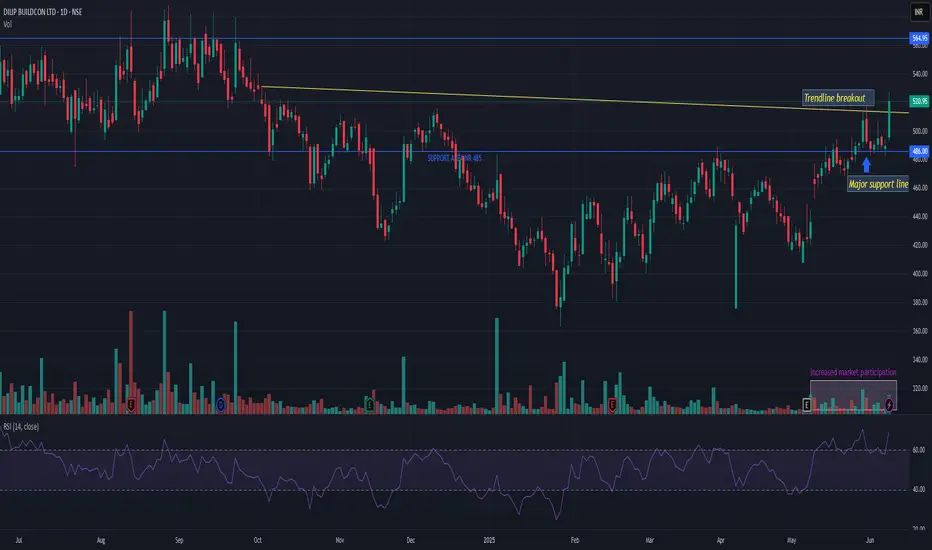
DBLDBL showing strength after so long. Now fresh volume may push it towards all time breakout. Near 560 level it may face resistance but if in case it successfully sustains above that then it has a potential to do wonder in span of 6-12 months. It can go up to 775 to ATH even. Fundamentally too showing good strength in recent quarters. All the factors are currently supporting. My view will be changed if it breaks 480 and closes below it. Track it closely.
DEMAND ZONE TRADE SETUP📈 AVENUE SUPERMARTS (DMART) – DEMAND ZONE TRADE SETUP
📆 Date: June 5, 2025
🔍 Timeframe: 15-Minute Chart
Chart Overview:
DMART witnessed a sharp breakout supported by rising volume and faced resistance near 4240. After this move, the price is retracing, offering a possible re-entry near a fresh demand zone.
Wait for price action confirmation inside the zone
Volume analysis adds confidence to the reversal
Risk management is key – always use SL
👉 Found this useful? Hit Follow to stay updated with breakout setups, educational content, and trade-ready ideas.
Let's grow smarter, together! 💡📊
Leave your comments/feedback(it will help)

HINDZINC HINDZINC has given trendline breakout with very good volume. On upperside it may face resistance near 540-45 level and lower side support can be seen near 455 levels. It has given breakout on weekly as well and seems momentum may continue. Risk reward is quite in favor.

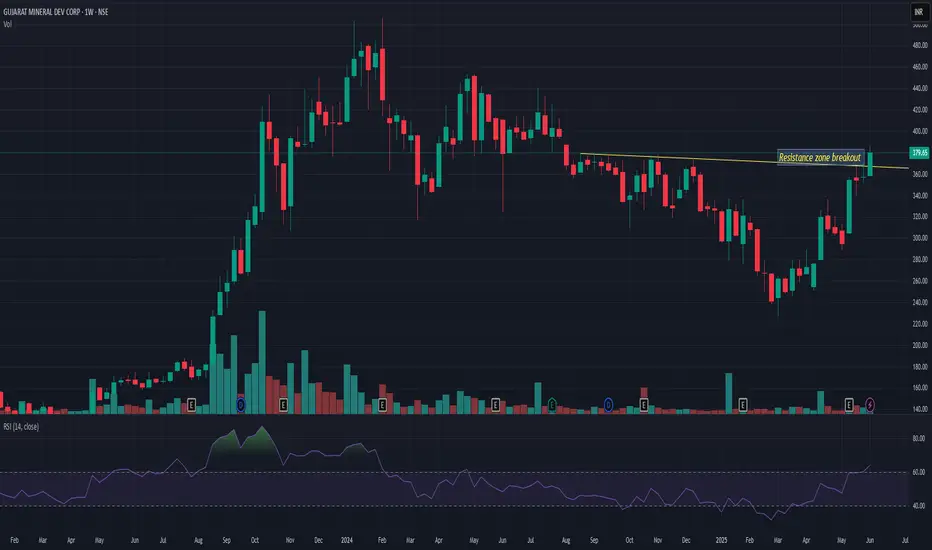
GMDCLTD GMDCLTD seems very strong on weekly charts. Shown strong momentum in recent trading days. And closing above 200 MA since last 5-7 sessions. Now if it closes above 385 then again it may resume its uptrend and may go up to 460 levels from here. 350 is very strong support. So closing below this may change my view
Inside Bars After High Volume – CERA Setting Up Near Key CT📌 Timeframe: Weekly (WTF)
📌 Type: Technical Observation / Swing Structure
📌 Concept: Counter Trendline Breakout Setup
CERA is currently navigating a highly constructive zone from a swing trading lens. Here's what's developing technically:
🔹 Higher Low Formation:
The stock has established a higher low structure, with the white internal trendline offering visible support across recent weeks. Interestingly, this aligns perfectly with the 200-period EMA on the weekly timeframe, enhancing its significance as a dynamic support layer.
🔹 Volume Clues:
Two of the highest volume candles on the weekly chart have now been followed by inside bars, a potential sign of absorption or base building. This tightening within volume zones signals institutional interest and a possible buildup phase.
🔹 Supply Zone Identified:
An overhead supply (marked in orange)
🔹 EMA Context: The blue 200 EMA further reinforces the idea of Supportive price behavior around this line validates its role.
🔍 This post is for educational discussion only. No recommendation or forecast is implied. Please conduct your own due diligence.

Price Action Case Study: Weekly Price action chart of SIGACHI 🔹 Key Structural Elements:
-White Solid Line: Primary Counter-Trendline (CT) connecting multiple swing highs, acting as dynamic resistance over several months.
-White Dotted Lines: Hidden supply lines derived from intermediary highs, often acting as secondary resistance.
-Yellow Lines: Higher timeframe resistance zones (MTF) — offering confluence markers for potential supply zones ahead.
🔹Volume Expansion:
The breakout candle is supported by significant volume (~36M), indicating strong participation. Volume here acts as a confirmation trigger, suggesting institutional interest or broad-based buying.
🔹Structure:
The breakout occurs after an extended consolidation and a series of higher lows.

Massive Breakout + Volume Surge! KEC Looks Ready to Explode📌 Technical Breakdown:
🔹 CT (Counter-Trendline): A clear downward-sloping white dotted CT has been broken with a powerful bullish candle.
🔹 Base Formation: A strong accumulation zone (green zone) is evident where higher lows were formed, indicating demand absorption.
🔹 200 DEMA: The price cleanly breaks above the 200-day exponential moving average, which often acts as a major dynamic resistance.
🔹 Higher Low Structure: The recent price action formed a higher low, validating strength before the breakout.
🔹 Volume Confirmation: Recent candles show a surge in volume, confirming institutional participation and accumulation during the base.

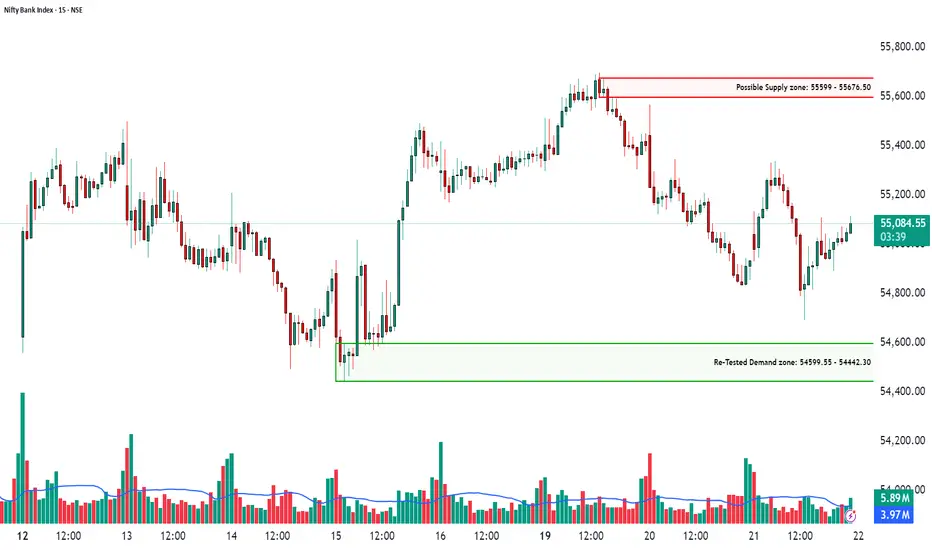
Supply & Retested Demand Zone in Play!🟣 Bank Nifty Index – Supply & Retested Demand Zone in Play! | 15-Min Chart Breakdown
📅 Date: May 21, 2025 | 🕒 Timeframe: 15-Minute
Hello Traders 👋
Today's Bank Nifty chart presents a textbook scenario of supply rejection and demand zone defense. These key zones could drive the next directional move, especially as price hovers in a narrow intraday range after sharp volatility earlier in the session.
🔲 Possible Supply Zone: 55,599 – 55,676.50
This zone formed after a strong rally got rejected with aggressive selling. The wick rejections and follow-up red candles confirm the presence of institutional sellers. If price revisits this level, look for shorting opportunities only with confirmation like bearish engulfing or volume spike.
🔲 Re-Tested Demand Zone: 54,599.55 – 54,442.30
A powerful base that sparked a strong reversal rally. The demand zone was successfully retested on May 21 with clear buying interest. Buyers defended this zone again, forming a bullish rejection wick on rising volume – indicating accumulation.
📊 Volume Context:
✅ Spike in volume seen during the bounce from the demand zone – bullish strength confirmed.
✅ Low volume chop as price consolidates near 55,000 – suggests a bigger move is brewing.
📌 Watch for a volume breakout above 3.5M to validate any directional move.
🧠 What Should Traders Watch For?
Short Trade Setup near 55,600–55,675: Look for rejection candles + selling volume.
Long Trade Setup near 54,600–54,450: Wait for bullish confirmation + rising volume.
Avoid entering mid-range without confirmation – it’s a trap zone.
Respect the supply and demand boundaries – this is a range-to-breakout transition phase.
📌 Note: Supply and demand zones are not magic levels—they are high-probability areas where past buyer/seller action can repeat. Combine with price action and volume for precision entries.
💬 Drop your thoughts, questions, or your zone levels below. Follow for more real-time chart education and actionable breakdowns!
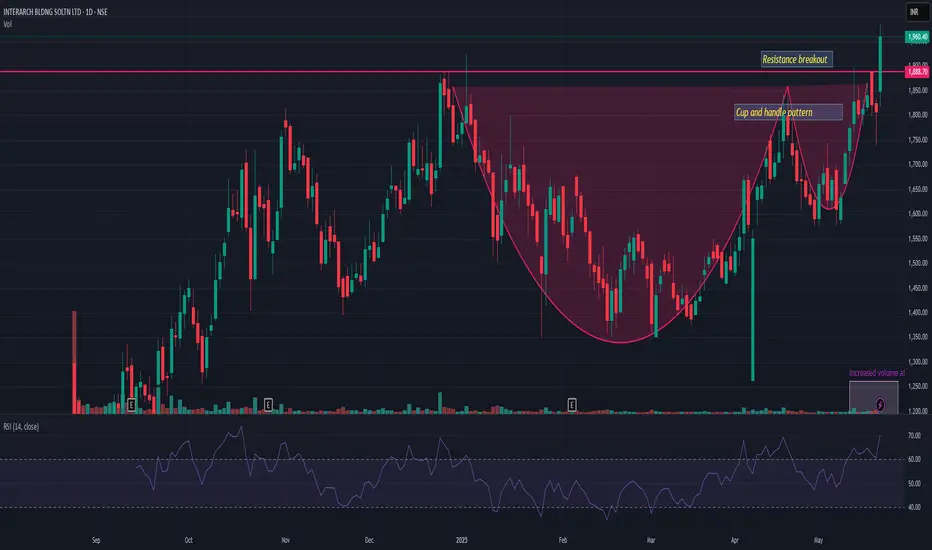
INTERARCHINTERARCH has given resistance breakout with decent volume. Posted very good result on both front QoQ and YoY. Cup and handle pattern also observed and given recent breakout of the same. Closing below 1750 may change the view. And on upper side pattern resistance may be possible near 2300. Looks very strong for momentum
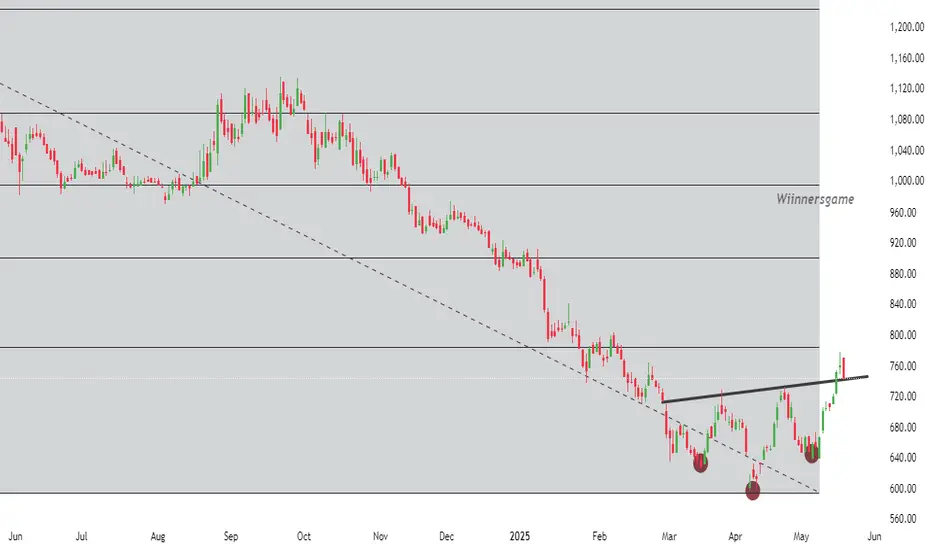
TATA TECH- BULLISH BREAKOUT HAPPENINGTATATECH 740, has given inverse H&S breakout, bullish breakout after long consolidation. Stock has retested its breakout zone. Fresh momentum will continue if sustain above 760 for at least 850-900 levels. Volume and momentum is not supportive for time being
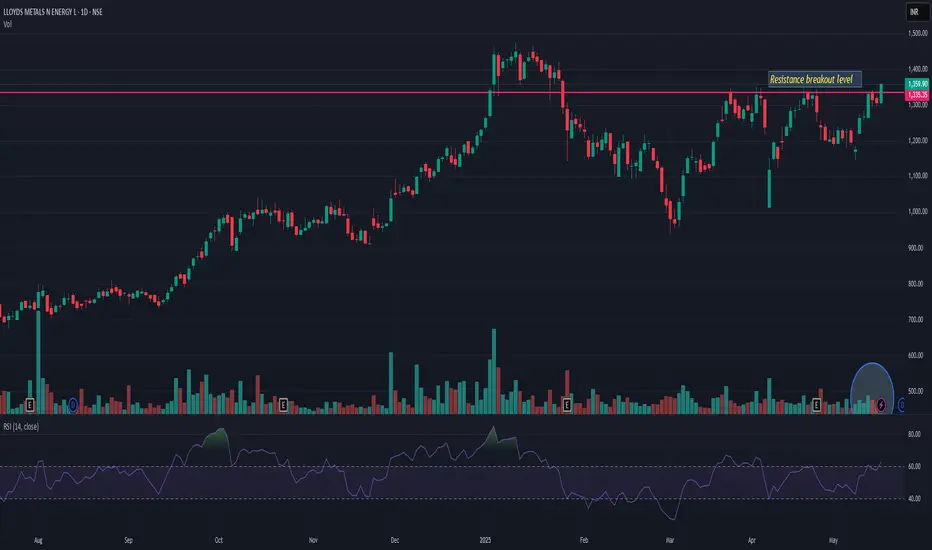
LLOYDSMELLOYDSME showing v good strength and seems like if it sustains above 1355 then it may start a new rally from here. Showing a very strong momentum on daily as well as weekly. 1260 is strong support. So closing below it may change my view.