Garuda Construction – Cup & Handle Breakout | Swing Trade PlanGaruda Construction has given a textbook Cup & Handle breakout backed by strong volume and solid fundamentals.
Technical Analysis
A Cup & Handle pattern has formed with a neckline breakout above ₹200.
Stock closed strongly at ₹216.33 (+9.66%) with massive volume (7.5M vs 3.1M avg) - confirms institutional buying.
Price is trading above 20 EMA (₹200) and 50 EMA (₹188) → strong uptrend.
Weekly timeframe also shows a fresh breakout, adding higher timeframe confluence.
Structure remains bullish as long as it holds above ₹200 demand zone.
Fundamental key area
Construction & Engineering segment seeing strong order inflows, aiding medium-term growth. Strong QoQ Growth: Latest quarter (Jun-25) revenue jumped 55% to ₹125 Cr.
ROE ~29%, OPM ~29% → excellent efficiency.
Balance Sheet: Debt levels appear very low, improving stability.
Valuation: Mid-cap with growth momentum, attractive vs large-cap peers.
Swing Trade Plan
Entry Zone: ₹212–216
Stop Loss: ₹198 (below neckline + demand zone)
Targets:
T1: ₹225 (early booking)
T2: ₹240 (swing continuation)
T3: ₹260 (Cup & Handle measured move)
Risk–Reward: Up to 1:2.4
Note: This is an educational swing trade analysis based on price action + fundamentals. Not financial advice — do your own due diligence before trading.
VOLUMEBREAKOUT

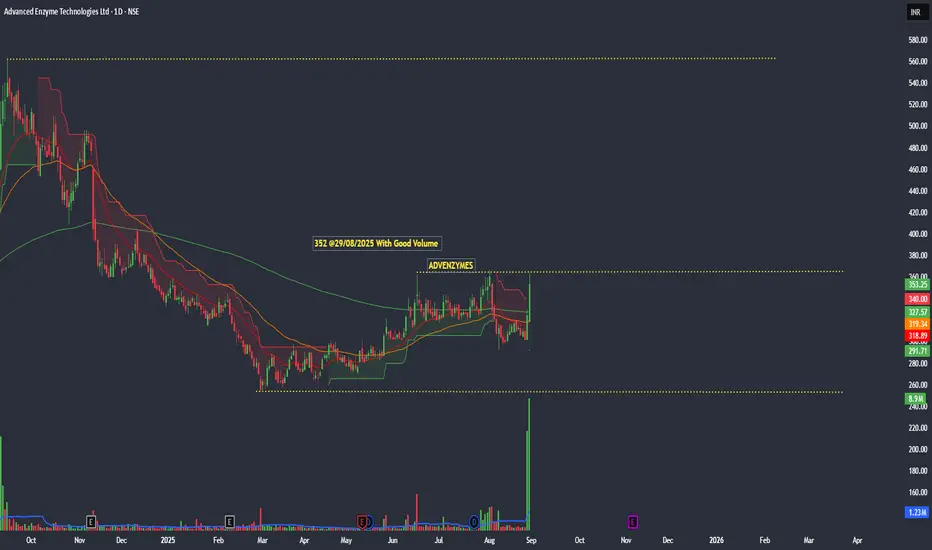
Advanced Enzyme Technologies Ltd_ Short-termAdvanced Enzyme Technologies Ltd (ADVENZYMES) – Technical Analysis
Current Price: ₹355–356 (as of Aug 29, 2025)
Stock has rallied +18% in 2 sessions, showing strong momentum.
Price has broken above key resistance at ₹336 (pivot), turning it into support.
📈 Indicators & Momentum
Moving Averages (MA20/50/200): Price is trading above all major EMAs, confirming bullish trend.
RSI (14): ~68 → approaching overbought zone, but still has room to push higher.
ADX (14): >30 → trend strength is strong and valid.
Volume: Delivery volume spiked 7.5x above average, confirming institutional interest.
🧭 Chart Structure
Breakout above ₹336 pivot signals start of a fresh uptrend.
A daily close above ₹380 may open the path toward ₹410 – ₹455 zone.
Watch for consolidation near ₹350–₹360 before next leg.
⚡ Trading View
Bias: Bullish as long as price stays above ₹336.
Short-Term Target: ₹380 → ₹410
Medium-Term Target: ₹455
Invalidation: Close below ₹336 pivot may weaken trend.
Disclaimer: This is a technical analysis study for educational purposes only — not investment advice. Always do your own research before trading.
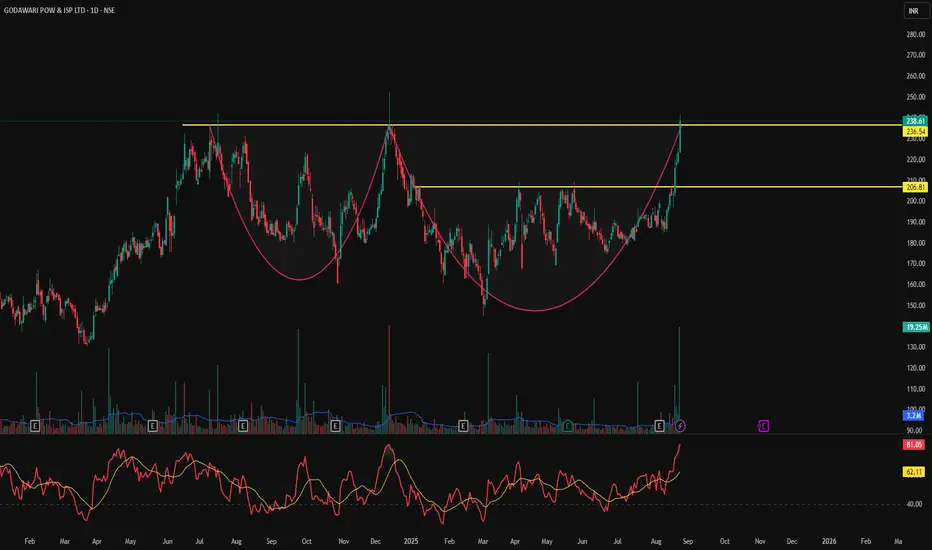
GPIL - Cup & Handle Breakout | Daily Chart📊 GPIL – Cup & Handle Breakout with Explosive Volume | RSI > 80
📅 Chart Date: August 24, 2025
📍 CMP: ₹238.61 (+6.91%)
📈 Symbol: NSE:GPIL | 1D Timeframe
🔍 Technical Analysis
☕ Cup & Handle Breakout
A multi-month Cup & Handle pattern has been completed.
Price gave a strong breakout above the neckline zone ₹206.81.
Next supply zone is around ₹236–₹240, which is being tested.
💥 Volume Confirmation
Relative Volume (RVol): 842% 🔥
Today’s volume 19.25M vs avg 3.2M — heavy institutional buying.
📈 RSI (14, close): 81.05
Stock is in the overbought zone, indicating strong momentum.
Short-term pullback possible, but trend remains bullish above breakout.
📌 Key Levels
Breakout Zone (Support): ₹206.81
Immediate Resistance: ₹236–₹240
Next Target Levels: ₹260 / ₹280
Stoploss for Swing Traders: ₹200
Entry on Retest: ₹210–₹215
Stoploss: ₹200
Targets: ₹260 / ₹280
⚠️ Disclaimer: This is an educational chart setup and not trading advice. Please conduct your own research and risk management.
📣 Follow @PriceAction_Pulse for more such clean breakouts and chart pattern analysis!
🔁 Drop a comment if GPIL is on your radar for the next breakout rally 📈
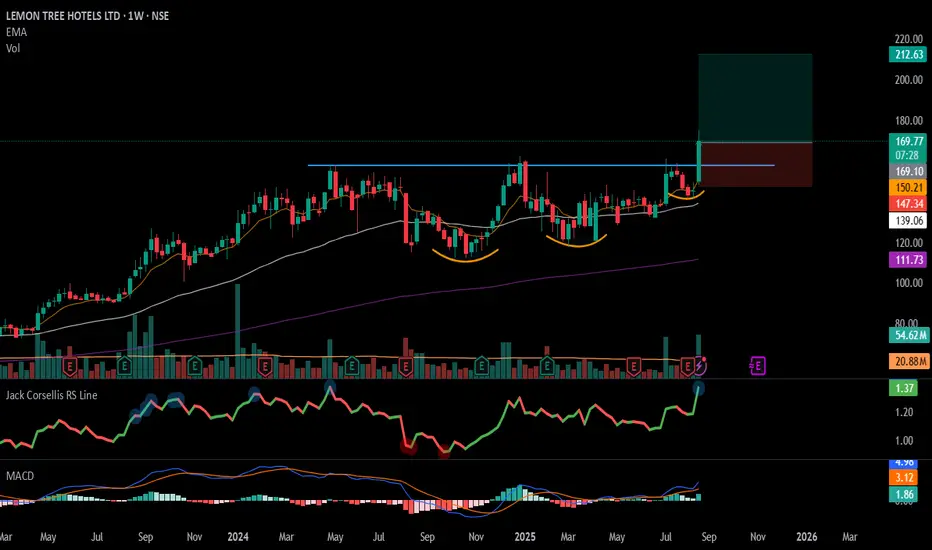
#LEMONTREE - VCP Breakout in Weekly Time Frame Script: LEMONTREE
Key highlights: 💡⚡
📈 VCP Breakout in Weekly Time Frame
📈 Volume spike during Breakout
📈 MACD Bounce
📈 Can go for a swing trade
BUY ONLY ABOVE 170 DCB
⏱️ C.M.P 📑💰- 169.70
🟢 Target 🎯🏆 – 28%
⚠️ Stoploss ☠️🚫 – 13%
⚠️ Important: Market conditions are Okish, Position size 50% per Trade. Protect Capital Always
⚠️ Important: Always Exit the trade before any Event.
⚠️ Important: Always maintain your Risk:Reward Ratio as 1:2, with this RR, you only need a 33% win rate to Breakeven.
✅Like and follow to never miss a new idea!✅
Disclaimer: I am not SEBI Registered Advisor. My posts are purely for training and educational purposes.
Eat🍜 Sleep😴 TradingView📈 Repeat 🔁
Happy learning with MMT. Cheers!🥂
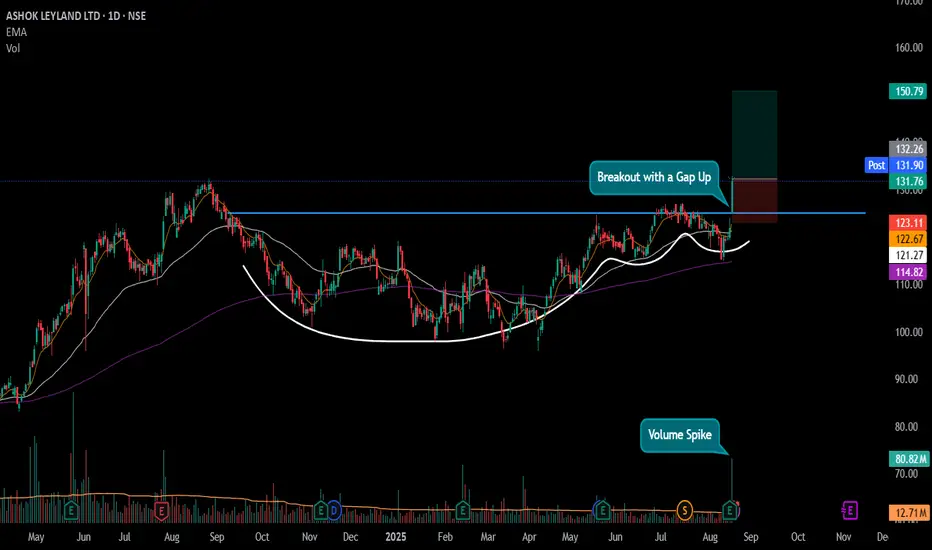
#ASHOKLEY - VCP Breakout in Daily Time Frame Script: ASHOKLEY
Key highlights: 💡⚡
📈 VCP Breakout in Daily Time Frame
📈 Price gave a Gap Up Breakout
📈 Volume spike during Breakout
📈 MACD Bounce
📈 Can go for a swing trade
BUY ONLY ABOVE 132 DCB
⏱️ C.M.P 📑💰- 131.90
🟢 Target 🎯🏆 – 14%
⚠️ Stoploss ☠️🚫 – 7%
⚠️ Important: Market conditions are Okish, Position size 50% per Trade. Protect Capital Always
⚠️ Important: Always Exit the trade before any Event.
⚠️ Important: Always maintain your Risk:Reward Ratio as 1:2, with this RR, you only need a 33% win rate to Breakeven.
✅Like and follow to never miss a new idea!✅
Disclaimer: I am not SEBI Registered Advisor. My posts are purely for training and educational purposes.
Eat🍜 Sleep😴 TradingView📈 Repeat 🔁
Happy learning with MMT. Cheers!🥂
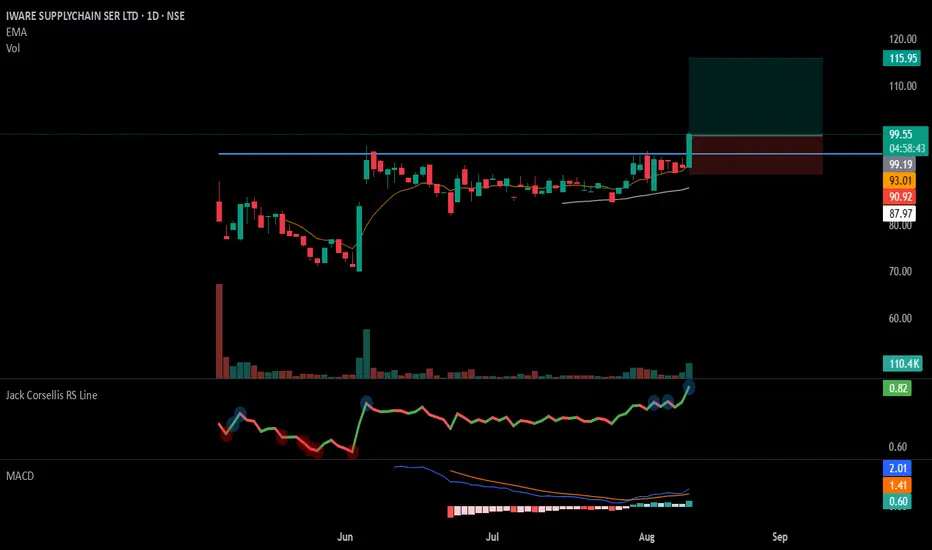
#IWARE - IPO Base BreakoutScript: IWARE
Key highlights: 💡⚡
📈 IPO Base Breakout in Daily Time Frame
📈 Price consolidating near Resistance, then Breakout
📈 Volume spike during Breakout
📈 MACD Bounce
📈 Can go for a swing trade
BUY ONLY ABOVE 100 DCB
⏱️ C.M.P 📑💰- 99.55
🟢 Target 🎯🏆 – 16%
⚠️ Stoploss ☠️🚫 – 8%
⚠️ Important: Market conditions are Okish, Position size 50% per Trade. Protect Capital Always
⚠️ Important: Always Exit the trade before any Event.
⚠️ Important: Always maintain your Risk:Reward Ratio as 1:2, with this RR, you only need a 33% win rate to Breakeven.
✅Like and follow to never miss a new idea!✅
Disclaimer: I am not SEBI Registered Advisor. My posts are purely for training and educational purposes.
Eat🍜 Sleep😴 TradingView📈 Repeat 🔁
Happy learning with MMT. Cheers!🥂
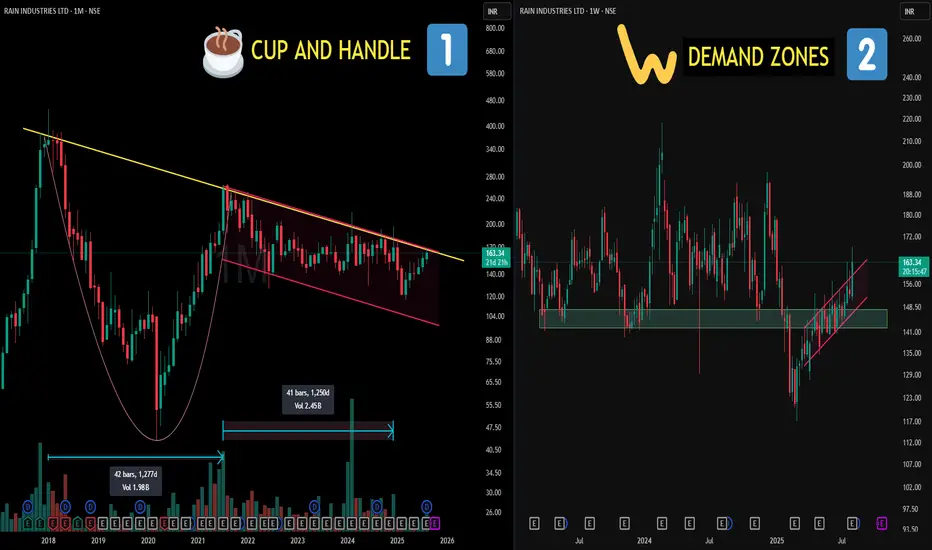
2500 Days of Structure? CUP & HANDLE Decoded!📌Left Side (Chart 1: Monthly TF)
🧠 Cup and Handle Pattern:
A bullish continuation pattern that resembles the shape of a tea cup on longer timeframes. The “cup” shows a gradual rounded bottom (accumulation phase), followed by a smaller downward or sideways "handle" (last shakeout), often before strength resumes. It reflects long-term accumulation and investor confidence.
📈 Cup Duration in this case : 1277 days (approx. 3.5 years)
🧠Parallel Channel (Handle):
A price structure where two trendlines contain price movement within a defined up or down slope. Often marks controlled consolidation or correction — neither side is dominating, until one breaks.
📈 Handle Formation in this case : 1250 days (approx. 3.4 years)
📌 Right Side (Chart 2: Weekly TF)
🧠 This is the zoom lens on the handle zone:
📍A key Demand Zone was breached temporarily… but reclaimed with conviction.
📍 Strong re-acceptance and consolidation followed, showing organized price behavior.
📍 The upper trendline of the parallel channel is where price recently pushed through — again, no forecasting — just a structural breakout from a well-defined zone.
Matrimony-A weekly breakout for ATH target is done!Matrimony has finally given weekly closing above its weekly supply zone of 730-750.
Stock can fly if it manages to sustain above this zone.
ATH target can be expected. Not a recommendation.

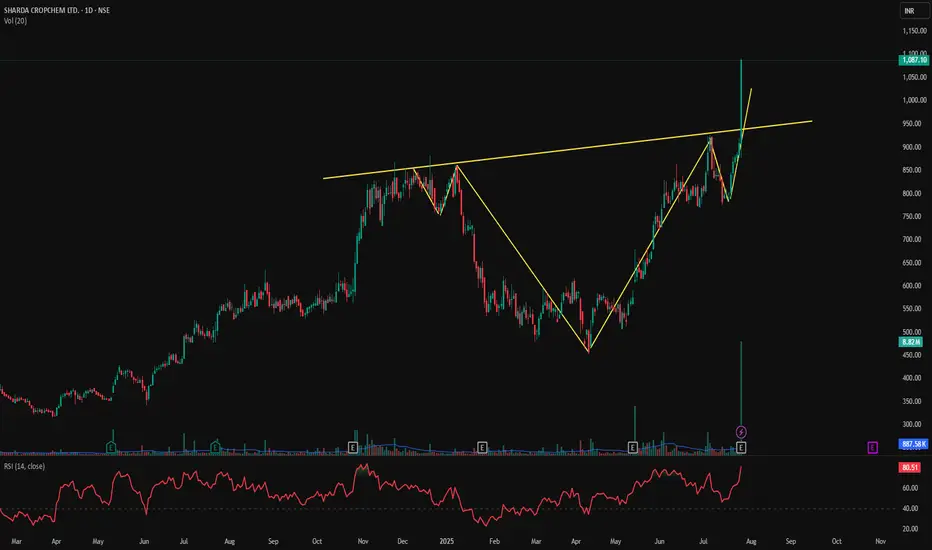
SHARDACROP – Cup & Handle Breakout with Explosive Volume📊 SHARDACROP – Cup & Handle Breakout with Explosive Volume | RSI > 80
📅 Chart Date: July 26, 2025
📍 CMP: ₹1,087.10 (+19.63%)
📈 Symbol: NSE:SHARDACROP | 1D Timeframe
🔍 Technical Analysis Breakdown
☕ Cup and Handle Breakout
A clear Cup and Handle formation has completed.
Breakout above the neckline (~₹940) with a massive bullish candle.
💥 Volume Spike
Volume surged to 8.82M, against the 20-day average of ~887K — institutional buying visible.
This is the highest volume in months, confirming the breakout strength.
📈 RSI (14, close): 80.51
Momentum is extremely strong, entering the overbought zone — may signal continuation or short-term pullback before resuming rally.
📌 Breakout Level: ₹940
📌 Immediate Resistance: ₹1,100–₹1,150
📌 Support on Retest: ₹940–₹960
🎯 Trade Setup
Entry on Retest: ₹960–₹980
Stoploss: ₹920 (below handle base)
Target: ₹1,150 / ₹1,200+
Risk Level: Moderate–High (due to RSI overbought, but pattern is strong)
⚠️ Disclaimer: This is an educational chart setup and not trading advice. Please conduct your own research and risk management.
📣 Follow @PriceAction_Pulse for more such clean breakouts and chart pattern analysis!
🔁 Drop a comment if SHARDACROP is on your radar for the next breakout rally 📈
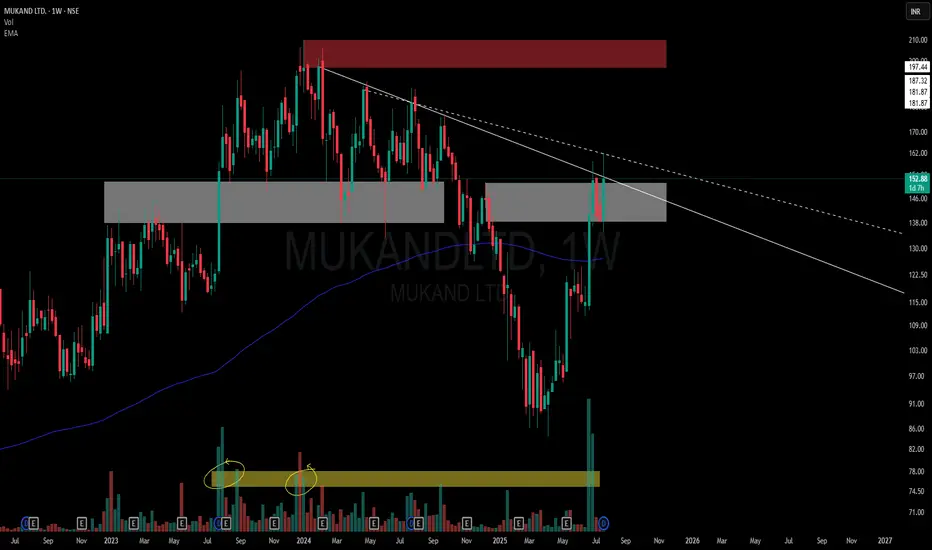
Simple Price Action Chart ( Observations )This chart is a visual case study of how price behaves when historic supply meets structural compression.
📌 Structural Highlights:
⚪ Primary Descending Trendline – Clean and persistent resistance from the top, still unbroken in a meaningful way.
▫️ Secondary Dotted Trendline – Shorter-term descending pressure also in play, giving us a dual resistance dynamic.
🟫 Strong Overhead Supply – Marked in red, this zone has held significance multiple times in the past.
⚪ Active Flip Zone – A broad grey zone showing a role reversal from supply to demand, currently interacting with price again.
📊 Volume Belt:
-Highlighted Yellow Volume Belt at the bottom shows repeated heavy interest.
🧠 Not a call – Just a neutral lens on structural context and how the market respects its own footprints.
Chemfab Alkalis Ltd. at Buy Support. CMP 1124Chemfab Alkalis Ltd. at Buy Support. CMP 1124.
Breakout above 1183.50 closing basis.
Expected levels of 1466.
Reversal from strong support zone with volumes.

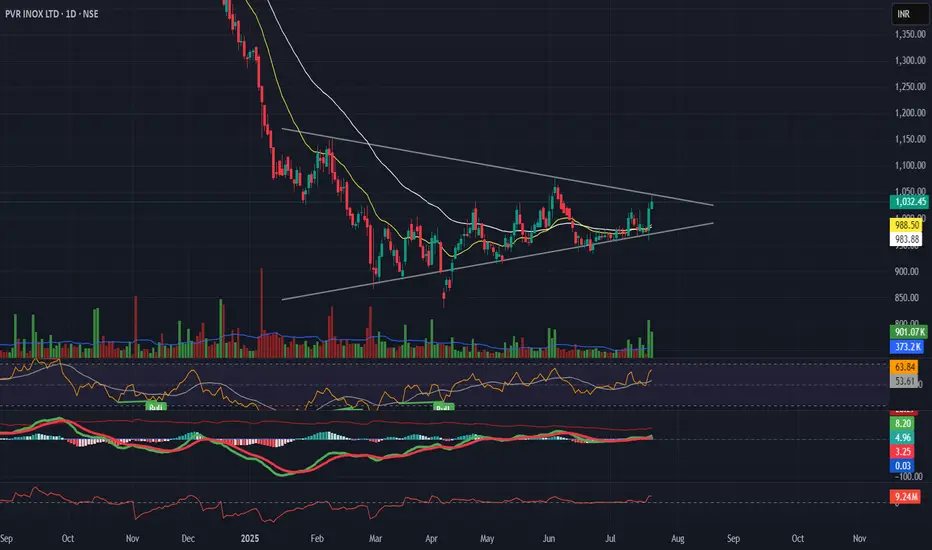
PVR INOX – Symmetrical Triangle Breakout | July 2025📊 PVR INOX – Symmetrical Triangle Breakout | July 2025
A potential breakout setup is forming on both the daily and weekly charts in PVR INOX:
🔹 Structure: Symmetrical triangle on both timeframes, showing price contraction near ₹1040
🔹 Momentum: RSI holding above 50, MACD turning positive
🔹 Volume Spike: Breakout supported by increasing volume
🔹 Sector Rotation: Media & Entertainment sector showing improving relative strength
🔹 Macro Narrative: Theme of rising screen expansion + easing inflation supports business growth
---
📌 Strategy Overview:
• Entry on breakout above ₹1040
• Target 1: ₹1080
• Target 2: ₹1126
• Stop-loss: ₹955 (below pattern support)
Timeframes Aligned:
Weekly: Structure intact with price near resistance
Daily: Ready for breakout
Hourly: Momentum building near apex
---
🧠 Conclusion:
A multi-timeframe setup with technical + narrative alignment. Watch for confirmation with strong candle + above-average volume.
Big Move Coming? Watch This Classic VCP Setup on Shriram FinanceHello everyone, i hope you all will be doing good in your trading and your life as well. Today i have brought a setup which name is VCP (Volatility Contraction Pattern) is one of the most powerful base setups, where the price contracts in multiple tight ranges, showing controlled strength. It signals that supply is drying up and the stock is getting ready for a strong move, usually a breakout. What makes it special is the combination of tightening price with lowering volume , and that's exactly what we can observe in Shriram Finance right now.
The stock has taken multiple supports from key EMAs like 9, 21, and 50 during this entire consolidation, a classic VCP sign. With each dip being bought quickly and bounce getting tighter, the stock is preparing for a potential breakout move.
Keep this one on radar , structure is clean, volume behavior is ideal, and if momentum comes, VCP patterns don’t disappoint.
For levels and risk-reward, please refer the chart above.
Disclaimer: This analysis is for educational purposes only. Please consult a financial advisor before making investment decisions.

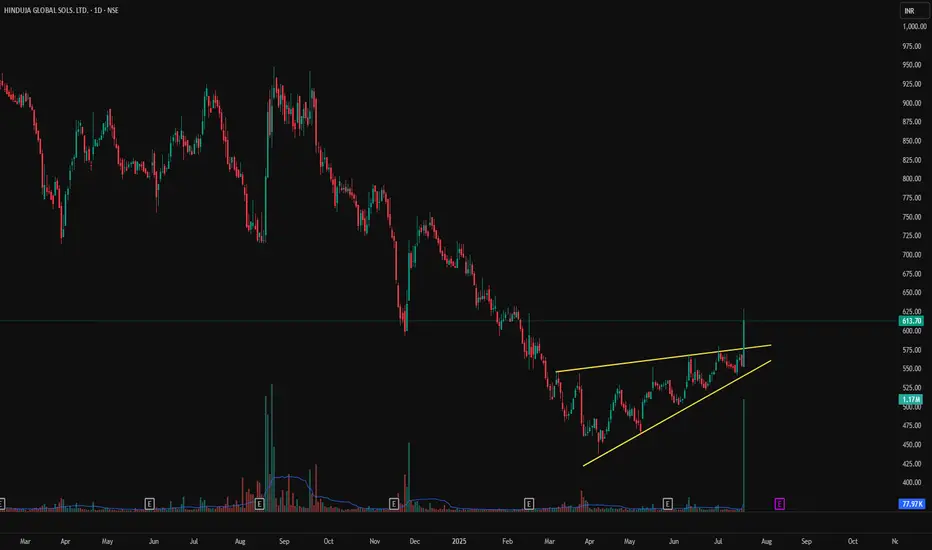
HGS - Rising Wedge Breakout on Volume Spike | Daily Chart📊 HGS – Rising Wedge Breakout on Volume Spike | RSI Above 70 | Fresh Bullish Momentum
📅 Chart Date: July 17, 2025
📍 CMP: ₹613.70 (+10.72%)
📈 Symbol: NSE:HGS | 1D Timeframe
🔍 Technical Analysis Breakdown
🔺 Rising Wedge Breakout
Price broke above the upper resistance of a rising wedge pattern.
Strong confirmation with a wide bullish candle and volume spike.
📊 Volume Surge
Volume: 1.17M against average volume of ~78K
Sudden institutional interest or news-based momentum likely behind the move.
📉 RSI (14, close): 73.03
RSI crossed into overbought territory, showing strong bullish momentum but could warrant caution or consolidation soon.
📌 Support & Resistance Levels
Breakout Zone: ₹580–₹590
Next Resistance: ₹650+ (gap-fill zone from earlier breakdown)
Support: ₹560 (upper trendline of broken wedge)
📌 Key Observations
First strong breakout since months of sideways to bullish accumulation.
Sustained close above ₹590–₹600 will confirm continuation.
Caution if price retraces inside wedge again.
🏁 Trade Setup
Entry: On Retest of ₹590–₹600
Target: ₹650 / ₹675
Stoploss: Below ₹560
Risk Level: Moderate (due to overbought RSI)
⚠️ Disclaimer: This is an educational chart setup and not trading advice. Please conduct your own research and risk management.
📣 Follow @PriceAction_Pulse for more such clean breakouts and chart pattern analysis!
🔁 Drop a comment if HGS is on your radar for the next breakout rally 📈
NAZARA TECHNOLOGIES LTD | Monthly Chart Breakout📊 NAZARA TECHNOLOGIES LTD (NSE: NAZARA) | Monthly Chart Breakout
📅 Date: June 1, 2025
📈 CMP: ₹1,295.10 (+28.04%)
📌 Ticker: NSE:NAZARA
📉 Chart Pattern Insight
🔥 Cup & Handle + Falling Wedge Breakout
Nazara Tech has broken out of a strong Cup & Handle pattern, reinforced by a Falling Wedge breakout — a powerful confluence suggesting a major trend reversal.
🎯 Breakout is confirmed with high volume and a clean monthly candle close above key resistances.
📐 Fibonacci Retracement Levels (From High ₹1678 to Low ₹477)
🔸 38.2% – ₹935.85 (was resistance, now flipped to support)
🔸 50% – ₹1,077.55
🔸 61.8% – ₹1,219.25 (just surpassed – strong bullish confirmation)
🧭 100% – ₹1,678 (All-Time High)
📊 Indicator: RSI + Moving Average Cross (Icon shown)
🔍 RSI is at 71.63 and rising sharply, indicating strong momentum
🔺 RSI crossover above MA confirms bullish strength and trend continuation
🧱 Volume Spike
📈 Volume this month is multi-month high, validating the breakout
🔑 Key Levels
Support: ₹935 (prior resistance, now retest zone)
Immediate Resistance: ₹1,300 (psychological), ₹1,400
Target Zones:
Short-Term: ₹1,450
Medium-Term: ₹1,600+
Long-Term: Retest of All-Time High ₹1,678+
🛡️ SL: ₹935 (monthly close basis)
📌 Trading Plan
Entry: Pullback near ₹1,220–₹1,250 or breakout retest
SL: ₹935 (below 38.2%)
Target: ₹1,450 / ₹1,600+
Time Frame: Positional – Multi-week to multi-month
⚠️ Disclaimer
This analysis is for educational purposes only. Please do your own research or consult a SEBI-registered advisor before investing.

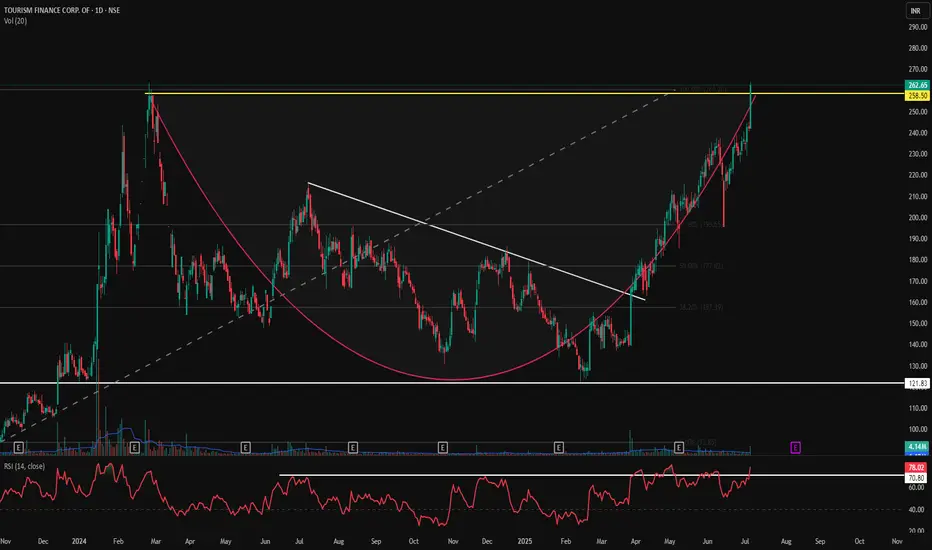
TFCILTD - Massive Cup & Handle Breakout | Daily Chart📊 TFCILTD – Massive Cup & Handle Breakout | Fib 100% Retest | RSI Overbought | Volume Surge | Daily Chart
📅 Chart Date: July 6, 2025
📍 CMP: ₹262.65 (+8.48%)
📈 Symbol: NSE:TFCILTD
🔍 Technical Analysis Summary
☕ Cup & Handle Pattern Breakout
Price broke out above the Cup & Handle neckline near ₹258.50 and hit the Fibonacci 100% extension at ₹262.65.
Clean rounding bottom formation visible, followed by bullish handle and sharp breakout.
📐 Fibonacci Retracement (from swing low ₹93.85 to high ₹262.65)
50.00% – ₹177.02
61.80% – ₹196.65
✅ 100.00% – ₹262.65 (just achieved!)
📈 RSI Indicator (14)
RSI at 78.02, clearly in overbought territory – indicating momentum strength, but a minor pullback is likely.
RSI consistently above 70 for the past few sessions reflects strong trend continuation.
📊 Volume
Volume surged to 4.14M, supporting the breakout. Confirmation of pattern breakout is validated by this volume spike.
🏁 Key Technical Levels
Breakout Zone (Neckline): ₹258.50 ✅
CMP: ₹262.65
Next Resistance: Blue Sky Zone (New Highs)
Support on Retest: ₹258.50 → ₹230.67
Major Support: ₹177.02 (Fib 50%)
💡 Trade Setup Idea
Entry: On breakout confirmation above ₹258.50 or on retest
Stoploss: Below ₹230
Target: Open sky above ₹262 → Trend-following zone
Risk Level: Medium-High (due to overbought RSI)
⚠️ Disclaimer: This is an educational chart setup and not trading advice. Please conduct your own research and risk management.
📣 Follow @PriceAction_Pulse for more such clean breakouts and chart pattern analysis!
🔁 Drop a comment if TFCILTD is on your radar for the next breakout rally 📈
HERO MOTOCORP LTD – TECHNICAL ANALYSIS________________________________________
📈 HERO MOTOCORP LTD – TECHNICAL ANALYSIS
📆 Date: July 15, 2025 | ⏱ Timeframe: Daily Chart
🔍 Educational Breakdown – For Learning & Study Use Only
________________________________________
🔹 Price Action Zones
• 🔴 Top Range (Supply Zone / Resistance): ₹4,486.70
• 🟢 Bottom Range (Demand Zone / Support): ₹4,158.10
Price has recently broken out from a symmetrical triangle pattern, heading toward the marked supply zone. The demand zone at ₹4,158 has been tested multiple times and held firm, acting as the base for this breakout.
________________________________________
🔹 Chart Pattern: ✅
The stock formed a tight triangle consolidation, compressing between a rising support and horizontal resistance. Today’s breakout candle, backed by volume, confirms a bullish resolution of the pattern.
________________________________________
🔹 Reversal Candlestick Patterns
A large bullish engulfing candle has cleared recent highs with strength. Closing near the high, it signals conviction and opens the path for a continued up-move.
________________________________________
🔹 Technical Indicators
• RSI: Crossed above 60 — strength building
• MACD: Positive crossover confirming trend reversal
• VWAP: Price comfortably trading above — supports trend
• Bollinger Bands: Post-squeeze breakout with wide expansion
• Volume: Breakout supported by 20-day volume high — adds strong confirmation
________________________________________
📌 What’s Catching Our Eye:
The volume spike is significant — over 1.76M with breakout from both triangle resistance and VWAP. Add to that a BB Squeeze release, and the setup gets stronger technically.
________________________________________
👀 What We’re Watching For:
If price sustains above ₹4,454, it may move into the next resistance cluster: ₹4,525.97 → ₹4,599.93 → ₹4,730.87. On dips, ₹4,188 and ₹4,158 become important demand zones to monitor for re-entries.
________________________________________
⚠️ Risks to Watch:
A failed follow-up tomorrow or close below ₹4,405 could invalidate the momentum. Also, overbought conditions without volume expansion may lead to a false breakout near ₹4,486.
________________________________________
🔮 What to Expect Next:
If bullish momentum sustains, the stock may first target ₹4,599 and then ₹4,695. Resistance is expected near ₹4,525–₹4,599 range. A clean breakout above ₹4,486 could invite strong follow-up buying.
________________________________________
📊 Trade Plan (Based on Reason and Charts)
🔼 Bullish Trade Setup:
Entry Zone: ₹4,454 – ₹4,465
Stop-loss: ₹4,405.63
Risk–Reward: ~1:1 to 1:2
Reason: Triangle breakout + BB Squeeze + RSI/MACD confirmation + VWAP support
🔽 Bearish Trade Setup:
Only if the price rejects ₹4,486.7 and breaks below ₹4,405:
Entry: Below ₹4,405
SL: ₹4,465
Risk–Reward: ~1:1 to 1:2
Reason: Failed breakout + supply pressure at top range
________________________________________
⚠️ Disclaimer (Please Read):
• This chart is shared for educational purposes only and is not investment advice.
• I am not a SEBI-registered advisor.
• The information provided here is based on personal market observation.
• No buy/sell recommendations are being made.
• Please do your own research or consult a registered financial advisor before making any trading decisions.
• Trading involves risk. Always use proper risk management.
STWP is not responsible for trading decisions based on this post.
________________________________________
💬 Found this helpful?
Drop your thoughts or questions in the comments below ⬇️
🔁 Share this post with your trading community – let them benefit from clean charts, structured setups, and zone-based learning.
✅ Follow @simpletradewithpatience for chart-backed technical analysis that respects price action, demand & supply.
🚀 Trade with patience, trust your charts, and stay clear-headed!
Be Self-Reliant | Trade with Patience | Learn with Charts & Zones 📊
________________________________________

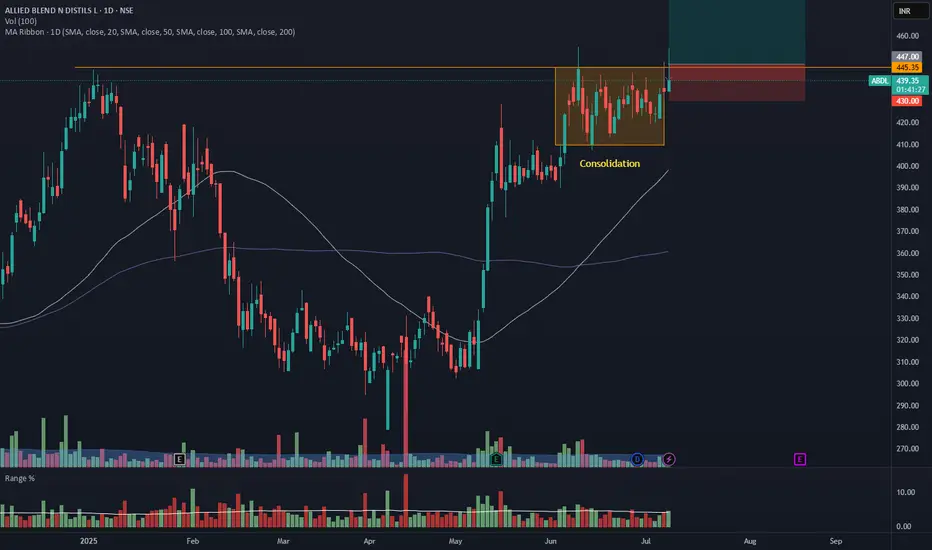
ABDL - Daily Timeframe Breakout Idea (Resistance Zone Break)Allied Blenders and Distillers Ltd. has shown a breakout above a key horizontal resistance level on the daily chart, accompanied by a nearly 2 times volume surge near the breakout zone, as seen earlier, supported by strong momentum.
🔍 Breakout Context:
- Price might break above the ~₹446 horizontal resistance, which had held for over 6 months.
The breakout zone has been supported by 2X volume and a range 1.5X of average near the resistance zone.
- The price is also trading above both the 50- and 100-day SMAs, indicating strong trend continuation.
- This aligns with a bullish continuation setup.
📉 Trade Plan:
- CMP: ₹439.15
- Entry: Near ₹446
- Target: ₹481 (~7.5% upside from CMP)
- Stop-Loss: ₹430
- Risk-Reward Ratio: ~ 1 : 2
📌 Note:
- Look for a confirmation candle to enter the trade.
- Avoid chasing the extended move unless confident in intraday momentum.
⚠️ Disclaimer: This post is for educational purposes only and not financial advice. Always do your research or consult a financial advisor before trading.
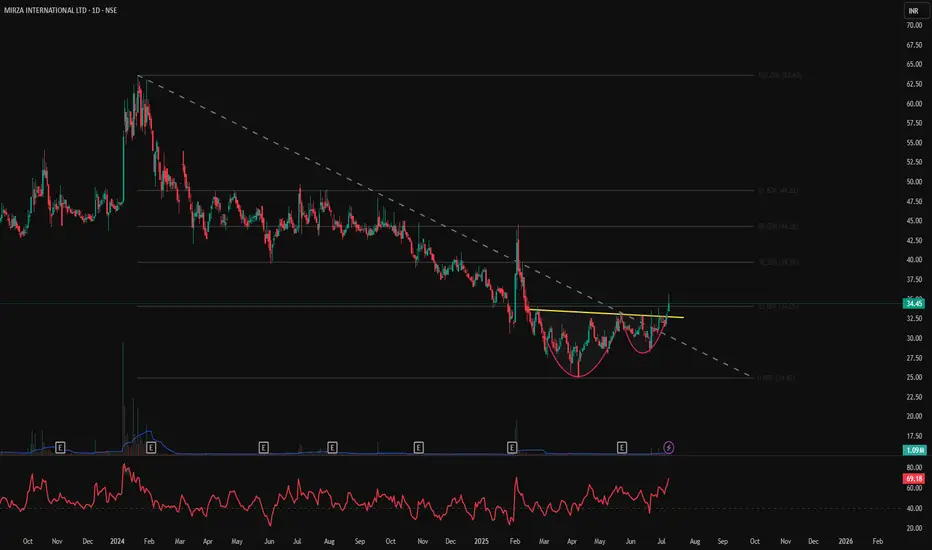
MIRZAINT – Cup & Handle Breakout | Daily Chart📊 MIRZAINT – Cup & Handle Breakout from Order Block | RVol 349% | RSI Near Overbought | Daily Chart
📅 Chart Date: July 8, 2025
📍 CMP: ₹34.45 (+4.71%)
📈 Symbol: NSE:MIRZAINT
🔍 Technical Analysis Breakdown
☕ Cup & Handle Breakout
Classic Cup & Handle pattern breakout above neckline resistance at ~₹33.
Smooth rounding bottom base followed by tight consolidation and bullish breakout.
🟥 Volumized Order Block (OB) Analysis
Previous Supply Zone: Between ₹41–₹49.5.
Demand Zone: ~₹24–₹26, previously respected.
Breakout occurred from a fresh bullish 1D OB .
📈 Relative Volume (RVol%): 349%
Significant volume spike confirms strong buying interest behind the breakout.
📐 Measured OB Data
1.542M (44%) red OB supply previously pushed price down.
Bullish OB of 795.893K (18%) supported accumulation phase pre-breakout.
📊 RSI (14, close): 69.18
Approaching overbought zone (>70), confirming strong trend but may see minor consolidation.
🏁 Key Technical Levels
Breakout Level (Neckline): ₹33.00
CMP: ₹34.45
Resistance Ahead: ₹41.00 → ₹49.50 (previous OB supply zone)
Support: ₹30.00 / ₹26.00 (OB base)
💡 Trade Setup Insight
Entry: CMP on breakout or retest near ₹33
Target 1: ₹41
Target 2: ₹49+
Stoploss: Below ₹30 or ₹26 (OB base zone)
Risk Profile: Moderate to Aggressive
⚠️ Disclaimer: This is an educational chart setup and not trading advice. Please conduct your own research and risk management.
📣 Follow @PriceAction_Pulse for more such clean breakouts and chart pattern analysis!
🔁 Drop a comment if TFCILTD is on your radar for the next breakout rally 📈
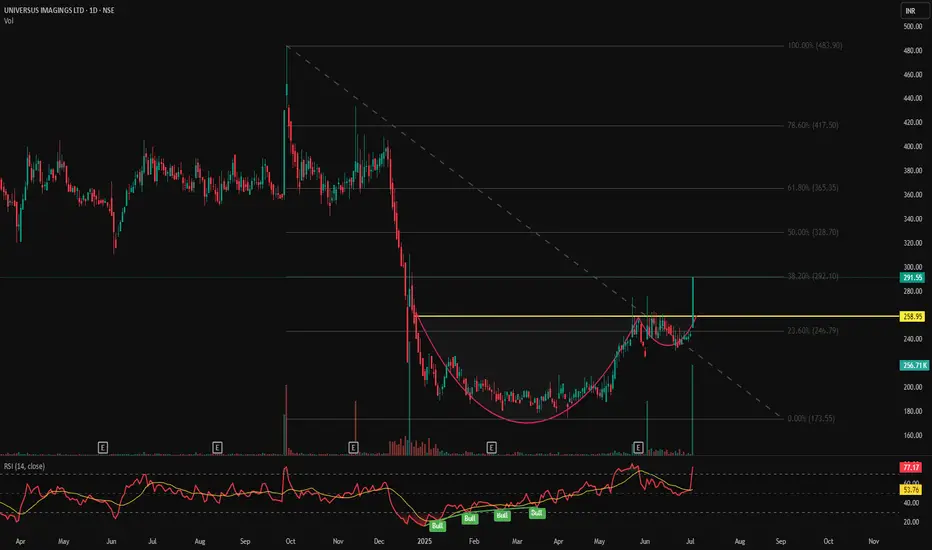
UNIVPHOTO - Cup & Handle Breakout | Daily Chart📊 UNIVPHOTO – Cup & Handle Breakout | Strong Volume | RSI Overbought | Fibonacci Confluence | Daily Chart
📅 Chart Date: July 3, 2025
📍 CMP: ₹291.55 (+20.00%)
📈 Symbol: NSE:UNIVPHOTO
🔍 Technical Analysis Summary
✅ Cup & Handle Breakout
Price has broken out above the neckline of the Cup & Handle pattern at ₹258.95 with strong bullish momentum.
Post-consolidation breakout visible with a solid bullish candle.
📊 Fibonacci Retracement Levels (Swing: ₹173.55 to ₹483.90)
23.60% – ₹246.79
38.20% – ₹292.10 ✅ (Price nearing this level – short-term resistance)
50.00% – ₹328.70
61.80% – ₹365.35
78.60% – ₹417.50
100% – ₹483.90 🎯
📈 RSI Indicator (14)
RSI has surged to 77.17, indicating strong momentum but entering overbought territory.
RSI breakout with multiple prior bullish divergences validated the upside move.
📉 Volume
Current breakout supported by above-average volume (256.71K) adds credibility to the move.
🏁 Key Technical Levels
Neckline Breakout: ₹258.95 ✅
Immediate Resistance: ₹292.10 (Fib 38.2%)
Next Targets: ₹328.70 → ₹365.35
Support Levels: ₹258.95 → ₹246.79
Major Swing Low: ₹173.55
💡 Trade Setup
Entry: On breakout confirmation above ₹259
SL: Below ₹246
Short-term Target: ₹292
Mid-term Target: ₹328 → ₹365
Risk Level: Medium (due to RSI overbought – may see retracement)
⚠️ Disclaimer
This chart is for educational and analytical purposes only. Please consult your financial advisor before making investment decisions.
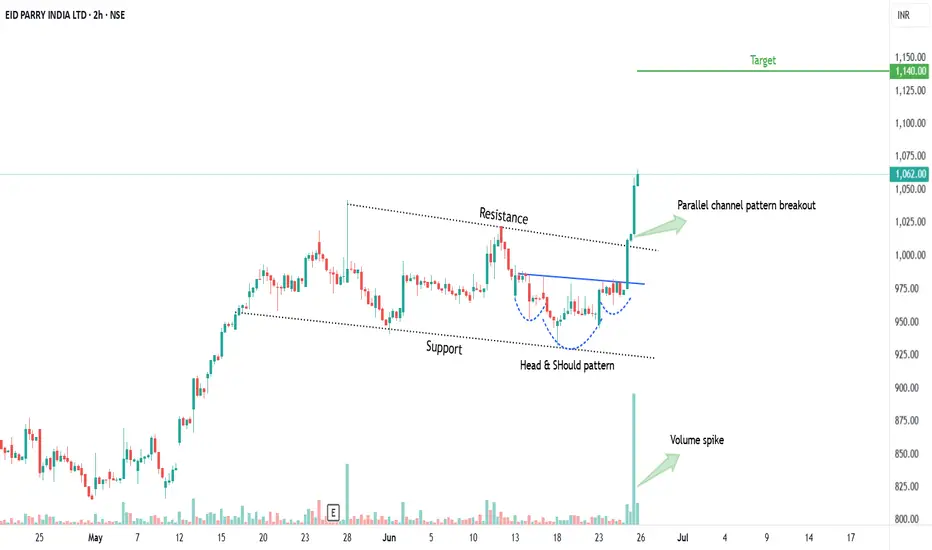
EIDPARRY - HNS & Flag & Pole patternAll details are given on chart for educational purpose only. If you like the analyses please do share it with your friends, like and follow me for more such interesting charts.
Disc - Am not a SEBI registered analyst. Please do your own analyses before taking position. Details provided on chart is only for educational purposes and not a trading recommendation
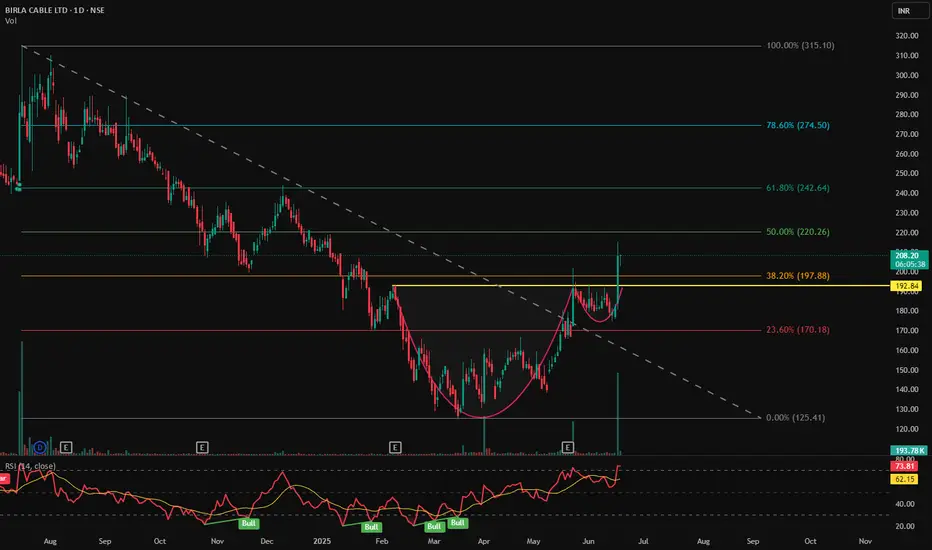
BIRLACABLE - Cup & Handle Breakout | Daily Chart📊 BIRLA CABLE LTD (BIRLACABLE) – Cup & Handle Breakout with Fibonacci Targets | RSI Overbought | Volume Spike | Daily Chart
📅 Chart Date: June 18, 2025
📈 CMP: ₹208.05 (+14.11%)
📍 Ticker: NSE:BIRLACABLE
🔍 Technical Chart Breakdown
☕ Cup & Handle Pattern Breakout
BIRLACABLE has confirmed a Cup & Handle breakout above the neckline at ₹197.88 (also 38.2% Fibonacci retracement level), suggesting bullish continuation after a long consolidation. The breakout is clean with a wide bullish candle.
📐 Fibonacci Retracement Levels (from swing high ₹315.10 to swing low ₹125.41)
38.2% (Breakout Zone): ₹197.88 ✅
50.0%: ₹220.26
61.8%: ₹242.64
78.6%: ₹274.50
Target: 100% Fibonacci: ₹315+
💹 RSI & Momentum
RSI at 73.75, entering overbought territory 🔼
Multiple RSI bullish crossovers visible during base formation
RSI suggests strong buying momentum, ideal for trend continuation
📉 Trendline Breakout
Downtrend resistance (dotted line) broken along with horizontal neckline
Aligns with volume-based breakout, confirming strength
🕯️ Volume Confirmation
Huge spike in volume (4.44M) on breakout day — highest in months
Suggests institutional or smart money activity
📍 Key Price Levels
✅ Breakout Level: ₹197.88
🚀 Fibonacci Targets:
₹220.26 → 50%
₹242.64 → 61.8%
₹274.50 → 78.6%
₹315+ → 100% (Full target)
🛡️ Support Levels:
₹197 (neckline support)
₹170.18 (23.6% Fib)
₹150 (handle base)
💡 Trading Idea
Entry: Close above ₹198 or on retest of neckline
Stop Loss: Below ₹185 or ₹170
Targets: ₹220 → ₹243 → ₹275 → ₹315
Risk-Reward: Favorable with strong confirmation
Apollo Micro-Do not miss this Volume breakout!Apollo Microsystems has given a breakout of consolidation with a strong weekly closing, almost forming a bullish marubozu candle
Stock will look good only when it retest level of 110 and bounces.
Levels mentioned on chart. I will not buy at CMP.
Stock has potential to fly at least towards 200 according to fib extension.
It is too good of breakout to miss. I have hardly seen such a bullish weekly candle recently when Nifty has been slight bearish.
