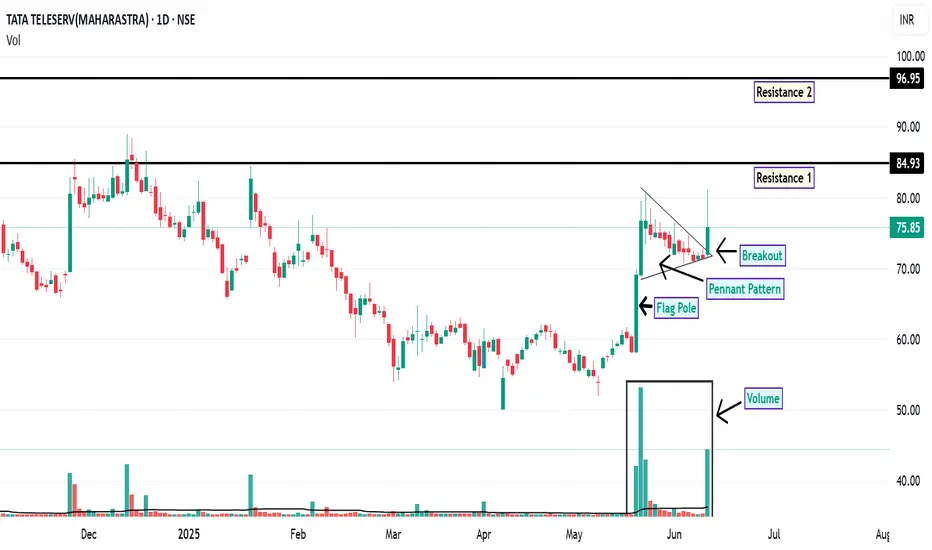
TTML: Pennant Breakout Signals Potential Upside
On the daily chart, TTML has recently exhibited a breakout from a pennant formation , a pattern often associated with potential continuation of the prevailing trend. This breakout is accompanied by a notable increase in trading volume, which may indicate growing market interest and participation.
Additionally, the price action has shown support at the 200-day EMA, a widely observed long-term trend indicator. This confluence of technical signals may suggest a strengthening bullish sentiment.
From a momentum perspective, both the RSI and MACD indicators are currently positioned in bullish territory on both the daily and weekly timeframes. This alignment across multiple timeframes can be interpreted as a sign of potential trend continuation.
Looking ahead, the price may revisit the ₹75 level, which could act as a demand zone. Should the stock manage to close and sustain above ₹76.40 , the next potential resistance levels to monitor are around ₹84.93 and ₹96.95 . For risk management, a suggested stop-loss level could be considered below ₹62 , based on recent support structures.
Disclaimer: This analysis is intended solely for informational and educational purposes. It does not constitute investment advice or a recommendation to buy or sell any financial instrument. Market participants are encouraged to conduct their own research or consult with a licensed financial advisor before making any investment decisions.
VOLUMEBREAKOUT
KRISHANA PHOSCHEM LTD | Major Breakout Ahead? Hey Family, here’s another stock showing a strong technical setup! 🚀
Key Observations:
Pattern : Formation of a Rectangle Box Pattern on the Daily Timeframe (1D).
Range Period:
Stock moved within a horizontal range between June 2024 to April 2025.
Multiple tests near the upper resistance band during this period.
Resistance Behavior:
Price repeatedly tested the resistance zone around ₹278–₹285.
Now showing signs of a breakout attempt and trying to sustain above the range.
Volume Insight:
Noticeable volume accumulation over the past few sessions.
Volume spikes during breakout candles suggest strong buyer interest.
Candlestick Structure:
Strong bullish candles with minimal rejection indicate a genuine attempt to break out.
🚨 Disclaimer: What is your view please comment it down and also boost the idea this help to motivate us. We are Certified. All views shared on this channel are my personal opinion and is shared for educational purpose and should not be considered advise of any nature.
🚨 Note: Always manage risk and do your own research.

SERVOTECH: Volume Surge Signals StrengthAn analysis of the weekly chart for SERVOTECH indicates a noteworthy technical development. The security has exhibited a breakout above a key pivot level previously identified around the 148 price zone.
This price action was accompanied by a substantial volume surge. The weekly volume registered approximately 34 million shares, a figure representing a more than five-fold increase compared to its 50W moving average of volume. Such a significant expansion in volume on a breakout can suggest strong institutional interest and conviction behind the move.
Further supporting a bullish outlook of RSI is situated above the 60 level on both the weekly and daily timeframes. A confluence of strong RSI readings across multiple timeframes is often interpreted by market participants as a sign of robust and broad-based upward momentum.
Based on this technical structure, the following price levels may be of interest for observation:
From a strategic standpoint, the stock may present a potential accumulation zone around the 150 level. The 195 level is identifiable as the next area of potential overhead supply, or resistance, where selling pressure might emerge. From a risk management perspective, a breach of the 136 level could challenge the validity of the recent bullish structure and might be monitored accordingly.
Disclaimer: The information provided in this stock analysis is for informational and educational purposes only and should not be construed as financial advice. Always seek the advice of a qualified financial advisor or conduct your own thorough research before making any investment decisions. Market conditions are dynamic, and past performance is not indicative of future results.

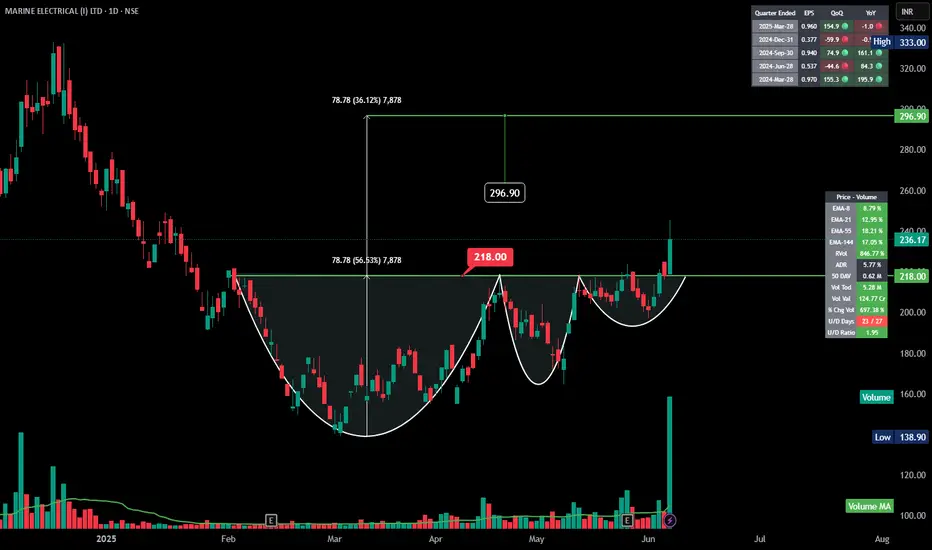
MARINE | VCP Pattern | Breakout | Good Volume | DailyHere’s a **detailed analysis** of the Marine Electricals Ltd. chart you shared:
---
### **Chart Pattern & Setup:**
✅ **VCP Pattern**:
* Well-formed **VCP *218 ** level, as indicated.
---
### **Measured Move & Target:**
* Depth of cup = **78.78 ** (\~36.12% move).
* **Target after breakout:**
Breakout Level (218) + Depth (78.78) = 296.90
---
### **Volume Confirmation:**
✅ Huge surge in volume on breakout day, reinforcing the bullish breakout.
✅ Volume expansion is above moving average, a positive sign.
---
### **Key Technical Levels:**
* **Breakout level:** 218
* **Current price:** 236.17
* **Resistance/Target:** 296.90
* **Support:** 218 (former resistance now turned support).
---
### **Momentum & Indicators:**
✅ All key EMAs (8, 21, 55, 144) are upward sloping – confirming a **bullish trend**.
✅ Fundamental earnings data show significant YoY growth – another positive factor.
---
### **Trade Idea & Risk Management:**
📈 The breakout suggests a target of **\~296 **.
📉 A close below **218 ** would invalidate the pattern—consider this as a stop-loss level for risk management.
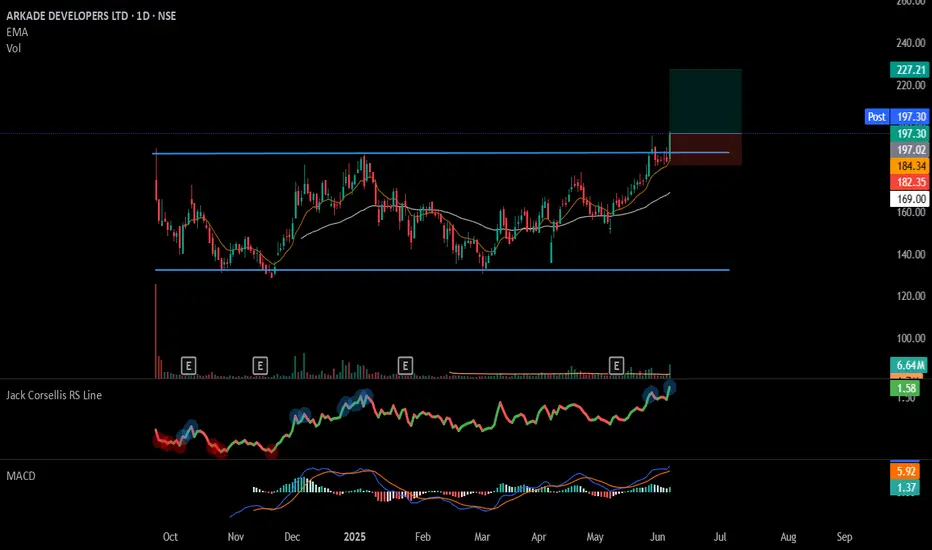
#ARKADE - IPO Base Breakout📊 Script: ARKADE
Key highlights: 💡⚡
📈 IPO Base Breakout in Daily Time Frame.
📈 Price consolidating near Resistance, then Breakout.
📈 Volume spike seen during Breakout.
📈 MACD Cross
📈 Can go for a swing trade
BUY ONLY ABOVE 197 DCB
⏱️ C.M.P 📑💰- 197.34
🟢 Target 🎯🏆 – 14%
⚠️ Stoploss ☠️🚫 – 7%
⚠️ Important: Market conditions are Okish, Position size 50% per Trade. Protect Capital Always
⚠️ Important: Always Exit the trade before any Event.
⚠️ Important: Always maintain your Risk:Reward Ratio as 1:2, with this RR, you only need a 33% win rate to Breakeven.
✅Like and follow to never miss a new idea!✅
Disclaimer: I am not SEBI Registered Advisor. My posts are purely for training and educational purposes.
Eat🍜 Sleep😴 TradingView📈 Repeat 🔁
Happy learning with MMT. Cheers!🥂
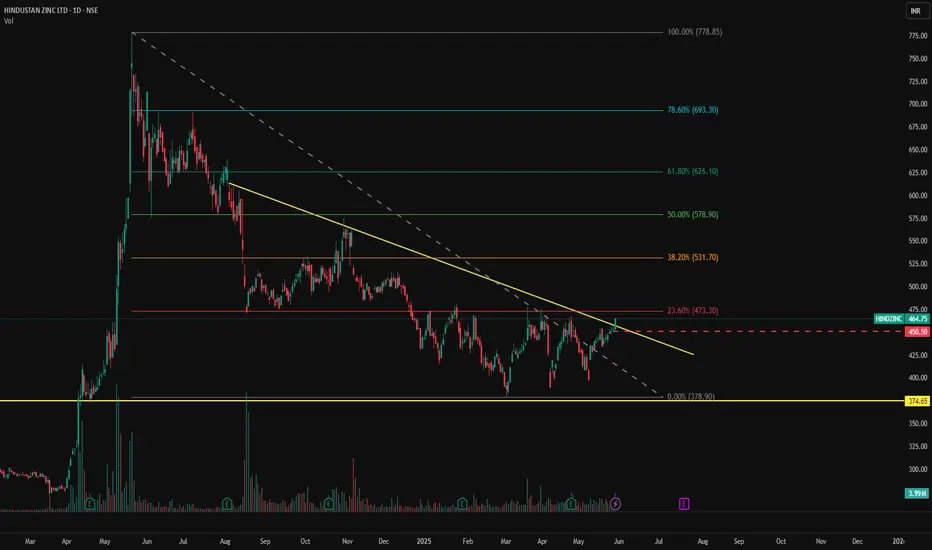
HINDZINC - NSE | Daily Chart Analysis📊 HINDUSTAN ZINC LTD (HINDZINC) – NSE | Daily Chart Analysis
📅 Date: May 30, 2025
📈 CMP: ₹464.75 (+2.68%)
📌 Ticker: NSE:HINDZINC
🧠 Technical Breakdown
🟢 Descending Trendline Breakout 🟢
The stock is showing early signs of strength as it approaches the apex of a long-term descending trendline. Price action is attempting a trendline breakout from a nearly year-long downtrend, suggesting the possibility of a bullish reversal.
🔍 Volume Confirmation
Steady volume buildup over the past few sessions, potentially indicating accumulation ahead of a confirmed breakout.
📉 Well-Defined Support
₹374.65 has acted as a strong demand zone on multiple occasions, offering a solid base for the current move.
📍 Key Price Levels
🔺 Resistance (Trendline Breakout Zone): ₹465
🔻 Major Support: ₹374.65
🎯 Upside Targets (on breakout):
₹500
₹535
₹575+
🛡️ Stop Loss: Below ₹440 (on breakout failure)
📌 Trading Strategy
Aggressive Entry: On breakout + closing above ₹465 with volume surge
Conservative Entry: Retest of trendline post-breakout
SL: ₹440
Target Zone: ₹500–₹575
⚠️ Disclaimer
This post is for educational purposes only and does not constitute financial advice. Always conduct your own analysis or consult a financial advisor before investing.
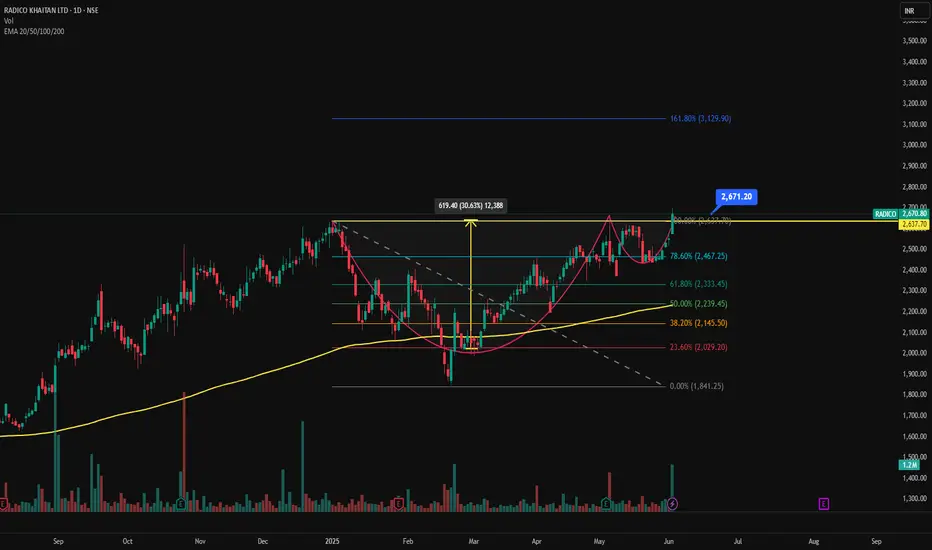
RADICO - Cup & Handle Breakout | Daily Chart📊 RADICO KHAITAN LTD (RADICO) – Cup & Handle Breakout | Daily Chart
📅 Chart Date: June 4, 2025
📈 CMP: ₹2,670.80 (+4.78%)
📍 Ticker: NSE:RADICO
🔍 Technical Breakdown
☕ Cup & Handle Breakout Confirmed
A classic Cup & Handle formation has played out with a bullish breakout above the neckline near ₹2,640–₹2,670. The pattern is well-structured, showing clear accumulation followed by a rounded bottom and brief consolidation.
📏 Measured Target:
The height of the cup (~₹620) projects an initial target near ₹3,129, aligning closely with the 161.80% Fibonacci Extension level.
⚙️ Indicators Used
🔹 Chart Pattern: Cup & Handle
📐 Fibonacci Retracement & Extension
📊 Volume Spike: Strong breakout volume
📈 EMA Cluster: 20/50/100/200-day — bullish alignment
🟢 EMA Support: Price sustaining well above EMAs; 200 EMA ~₹2,000
📍 Key Price Levels
✅ Breakout Zone: ₹2,640–₹2,670
🚀 Upside Targets:
📈 127.20% – ₹2,853
📈 161.80% – ₹3,129
📈 200% – ₹3,352 (extended swing target)
🛡️ Support Levels:
₹2,467 – 78.6% Fibo
₹2,333 – 61.8%
₹2,145 – 38.2%
₹2,029 – 23.6%
🔻 Invalidation/Stop: Closing below ₹2,467 (strong Fibo + EMA support zone)
💼 Trading Strategy
Entry: On breakout retest or strong close above ₹2,670
Stop Loss: ₹2,467
Target Range: ₹2,853 – ₹3,129 – ₹3,350+
Timeframe: Short to medium term swing
⚠️ Disclaimer
This analysis is for educational purposes only. Please do your own research or consult a financial advisor before making trading/investment decisions.
YESBANK: Riding the Bullish WaveYes Bank has exhibited a notable breakout above the resistance level established in December 2024. This breakout is accompanied by a classic flag pattern formation, which has resolved to the upside—typically interpreted by technical analysts as a continuation signal within an existing trend.
A significant increase in trading volume during the breakout phase adds weight to the move, suggesting heightened market participation. Furthermore, the 20-day EMA has crossed above the 200-day EMA, a crossover often referred to as a "Golden Cross" , which is generally viewed as a bullish signal indicating potential for continued upward momentum.
The RSI is currently positioned above 60, reflecting sustained buying interest without yet entering overbought territory.
From a structural perspective:
Immediate resistance may be encountered near the 24.75 level.
A secondary resistance zone appears around 28.54.
On the downside, the stock seems to have established a support base near 19.54, which could act as a cushion in the event of a pullback.
Disclaimer:
This analysis is intended solely for informational and educational purposes. It does not constitute investment advice, a recommendation, or an offer to buy or sell any securities. Market conditions can change rapidly, and all trading involves risk. Individuals should conduct their own due diligence or consult with a qualified financial advisor before making any investment decisions.

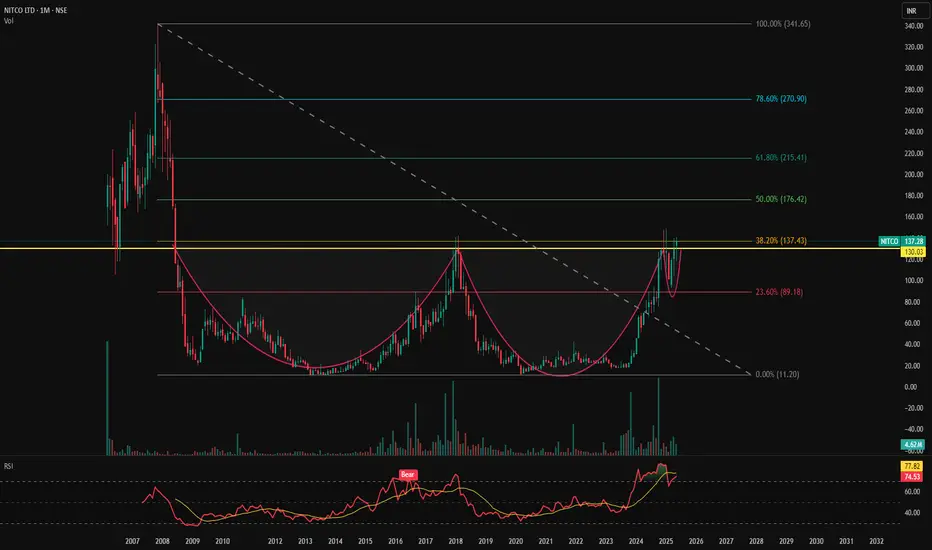
NITCO LTD | Monthly Chart Analysis📊 NITCO LTD (NSE:NITCO) | Monthly Chart Analysis
📅 Date: June 1, 2025
📈 CMP: ₹137.28 (+6.02%)
📌 Ticker: NSE:NITCO
📉 Chart Pattern Insight
🏆 Massive Cup and Handle Breakout Formation (18-Year Base)
NITCO is breaking out of a textbook multi-decade Cup and Handle pattern, forming over 17+ years. This type of structural breakout on a monthly timeframe is rare and typically leads to multi-fold rallies.
💥 The breakout zone lies around ₹130.03 – previously a strong resistance from 2007, 2017, and now being tested again with a strong monthly close above it.
📊 Indicator: RSI + Moving Average Cross (Icon shown)
🔎 RSI (Relative Strength Index): Currently at 74.53, signaling strong bullish momentum
📈 RSI has also crossed above its moving average, and the "Bear" label in the past has flipped, suggesting a shift in long-term trend direction.
🔑 Key Levels
🔸 Breakout Zone: ₹130.03 (now acting as support)
🎯 Target Zones (based on Fibonacci & historical zones):
₹180
₹250
₹320+
🛡️ Stop Loss (Monthly Close Below): ₹120
💡 Trading Strategy
Entry: On successful retest and hold above ₹130
SL: ₹120 (monthly candle close basis)
Target: Positional hold for ₹180–₹320+
Time Frame: Long-term multi-month to multi-year potential
⚠️ Disclaimer
This is for educational purposes only. Please do your own research or consult a registered advisor before taking positions.
CHALET Hotels : Swing pick#CHALET #swingtrade #breakout #threewhitesoldiers #trendingstock
CHALET : Swing Trade
>> TWS Visible
>> Trending Setup
>> Good Strength in Stock
>> Volumes Dried up, Expansion imminent
>> Quick 10-15% upside potential
Swing Traders can lock profit at 10% & Keep Trailing
Disc : Charts shared are for Learning purpose and not a Trade recommendation. Consult a SEBI Registered Advisor before taking position in it.

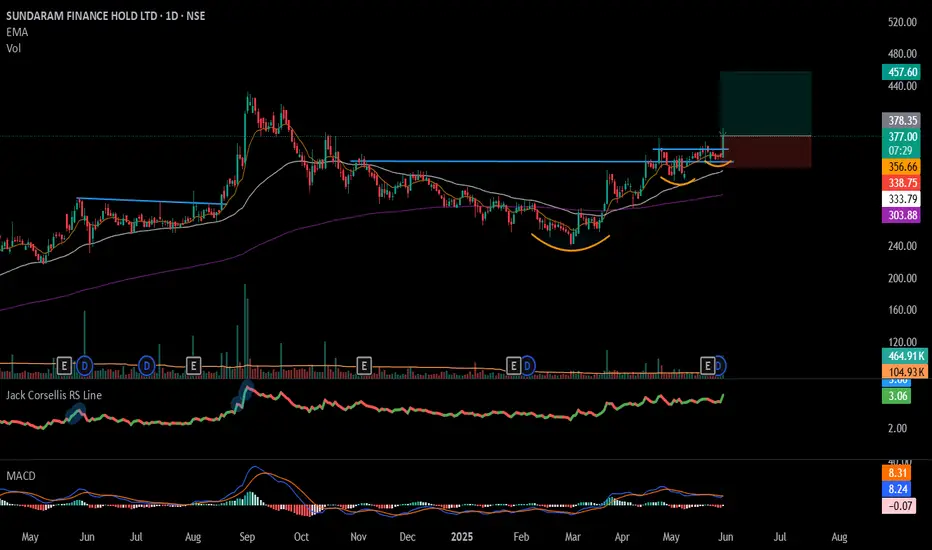
#SUNDARMHLD - VCP BreakOut in Daily Time Frame.📊 Script: SUNDARMHLD
Key highlights: 💡⚡
📈 VCP BreakOut in Daily Time Frame.
📈 Price consolidating near Resistance.
📈 Volume spike during Breakout
📈 MACD Cross
📈 Can go for a swing trade
BUY ONLY ABOVE 378 DCB
⏱️ C.M.P 📑💰- 376
🟢 Target 🎯🏆 – 21%
⚠️ Stoploss ☠️🚫 – 10.50%
⚠️ Important: Market conditions are Okish, Position size 50% per Trade. Protect Capital Always
⚠️ Important: Always Exit the trade before any Event.
⚠️ Important: Always maintain your Risk:Reward Ratio as 1:2, with this RR, you only need a 33% win rate to Breakeven.
✅Like and follow to never miss a new idea!✅
Disclaimer: I am not SEBI Registered Advisor. My posts are purely for training and educational purposes.
Eat🍜 Sleep😴 TradingView📈 Repeat 🔁
Happy learning with MMT. Cheers!🥂
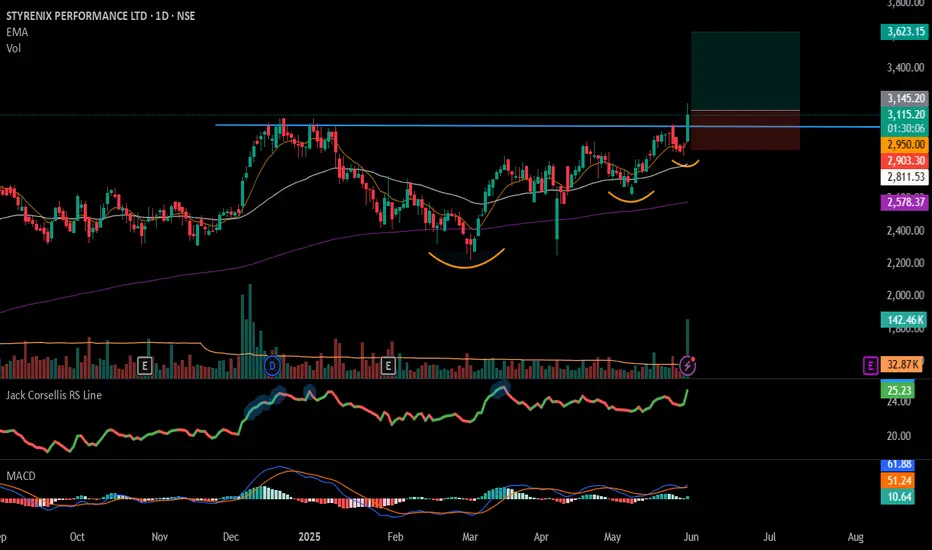
#STYRENIX - VCP BreakOut in Daily Time Frame📊 Script: STYRENIX
Key highlights: 💡⚡
📈 VCP BreakOut in Daily Time Frame.
📈 Price consolidating near Resistance.
📈 Volume spike during Breakout
📈 MACD Bounce
📈 Can go for a swing trade
BUY ONLY ABOVE 3145 DCB
⏱️ C.M.P 📑💰- 3115
🟢 Target 🎯🏆 – 16%
⚠️ Stoploss ☠️🚫 – 8%
⚠️ Important: Market conditions are Okish, Position size 50% per Trade. Protect Capital Always
⚠️ Important: Always Exit the trade before any Event.
⚠️ Important: Always maintain your Risk:Reward Ratio as 1:2, with this RR, you only need a 33% win rate to Breakeven.
✅Like and follow to never miss a new idea!✅
Disclaimer: I am not SEBI Registered Advisor. My posts are purely for training and educational purposes.
Eat🍜 Sleep😴 TradingView📈 Repeat 🔁
Happy learning with MMT. Cheers!🥂
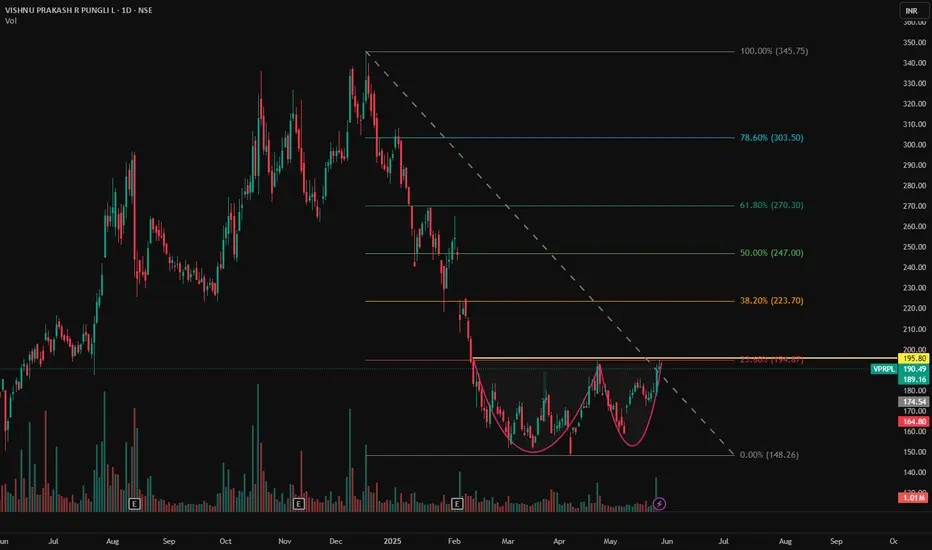
VPRPL - NSE | Daily Timeframe📊 VISHNU PRAKASH R PUNGLIA LTD (VPRPL) – NSE | Daily Timeframe
📅 Date: May 29, 2025
📈 CMP: ₹190.49 (−0.41%)
📌 Ticker: NSE:VPRPL
🧠 Technical Overview
✅ Cup & Handle Pattern in Formation 🍵
Price action is carving out a clean Cup & Handle base near the ₹195.80 resistance zone. A breakout above this neckline could ignite a fresh upside rally. The symmetry, volume spike, and recent bullish structure are all supporting potential continuation.
🧪 Volume Analysis
Noticeable volume increase as the price nears breakout zone, indicating accumulation and rising interest.
📍 Key Levels to Watch
🟡 Breakout Resistance:
₹195.80 (horizontal neckline)
🟢 Support Zone:
₹174.50 (base support of the cup)
₹165 (lower handle risk zone)
🎯 Potential Targets (Post Breakout):
₹220
₹240
₹265 (pattern-measured target zone)
💡 Trade Plan
Entry (on breakout): ₹196+ (with strong volume confirmation)
Stop Loss: Below ₹174
Target Range: ₹220–₹265
Risk-Reward: ~1:2.5+
⚠️ Disclaimer
This chart analysis is for educational purposes only. Always DYOR (Do Your Own Research) and consult a financial advisor before making investment decisions.
KIRIINDUS | Cup and Handle | Breakout |DailyHere’s a **short and sharp technical analysis** of **KIRI INDUSTRIES LTD (NSE: KIRIINDUS)**:
---
## 🔍 **KIRI INDUSTRIES LTD – Weekly Chart Overview**
* ✅ **Pattern**: *Massive Cup & Handle (Multi-year base)*
* 💥 **Breakout Level**: ₹673
* 📈 **Current Price**: ₹726.55
* 📊 **Volume**: Strong breakout volume
* 🎯 **Target**: ₹1,106 (63% upside based on pattern height)
* 🔽 **Support**: ₹673.50 (previous resistance turned support)
---
### 📌 **Trade View**
* **Bias**: **Bullish** – Long-term breakout from consolidation
* **Retest Buy Zone**: ₹680–₹700
* **Target**: ₹1,050–₹1,100
* **Stop Loss**: ₹673 (weekly close)
---
📢 *Multi-year breakout with strong momentum – ideal for positional holding.*

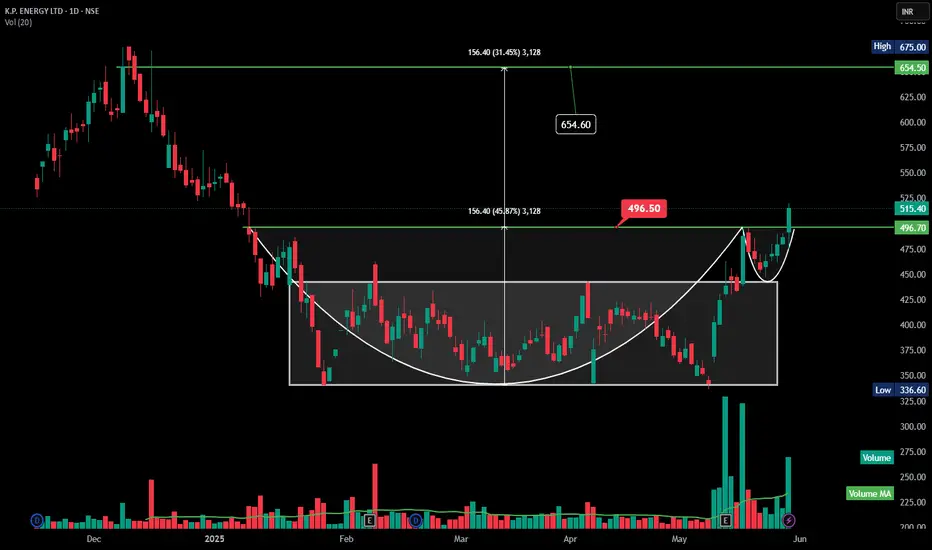
KPEL| Cup and Handle | Breakout |DailyHere’s a **refined and concise high-level analysis** of **K.P. Energy Ltd (NSE: KPENERGY)**:
---
## 🔍 **K.P. ENERGY LTD – Technical Overview**
* ✅ **Pattern**: *Cup & Handle*
* 💥 **Breakout above** ₹496.50 with strong volume
* 📈 **Current Price**: ₹515.40
* 🎯 **Target**: ₹654.60 (based on pattern depth)
* 🔽 **Support**: ₹496.50 (breakout zone)
* 📊 **Volume Surge** confirms bullish strength
---
### 📌 **Trade Setup**
* **Entry** on retest near ₹500–₹505
* **Target**: ₹640–₹655
* **Stop Loss**: ₹495 (close basis)
---
📢 **Bias**: Strongly Bullish — textbook breakout with volume confirmation.
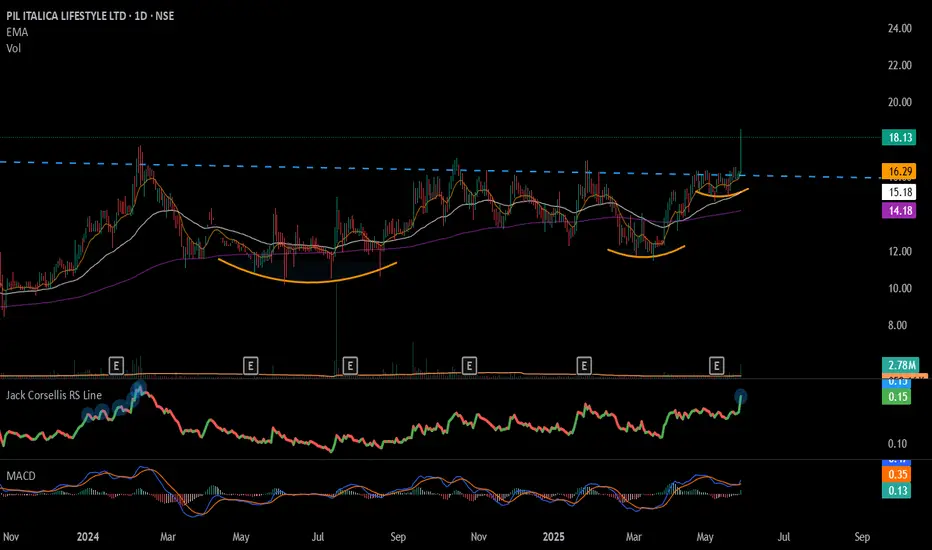
#PILITA - Multi Year BreakOut 📊 Script: PILITA
Key highlights: 💡⚡
📈 8 Year BreakOut in Daily Time Frame.
📈 Price consolidating near Resistance.
📈 Volume spike during Breakout
📈 MACD Bullish
📈 Can go for a swing trade
⚠️ Important: It’s a Penny Stock Trade with extreme caution
BUY ONLY ABOVE 17.50 DCB
⏱️ C.M.P 📑💰- 17.45
🟢 Target 🎯🏆 – NA%
⚠️ Stoploss ☠️🚫 – NA%
⚠️ Important: Market conditions are Okish, Position size 50% per Trade. Protect Capital Always
⚠️ Important: Always Exit the trade before any Event.
⚠️ Important: Always maintain your Risk:Reward Ratio as 1:2, with this RR, you only need a 33% win rate to Breakeven.
✅Like and follow to never miss a new idea!✅
Disclaimer: I am not SEBI Registered Advisor. My posts are purely for training and educational purposes.
Eat🍜 Sleep😴 TradingView📈 Repeat 🔁
Happy learning with MMT. Cheers!🥂
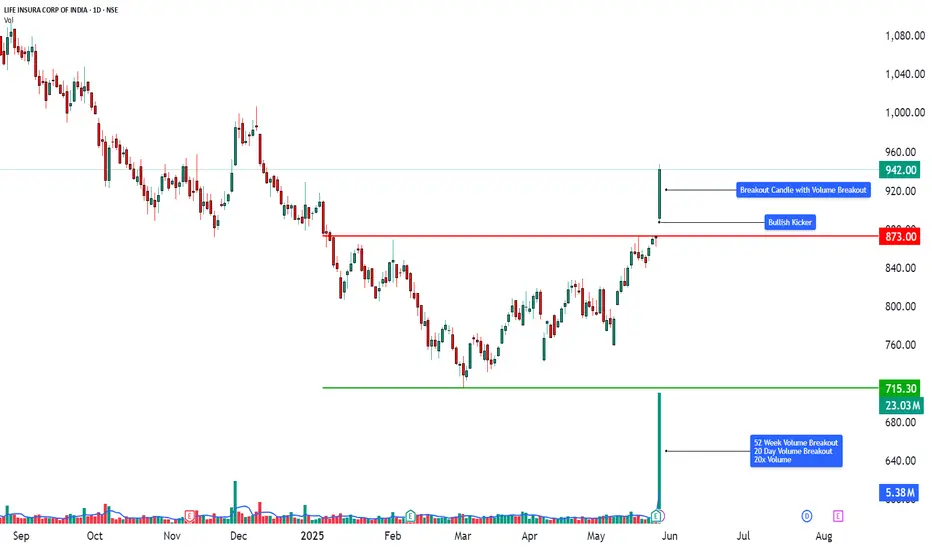
Technical Analysis | Powerful Price Action with Volume Breakout📈 LIFE INSURANCE CORPORATION OF INDIA (LICI) – TECHNICAL ANALYSIS
📆 Date: May 28, 2025
🔍 Timeframe: Daily
________________________________________
Price Action:
LICI surged over 8.12% in today’s session, registering a breakout after weeks of sideways consolidation. The breakout candle was wide-bodied, closing near the day’s high, and supported by a 20-day volume breakout – signaling fresh bullish momentum and accumulation at lower levels.
________________________________________
Chart Pattern / Candlestick Pattern:
• Sideways Consolidation Breakout
• Strong Bullish Candle (Buy Today, Sell Tomorrow setup)
• 52-Week Volume Breakout
• RSI Breakout
• BB Squeeze Exit – Volatility Expansion Phase
• Bollinger Band Expansion + Momentum Surge
• Multiple bullish candlestick patterns across all timeframes = multi-frame trend alignment.
• Gap-Up + Kicker + Long White Candle combo increases conviction of momentum breakout.
• Heikin Ashi continuity indicates a trend in motion without signs of reversal.
________________________________________
Technical Indicators:
• RSI (Daily): 79 – Bullish territory
• MACD: Bullish crossover active
• Stochastic: 97 – Overbought but confirms momentum
• CCI: 206 – Strong upside acceleration
• Volume: 23.03M – Very high vs. 2.24M average, confirms breakout
________________________________________
Support & Resistance Levels:
• Immediate Resistance: ₹964
• Next Resistance: ₹986
• Major Resistance: ₹1024
• Immediate Support: ₹904
• Secondary Support: ₹866
• Major Support: ₹844
• Weak Support Zone: ₹760–₹720
________________________________________
Chart Overview:
This visual representation highlights:
🔸 Clear resistance break with powerful volume
🔸 Bullish momentum confirmed by multiple indicators
🔸 20-day volume breakout indicating accumulation
🔸 Layered resistance levels between ₹964–₹1024
🔸 Tight squeeze breakout offering high R:R setups
________________________________________
Educational Breakdown:
This trade setup showcases:
• Breakout Confirmation: Price + Volume + Momentum Alignment
• Band Expansion: Beginning of volatility trend
• Momentum Shift: From sideways to bullish trend
• Volume Behavior: Institutional interest clearly visible
• Support Layering: Gives fallback levels for pullback traders
Such a chart is a perfect case study in breakout trading, especially post-consolidation and on high volume days.
________________________________________
How to Trade LICI (for learning purpose):
• Entry Example: ₹942.00
• Stop Loss: ₹844.00 (Risk: ₹98.00)
• Target 1: ₹964.00 (Reward: ₹22.00)
• Target 2: ₹986.00 (Reward: ₹44.00)
• Target 3: ₹1024.00 (Reward: ₹82.00)
• Sample Quantity: 50 shares
• RR Ratio: Short-term ~1:0.5; Swing ~1:1 or more
• Aggressive Traders: Can trail stop-loss as price approaches ₹986
• Conservative Traders: Wait for dip toward ₹904 or ₹866 zones
________________________________________
This breakout setup is ideal for swing trades, backed by strong volume and momentum indicators. However, since the RSI and Stochastic are in the overbought zone, traders should manage risk through stop-losses or wait for minor retracements for safer entries.
⚠️ Risk Management Tip: Always trade with a clearly defined stop loss. Avoid entering positions impulsively. It is advisable to start with a smaller quantity and increase your exposure only if the price action confirms the continuation of the trend. Capital protection should always be the priority.
📢 Disclaimer
This content is created purely for educational and informational purposes. It is not intended as investment advice, stock recommendations, or trading tips. Trading and investing in the stock market involves risk. Please consult with a SEBI-registered financial advisor before making any investment decisions. The author/creator is not registered with SEBI and shall not be held responsible for any losses incurred based on this information. Always do your own research and use proper risk management.
👉 If you found this analysis helpful, don’t forget to Follow, so you never miss out on a trade-worthy setup, breakout opportunity, or valuable educational insight again. Stay updated and trade smarter! 💡📈
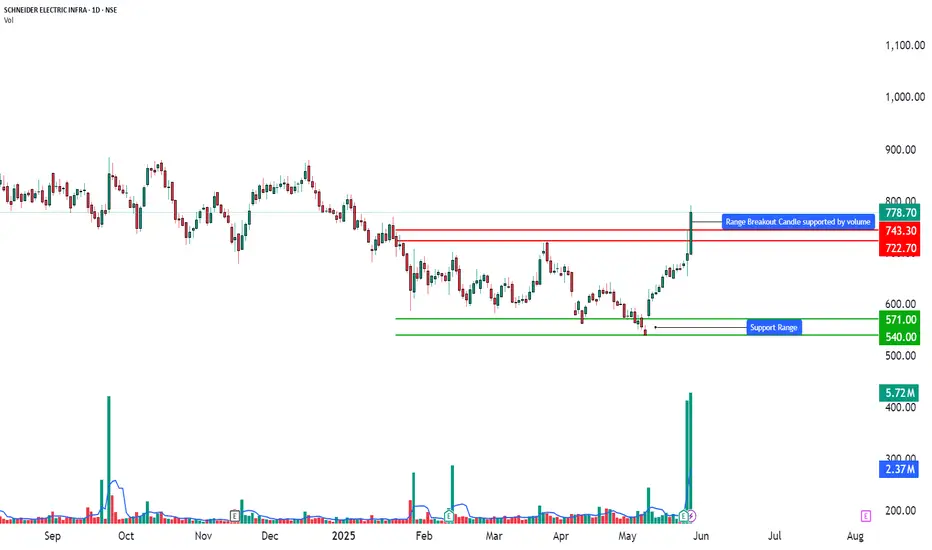
Technical Analysis - 52-Week Volume Breakout📈 SCHNEIDER ELECTRIC INFRA – TECHNICAL ANALYSIS
📆 Date: May 28, 2025
🔍 Timeframe: Daily
________________________________________
Price Action:
Schneider Electric Infra soared over 11.5% today with a strong bullish candle breaking above recent consolidation levels. This wide-range breakout candle marks a 20-day and 52-week volume breakout, indicating heavy accumulation and institutional participation. The price surged from support near ₹570 to close around ₹778.70, confirming bullish momentum.
________________________________________
Chart Pattern / Candlestick Pattern:
• Breakout Setup
• 52-Week High Breakout
• Bullish Candle with strong body and large volume
• BB Squeeze Breakout (Volatility Expansion Expected)
• Bollinger Band Expansion
• Volume Spike – highest in over a year
• Daily Chart: Bullish Initiation pattern on Heikin Ashi
• Weekly Chart: Bullish Continuation pattern formed
• Monthly Chart: Spinning Top, but with bullish undertones confirmed by volume
• Recent Candles: Long White Candle patterns on daily and monthly charts (May 28, 2025)
________________________________________
Technical Indicators:
• RSI (Daily): 79 – Strong bullish territory
• MACD: Bullish crossover active
• Stochastic: 95 – Overbought but shows strong momentum
• CCI: 188 – Momentum phase, institutional buying signs
• Volume: 5.72M – Extremely high, 20-day volume breakout
________________________________________
Support & Resistance Levels:
• Immediate Resistance: ₹814.75
• Next Resistance: ₹850.80
• Major Resistance: ₹910.20
• Immediate Support: ₹719.30
• Secondary Support: ₹659.90
• Major Support: ₹623.85
• Weak Support Zone: ₹570–₹550
________________________________________
Chart Overview:
The chart highlights:
🔸 Strong bullish candle piercing prior resistance
🔸 Volume breakout aligned with price breakout
🔸 Clear resistance cluster above ₹814–₹910
🔸 Support zone well established below ₹720
🔸 Multiple confirmations from indicators and volume surge
🔸 Entry was marked at ₹791.40 with SL at ₹651.85
________________________________________
Educational Breakdown:
This is a textbook breakout with volume confirmation setup:
• Price Action: Breakout from resistance zone
• Momentum Indicators: Strongly aligned
• Volume: Institutional spike with confirmation of trend continuation
• Band Expansion: Signals beginning of high volatility trend
• Entry Confirmation: RSI + BB + Volume breakout + Trend indicators
This setup indicates a fresh trend beginning post-accumulation phase, making it suitable for swing to positional trades. The aggressive rise also suggests short-term profit-taking zones near the immediate resistance, while medium-term targets remain valid.
________________________________________
How to Trade Schneider Electric Infra (for learning purpose):
• Entry Example: ₹791.40
• Stop Loss: ₹651.85 (Risk: ₹139.55)
• Target 1: ₹930.95 (Reward: ₹139.55)
• Target 2: ₹1070.45 (Reward: ₹279.05)
• Sample Quantity: 50 shares
• RR Ratio: 1:1 to 1:2
• Aggressive Traders: Can ride trend with trailing stop
• Conservative Traders: Wait for pullback near ₹720–₹700 before entry
⚠️ Risk Management Tip: Always trade with a clearly defined stop loss. Avoid entering positions impulsively. It is advisable to start with a smaller quantity and increase your exposure only if the price action confirms the continuation of the trend. Capital protection should always be the priority.
📢 Disclaimer
This content is created purely for educational and informational purposes. It is not intended as investment advice, stock recommendations, or trading tips. Trading and investing in the stock market involves risk. Please consult with a SEBI-registered financial advisor before making any investment decisions. The author/creator is not registered with SEBI and shall not be held responsible for any losses incurred based on this information. Always do your own research and use proper risk management.
👉 If you found this analysis helpful, don’t forget to Follow, so you never miss out on a trade-worthy setup, breakout opportunity, or valuable educational insight again. Stay updated and trade smarter! 💡📈
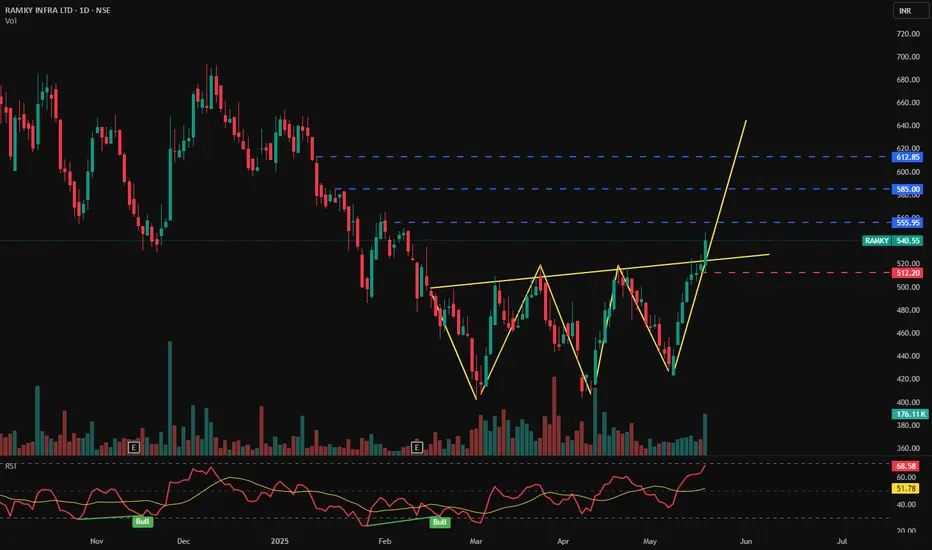
RAMKY INFRA LTD - Bullish Pattern📊 RAMKY INFRA LTD (1D) – CMP ₹540.55
📅 Date: May 21, 2025
📈 Exchange: NSE
📌 Ticker: RAMKY
🧠 Technical Analysis Overview
✅ Bullish Inverse Head & Shoulders Pattern:
Price has broken out of a clearly formed inverse head and shoulders pattern — a powerful trend reversal structure — indicating a strong bullish sentiment and possible long-term uptrend.
✅ Breakout Confirmation:
A sharp breakout above the neckline near ₹512 has occurred with strong bullish momentum and increased volume.
✅ RSI Indicator – 📈
RSI is at 68.58, approaching overbought levels but not showing divergence yet, confirming continued bullish strength. The RSI trend also shows recent bullish crossovers.
📍 Key Price Levels
📌 Support
🟥 ₹512.20 – Neckline retest level (ideal re-entry zone)
📌 Resistance (Targets)
🔵 ₹555.95 – Immediate target
🔵 ₹585.00 – Mid-term resistance
🔵 ₹612.85 – Major resistance / final target from pattern projection
💬 Potential Strategy
Breakout Entry already active above neckline
Pullback Entry possible near ₹512–₹520
SL below ₹512
Target 1: ₹555
Target 2: ₹585
Target 3: ₹612+
📌 Conclusion
RAMKY INFRA is breaking out of a strong inverse head and shoulders pattern with bullish volume and RSI confirmation. Watch for a potential retest near ₹512 for a high-probability entry. Targets lie ahead at ₹555, ₹585, and ₹612.
🛑 Disclaimer:
This analysis is for educational purposes only. Not investment advice. Always DYOR or consult your financial advisor.
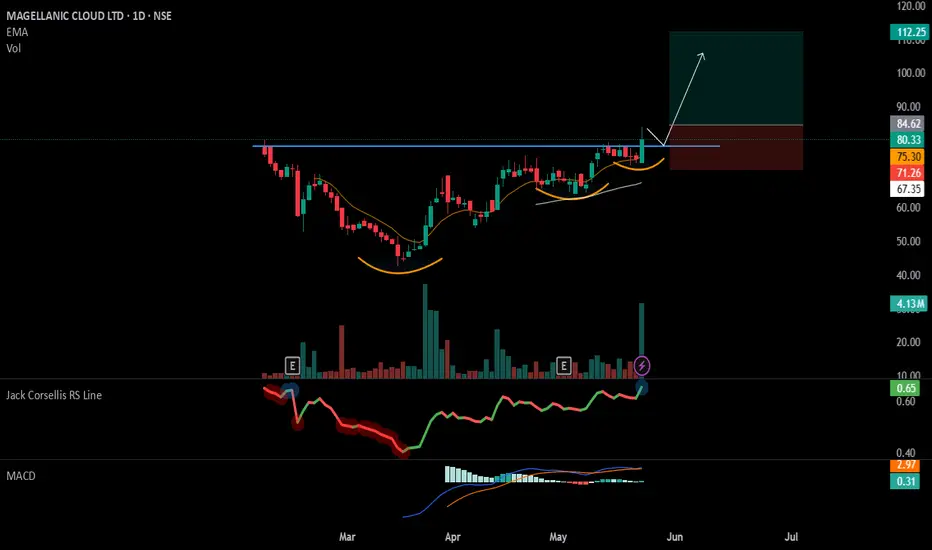
#MCLOUD - VCP + IPO Base Break Out📊 Script: MCLOUD
Key highlights: 💡⚡
📈 VCP + IPO Base BreakOut in Daily Time Frame.
📈 Price consolidated near Resistance.
📈 Volume spike seen
📈 MACD Crossover
📈 Can go for a swing trade
BUY ONLY ABOVE 85 DCB
⏱️ C.M.P 📑💰- 80.33
🟢 Target 🎯🏆 – 31%
⚠️ Stoploss ☠️🚫 – 15%
️⚠️ Important: Market conditions are Okish, Position size 50% per Trade. Protect Capital Always
⚠️ Important: Always Exit the trade before any Event.
⚠️ Important: Always maintain your Risk:Reward Ratio as 1:2, with this RR, you only need a 33% win rate to Breakeven.
✅Like and follow to never miss a new idea!✅
Disclaimer: I am not SEBI Registered Advisor. My posts are purely for training and educational purposes.
Eat🍜 Sleep😴 TradingView📈 Repeat 🔁
Happy learning with MMT. Cheers!🥂
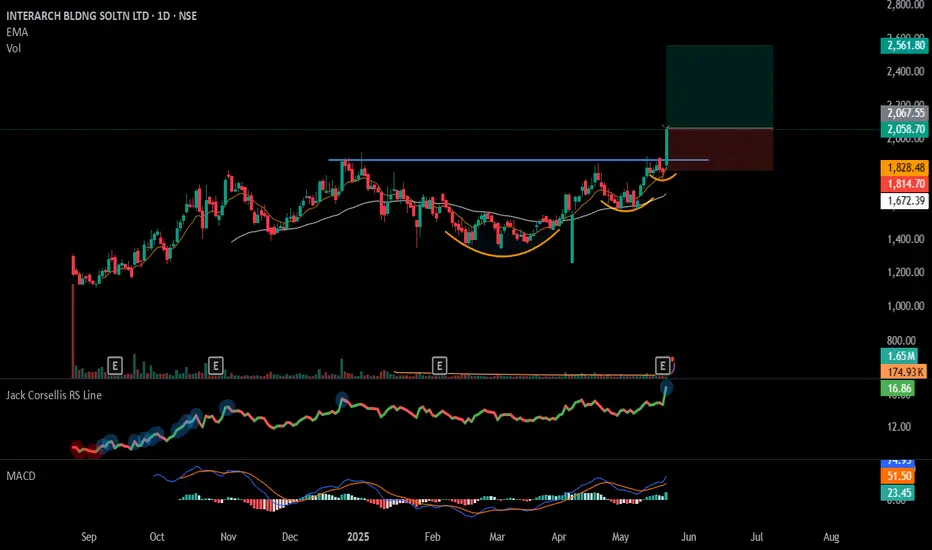
#INTERARCH - VCP BreakOut in Daily Time Frame📊 Script: INTERARCH
Key highlights: 💡⚡
📈 VCP BreakOut in Daily Time Frame.
📈 Price consolidated near Resistance.
📈 Volume spike seen
📈 MACD Crossover
📈 Can go for a swing trade
BUY ONLY ABOVE 2075 DCB
⏱️ C.M.P 📑💰- 2058
🟢 Target 🎯🏆 – 24%
⚠️ Stoploss ☠️🚫 – 12%
️⚠️ Important: Market conditions are Okish, Position size 50% per Trade. Protect Capital Always
⚠️ Important: Always Exit the trade before any Event.
⚠️ Important: Always maintain your Risk:Reward Ratio as 1:2, with this RR, you only need a 33% win rate to Breakeven.
✅Like and follow to never miss a new idea!✅
Disclaimer: I am not SEBI Registered Advisor. My posts are purely for training and educational purposes.
Eat🍜 Sleep😴 TradingView📈 Repeat 🔁
Happy learning with MMT. Cheers!🥂
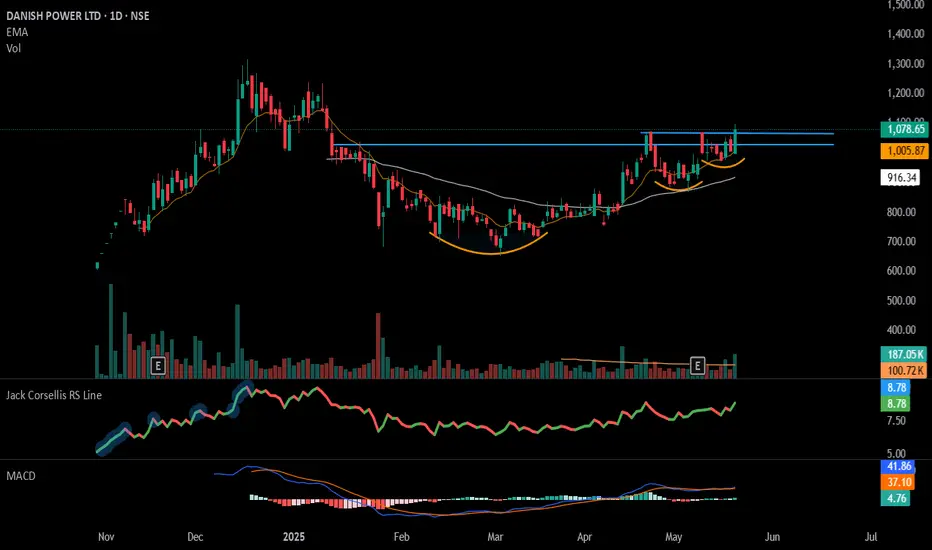
#DANISH - VCP + IPO Base in Daily Time Frame.📊 Script: DANISH
Key highlights: 💡⚡
📈 VCP + IPO Base BreakOut in Daily Time Frame.
📈 Price consolidated near Resistance.
📈 Volume spike seen
📈 MACD Crossover
📈 Can go for a swing trade
BUY ONLY ABOVE 1120 DCB
⏱️ C.M.P 📑💰- 1078
🟢 Target 🎯🏆 – NA%
⚠️ Stoploss ☠️🚫 – NA%
️⚠️ Important: Market conditions are Okish, Position size 50% per Trade. Protect Capital Always
⚠️ Important: Always Exit the trade before any Event.
⚠️ Important: Always maintain your Risk:Reward Ratio as 1:2, with this RR, you only need a 33% win rate to Breakeven.
✅Like and follow to never miss a new idea!✅
Disclaimer: I am not SEBI Registered Advisor. My posts are purely for training and educational purposes.
Eat🍜 Sleep😴 TradingView📈 Repeat 🔁
Happy learning with MMT. Cheers!🥂
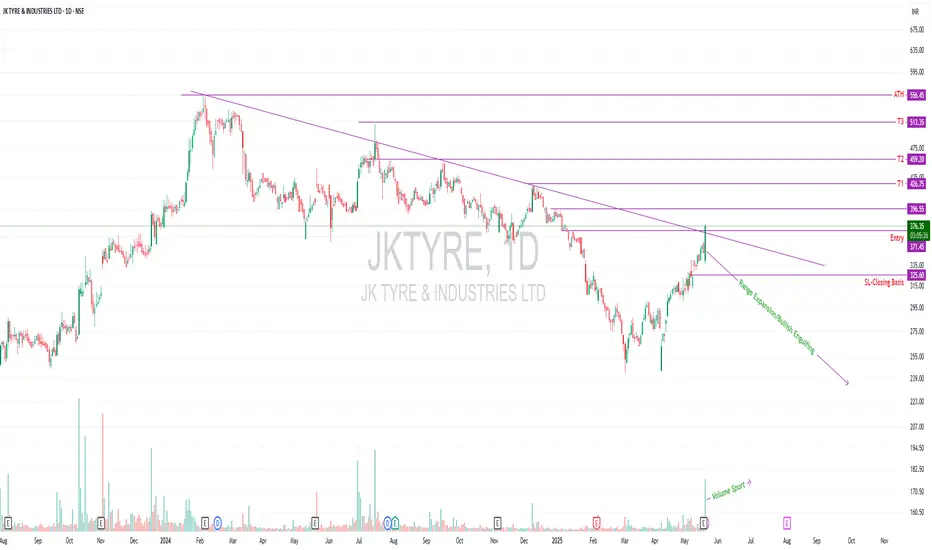
JKTYRE – Breakout Watch Setup (Daily Chart)The stock has shown a strong bullish engulfing candle backed by volume spurt, breaking above a long-standing downtrend line. Price action suggests range expansion, with momentum building toward reclaiming higher levels.
Structure is improving rapidly, with today's candle pushing the stock near its immediate breakout zone. A clean follow-through may confirm trend reversal.
🔔 Trade Plan
Entry: ₹371.45+
Stop Loss: ₹325.60 (closing basis)
Target 1: ₹426.75
Target 2: ₹459.20
Target 3: ₹513.35
ATH Zone: ₹556.45
🎯 Risk:Reward Overview
Risk (Entry to SL): ₹45.85
Reward to T1: ₹55.30 → R:R ~ 1.20
Reward to T2: ₹87.75 → R:R ~ 1.91
Reward to T3: ₹141.90 → R:R ~ 3.09
This offers a highly favourable R:R setup, especially for swing traders looking to ride trend continuation after a strong base formation.
💡 Execution Tip
You can consider taking a test quantity near ₹371–373 to gauge strength. Add more if the price sustains above ₹396.55 with momentum. Trail your SL smartly post T1.
🧠 Why It Stands Out
Breakout above falling trendline
Range expansion candle with strong body
Backed by volume — indicating institutional interest
Clean upside zone toward 1-year highs
Psychological reset above ₹400 round level
⚠️ Risk Management Is Key
As always, stick to your SL, size your position according to your risk appetite, and don’t overexpose at breakout highs. Trailing SL is your best friend in trending setups like this.
📌 Disclaimer:
This is not investment advice. I am not a SEBI-registered advisor. All content is for educational purposes only. Please do your own research and follow a well-defined trade plan.