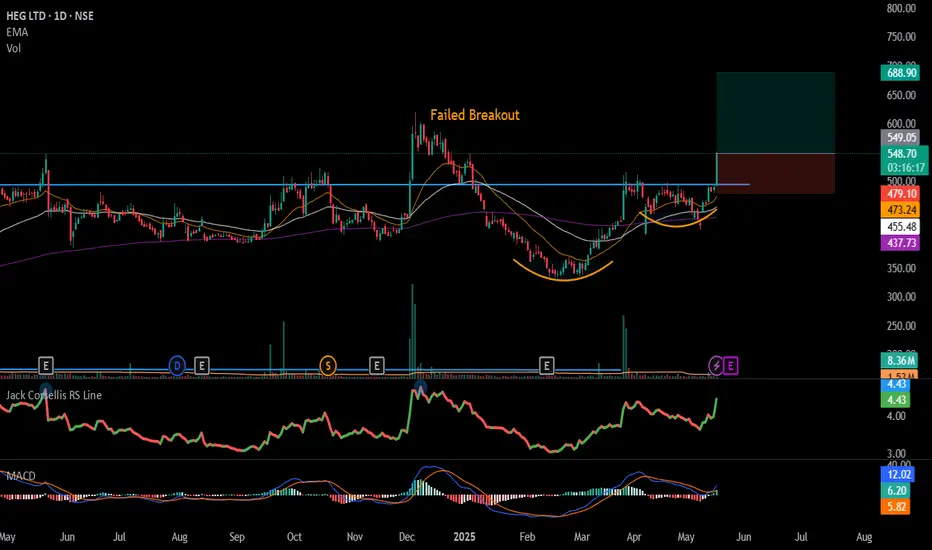
#HEG - Cup & Handel Set up in Daily Time Frame📊 Script: HEG
Key highlights: 💡⚡
📈 Cup & Handel Set up in Daily Time Frame.
📈 Price consolidated near Resistance.
📈 BO with Volume
📈 MACD Crossover
📈 Do not Enter Trade as we have Earning coming up
BUY ONLY ABOVE 545 DCB
⏱️ C.M.P 📑💰- 547
🟢 Target 🎯🏆 – NA%
⚠️ Stoploss ☠️🚫 – NA%
️⚠️ Important: Market conditions are Okish, Position size 50% per Trade. Protect Capital Always
⚠️ Important: Always Exit the trade before any Event.
⚠️ Important: Always maintain your Risk:Reward Ratio as 1:2, with this RR, you only need a 33% win rate to Breakeven.
✅Like and follow to never miss a new idea!✅
Disclaimer: I am not SEBI Registered Advisor. My posts are purely for training and educational purposes.
Eat🍜 Sleep😴 TradingView📈 Repeat 🔁
Happy learning with MMT. Cheers!🥂
VOLUMEBREAKOUT
ONWARD TECHNOLOGIES LTD📊 ONWARD TECHNOLOGIES LTD (1D) – CMP ₹313.00
📅 Published on: May 17, 2025
📈 Exchange: NSE
📌 Ticker: ONWARDTEC
🔍 Technical Chart Analysis
✅ Trendline Breakout:
A clean downtrend line breakout is visible on the daily chart, marking the end of a prolonged bearish phase. Price has decisively broken above the falling resistance trendline with a sharp bullish candle and strong volume confirmation.
✅ Volume Surge:
Breakout occurred with a 17.76% gain and significantly higher volume (1.23M), hinting at strong buying interest and possible institutional accumulation.
✅ Fibonacci Retracement Zones (from swing high ₹731.00 to low ₹207.30):
38.2% – ₹407.40
50.0% – ₹469.20
61.8% – ₹531.00
78.6% – ₹618.95
100% – ₹731.00
✅ Support Confirmation:
The price held the multi-year support zone around ₹207.97, which aligns with the 0.00% Fibo level, forming a strong base for reversal.
🧱 Key Support & Resistance Levels
🟩 Support Zones:
₹207.97 (Major long-term support)
₹265–270 (Breakout retest zone if pullback happens)
🟥 Resistance Zones (Fibonacci-based):
₹407.40 (38.2% FIB)
₹469.20 (50.0% FIB)
₹531.00 (61.8% FIB - Golden Ratio)
₹618.95
₹731.00 (Previous ATH)
📉 Timeframe: Daily (1D)
📈 Sentiment: Turning Bullish
💡 Conclusion:
After a long correction, ONWARDTEC has shown a breakout with strong volume from a downtrend line. Holding above ₹300 levels can open room for targets near ₹407–₹469 and beyond. A good setup for swing traders looking for reversal entries.
📌 Disclaimer:
This analysis is for educational and informational purposes only. Not financial advice. Please consult your advisor before making investment decisions.

PREMEXPLN - Cup & Handle Breakout | Volume Surge📊 PREMEXPLN – Cup & Handle Breakout | Volume Surge + Key Fibonacci Confluence!
🕰️ Timeframe: 1D | 📐 Pattern: Cup & Handle | 📊 Momentum: Bullish
📈 Technical Chart Overview:
Premier Explosives has executed a clean breakout above a long-term descending trendline and a cup & handle base with a massive spike in volume, hinting at a powerful trend reversal.
Price surged nearly +19% intraday, confirming strength near the 61.8% Fibonacci retracement from the previous swing high at ₹910.30 to the swing low at ₹253.40.
🔍 Chart Highlights:
☕ Cup & Handle Pattern: Formed over several months, signaling accumulation and breakout
📐 Descending Trendline: Broken with strength and volume confirmation
📊 Volume Spike: Volume highest since April 2024 – strong buyer interest
🟢 Breakout Zone: ₹472.65–₹480.00 (key previous resistance)
🔴 RSI (14): At 67.72 – approaching overbought zone, suggesting strong momentum
🧱 Support & Resistance Levels:
Level Type Price (₹)
🔼 Resistance 1 504.10 (Fib 61.8%)
🔼 Resistance 2 581.10 (Fib 50%)
🔼 Resistance 3 659.90 (Fib 38.2%)
🔻 Support 1 440.00 (Breakout Retest Zone)
🔻 Support 2 308.75 (Horizontal demand zone)
🔻 Support 3 253.40 (100% Fib low)
🔧 Indicators Used:
Fibonacci Retracement – Plotted from ₹910.30 to ₹253.40
RSI (14) – Showing bullish divergence and breaking out of consolidation
Volume Bars – Confirming breakout with institutional strength
Bull/Bear Icons – Track momentum shifts visually over RSI
🧭 Trade Outlook:
✅ Bias: Bullish
🛒 Entry Zone: Retest near ₹472.65–₹480 (ideal pullback entry)
🎯 Targets: ₹504 → ₹581 → ₹660+
❌ Invalidation: Close below ₹440 with volume
💬 Summary:
PREMEXPLN looks strong on the daily chart after breaking a classic cup & handle pattern with volume confirmation. The breakout aligns perfectly with Fibonacci retracement zones, suggesting room for continued upside. Monitor for a potential retest entry.
⚠️ Disclaimer: This is a technical analysis chart for educational purposes only. Do your own research and consult a financial advisor before trading.
🔔 Follow @PriceAction_Pulse for more breakout charts, swing trades & price action insights!
💾 Save and share if PREMEXPLN is on your watchlist this week.

DCXINDIA Breakout next stop RS 345?**Technical Pattern & Structure:**
Breakout Observed: The stock has **broken above a horizontal resistance zone** (293-294), which had acted as a cap multiple times in the past.
Chart Pattern: Appears to be a **broadening wedge** or **expanding triangle** (purple trendlines), within which price had been fluctuating for months.
Consolidation Zone: Between ₹270–₹300. Price broke out of this zone with strength.
---
**Support and Resistance:**
* **Immediate Support:** ₹310 (previous resistance turned support)
* **Strong Support:** ₹275 (bottom of recent consolidation)
* **Next Resistance Levels:**
* ₹345-347 (Trendline Intersction)
* ₹375-380 (strong horizontal resistance)
---
**Indicators:**
* **RSI (14):** \~68.47
* Approaching overbought territory but still has room for upside.
* Indicates strong bullish momentum but caution is needed for potential short-term correction.
* **Volume Analysis:**
Volume surged on the breakout day, confirming the strength and validity of the move.
---
**Caution:**
* RSI nearing overbought could cause short-term pullbacks.
* Profit booking may occur near the ₹345–₹350 range.
* Overall market sentiment should also be considered.
---

Big Bank BREAKOUT! Canara Bank Ready📉 Breakdown of the Setup:
✅ WTF CT (White Lines): 3+ confirmed touches → clean descending counter-trendline.
✅ Hidden Resistance (Dotted White Line): Clear breakout above key hidden level. Historic reaction zone.
✅ MTF Resistance (Yellow Line): Long-term resistance just above; nearing test zone (confluence resistance area ahead).
✅ Green Zone (Support/Resistance Flip):
Acted as strong support in 2024.
Fake breakdown trap ✔️
Price back above = bullish bias reinstated.
✅ Volume Surge: 124M+ on breakout candle ➕ major bullish close.

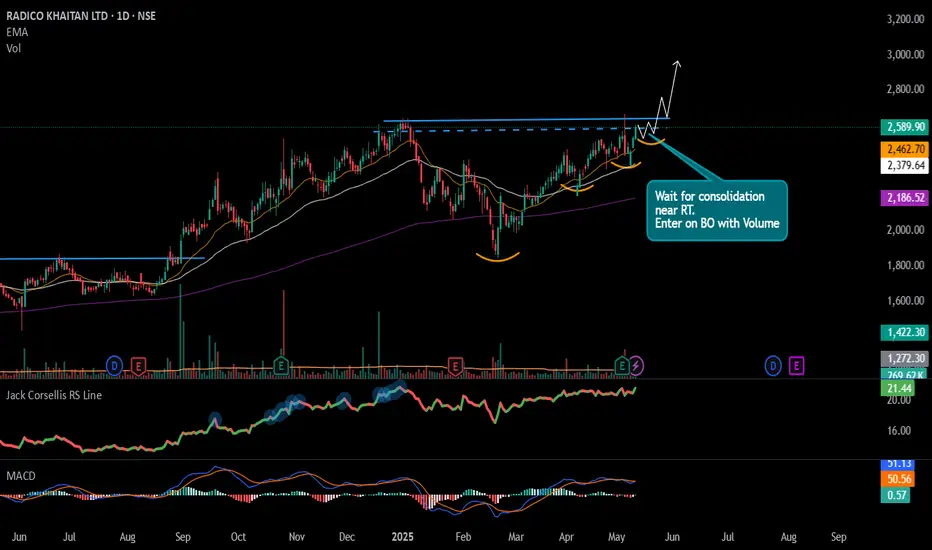
#RADICO - Potential Breakout Keep in WL📊 Script: RADICO
Key highlights: 💡⚡
📈 Roiunding Bottom Pattern / VCP Set up in Daily Time Frame.
📈 Wait for price consolidating near Resistance.
📈 Can Enter on BO with Volume spike or Wait for Pullback
📈 MACD Nutral
📈 One can go for Swing Trade.
BUY ONLY ABOVE NA DCB
⏱️ C.M.P 📑💰- 2589
🟢 Target 🎯🏆 – NA%
⚠️ Stoploss ☠️🚫 – NA%
️⚠️ Important: Market conditions are Okish, Position size 50% per Trade. Protect Capital Always
⚠️ Important: Always Exit the trade before any Event.
⚠️ Important: Always maintain your Risk:Reward Ratio as 1:2, with this RR, you only need a 33% win rate to Breakeven.
✅Like and follow to never miss a new idea!✅
Disclaimer: I am not SEBI Registered Advisor. My posts are purely for training and educational purposes.
Eat🍜 Sleep😴 TradingView📈 Repeat 🔁
Happy learning with MMT. Cheers!🥂
MAN INDUSTRIES – Explosive CT Breakout with Volume Cluster Surge🔴 CT Breakout: The red trendline marks a major weekly CT, now decisively breached by a strong bullish candle.
📈 Volume Cluster Breakout: This is not a one-week spike — it's a cluster of multiple high-volume weeks, indicating consistent accumulation before the breakout. Current volume stands tall at 2.23M+, validating this move.
🟢 Demand Zones Respected: Price respected key demand zones (green boxes) on multiple occasions, forming a strong base with higher lows.
⚪ Hidden Resistances Cleared: Two dotted white hidden resistance lines have been cleanly taken out, suggesting deeper supply has been absorbed.
🟥 Supply Zone Ahead: The next visible hurdle, giving the current move significant open air to run.

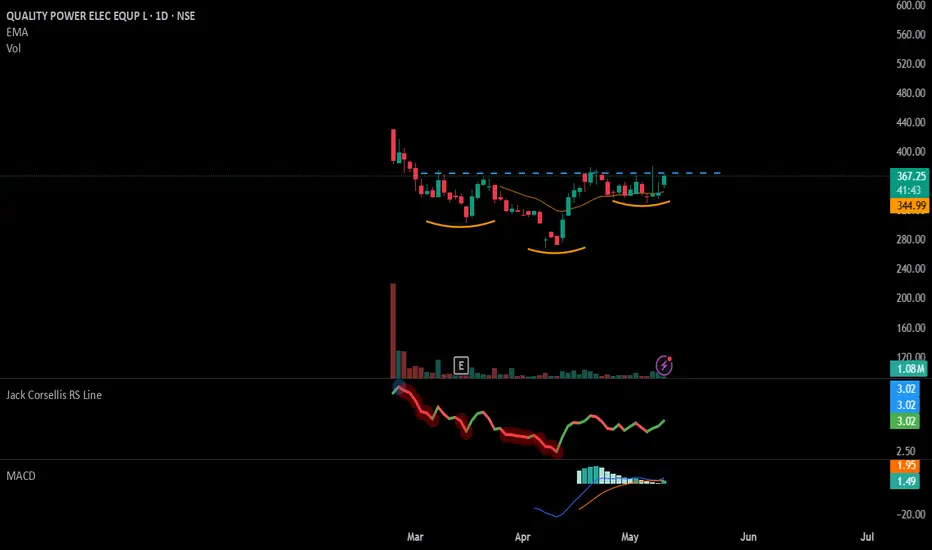
#QPOWER - IPO Stock Keep In Watch List📊 Script: QPOWER
Key highlights: 💡⚡
📈 Inverse Head & Shoulders in Daily Time Frame.
📈 Price consolidating near Resistance.
📈 Can Enter on BO with Volume spike.
📈 MACD Bounce
📈 One can go for Swing Trade.
BUY ONLY ABOVE 380 DCB
⏱️ C.M.P 📑💰- 376
🟢 Target 🎯🏆 – NA%
⚠️ Stoploss ☠️🚫 – NA%
️⚠️ Important: Market conditions are Okish, Position size 50% per Trade. Protect Capital Always
⚠️ Important: Always Exit the trade before any Event.
⚠️ Important: Always maintain your Risk:Reward Ratio as 1:2, with this RR, you only need a 33% win rate to Breakeven.
✅Like and follow to never miss a new idea!✅
Disclaimer: I am not SEBI Registered Advisor. My posts are purely for training and educational purposes.
Eat🍜 Sleep😴 TradingView📈 Repeat 🔁
Happy learning with MMT. Cheers!🥂
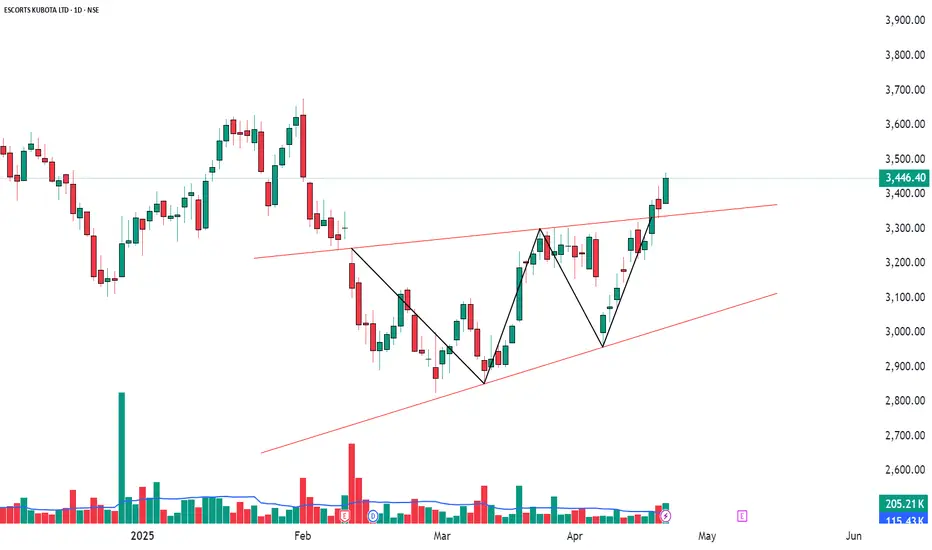
Bullish Signal with EMA Crossover and TTM SqueezeESCORTS (2.64%)
Bullish Signal with EMA and TTM Squeeze Breakout
ESCORTS shows a promising bullish setup, with a Strong Bullish Candle and an EMA 200 Crossover signaling a potential long-term trend reversal. The RSI Breakout and Bollinger Band Breakout further confirm the bullish outlook. A TTM Squeeze breakout also indicates increasing volatility, which could propel the stock further upwards.
Resistance Levels: 3482-3517-3572
Support Levels: 3392-3338-3302
Entry: @/above 3463.20
Stop Loss: @/below 3244.80
Volume Analysis: Volume has been increasing steadily, with higher than the average volume of 115.43K on 23rd April. This shows increased investor activity and potential momentum building.
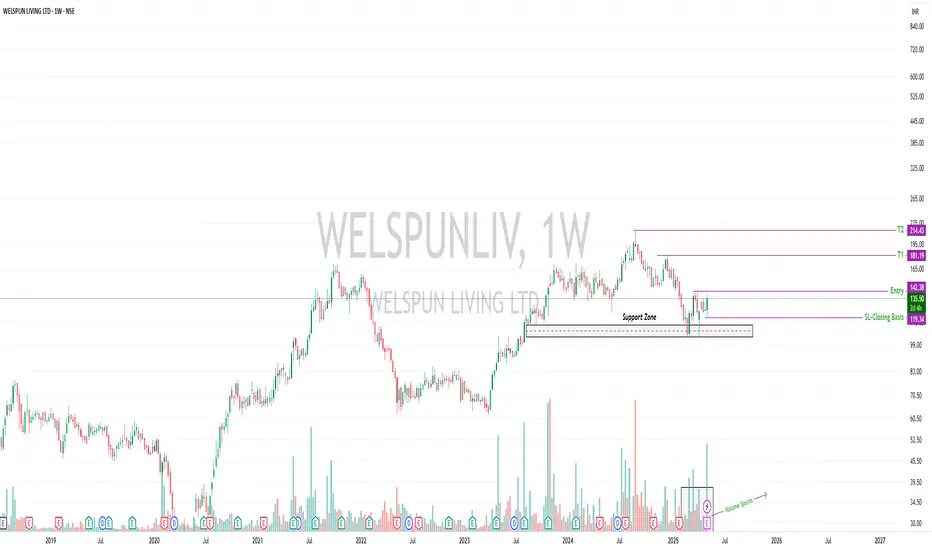
WELSPUNLIV | Weekly Confluence | Volume-Based Bounce Setup🧿 WELSPUNLIV | Weekly Confluence | Volume-Based Bounce Setup
Welspun Living Ltd | Positional Trade Idea
🔍 Why This Stock?
Price bounced strongly from the ₹110–₹120 support zone, which has held for over a year.
Bullish engulfing candle on daily TF, aligning with a weekly reversal.
Massive volume spike (7–8x average) suggests smart money accumulation.
Reclaiming the 50 DMA, showing signs of early momentum.
Weekly structure shows a potential base formation with volume confirmation.
📈 Trade Setup
Entry: ₹142.4 (after a strong daily close above this level)
Stop Loss (Closing Basis): ₹119.3
Target 1: ₹181
Target 2: ₹214
💰 Risk–Reward
Risk = ₹142.4 − ₹119.3 = ₹23.1
Reward to T1 = ₹181 − ₹142.4 = ₹38.6
Reward to T2 = ₹214 − ₹142.4 = ₹71.6
📊 Final R:R
R:R to T1 = 1 : 1.67
R:R to T2 = 1 : 3.10
Risk from Entry = 16.2%
⚠️ Risks to Consider
Still below 30 DMA & 200 DMA → trend is not confirmed yet.
The broader market (Nifty 500) is also trading below 200 DMA.
Geopolitical volatility + uncertainty heading into late 2025.
Expect pullbacks, shakeouts, and false breakouts.
Drawdown potential = 16.2% — size your position carefully.
🧠 Entry Conditions
Wait for a strong close above ₹142.4 with volume confirmation.
No early entries. Watch for follow-through next session.
Avoid jumping in during intraday spikes — confirmation is key.
🛡️ Risk Management
Position sizing is everything. Don’t YOLO a high-volatility setup.
Respect the SL — this is not optional.
High R:R setups are worthless if you get stopped out oversized.
Volatility in 2025 is expected to be brutal — trade like a sniper, not a machine gun.
Quarterly results are around the corner — trade with caution as earnings volatility can invalidate technical setups.
If the trade moves in our favour and approaches the all-time high, we will review the setup for fresh risk-reward alignment and partial booking.
#volume #breakout #positional #priceaction
📜 Disclaimer
This is a personal market view. Not a recommendation. For educational purposes only. Please consult your registered financial advisor before making trading decisions.
NIIT LTD - Bullish Reversal Setup📊 NIIT LTD – Bullish Reversal Setup
🕰️ Timeframe: 1D | 🧩 Pattern: Double Bottom
🔍 Technical Chart Overview:
NIIT is showing a strong Double Bottom reversal pattern on the daily chart — a classic signal of potential trend reversal from bearish to bullish.
After bouncing from the major support zone near ₹105, the price has broken out above the neckline (around ₹133.5) on strong volume, indicating bullish conviction.
🔑 Key Technical Levels:
🔵 Resistance Levels:
₹159.70
₹171.50
🔴 Support Levels:
₹133.50 (neckline retest zone)
₹127.90 (minor support)
₹105.00 (base support)
📈 Breakout Confirmation:
Price has broken above the neckline with a high volume spike, confirming the double bottom breakout.
Next targets lie in the ₹159–₹171 range, aligning with previous supply zones.
📊 Volume & Price Action Notes:
Recent bullish candles with above-average volume
Potential retest of neckline could offer a favorable risk-reward entry
🧠 Bias: Bullish (as long as price holds above ₹133.5)
📌 Chart Indicators Used:
📉 Volume Spike confirmation
🔃 Double Bottom Pattern
🔍 Key S/R Levels marked
📍 Entry/Target Path projection with arrow
⚠️ Disclaimer: This analysis is for educational purposes only and not financial advice. Please DYOR before making trading decisions.
📈 Follow for more actionable chart patterns | PriceAction_Pulse
💬 Drop a comment if you're tracking NIIT!

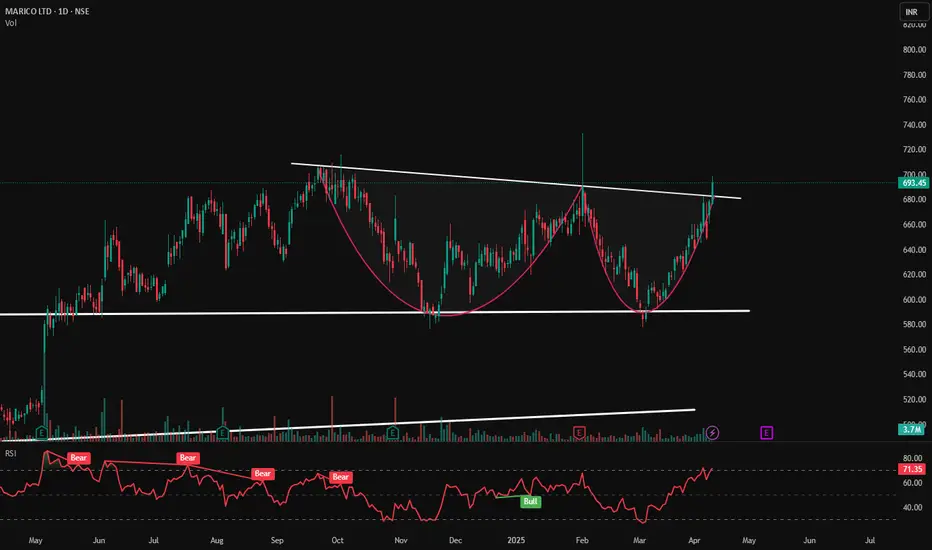
Marico Ltd- Cup & Handle Breakout Forming?Marico Ltd.—Cup & Handle Breakout Forming? ☕️📈
📆 Date: April 10, 2025
📊 Chart Analysis:
Marico is showing a classic "cup & handle" pattern, a bullish continuation setup. The price has successfully broken above the neckline resistance, indicating a potential for upward continuation if volume sustains.
📌 Key Levels:
🛑 Resistance (neckline—now flipped to support): ₹685
✅ Support (Base of Cup): ₹580
🔼 Immediate Resistance Targets: ₹710 ➡️ ₹735 ➡️ ₹765
📈 Indicators & Technicals:
☕ Cup & Handle Pattern clearly visible with a rounded bottom and breakout above resistance.
🔍 RSI at 71.35 shows bullish momentum but is slightly overbought —a sign of strength with caution.
💹 Volume steadily increasing — confirms accumulation phase and breakout intent.
🟥 Multiple "Bear" RSI icons (prior weakness) followed by a ✅ "Bull" label hinting at a momentum shift.
📉 Bearish divergence in RSI is now getting invalidated by price strength and pattern breakout.
🧠 Trade Plan:
📌 Entry near ₹685–₹695 breakout zone
🎯 Targets: ₹710 ➡️ ₹735 ➡️ ₹765
❌ SL: ₹670 (below neckline)
📌 Disclaimer: For educational purposes only. Do your own research or consult with a SEBI-registered advisor before trading or investing
Skipper Ltd Breakout Alert: Range Breach with Volume🔍 Short Technical Analysis – Skipper Ltd (NSE)
📆 Date: May 2, 2025
Chart Timeframe: Daily
CMP: ₹483.05
Breakout Type: Range Breakout
Volume: Significant surge on breakout candle – confirms strength
✅ Key Observations:
Range Breakout: The stock has broken out of a prolonged consolidation zone (~₹420–₹470) on strong volume. This confirms bullish intent.
Stop Loss: Marked just below the breakout zone (~₹440), a safe cushion for risk management.
Moving Averages:
Trading above the 200 EMA (red), a bullish signal.
Stock is also clearing the 50 EMA (blue), indicating momentum shift.
RSI: Trending upward, around 60 – not overbought yet, room for further upside.
🎯 Target Levels:
Target 1: ₹610
Target 2: ₹665
These are based on prior swing highs and resistance levels.
🛑 Risk Management:
Stop Loss: ₹440
Reward-to-risk ratio looks favorable if the trend sustains.

Strong Bullish Momentum and Volume SurgeAUBANK (8.41%)
Bullish Momentum Building
AUBANK is showing promising bullish signs across several technical indicators. A Bullish Marubozu candlestick has formed, complemented by an RSI Breakout, signaling a shift toward bullish momentum. The stock has broken out of the Bollinger Bands, with VWAP and Volume confirming the strength of this move.
Resistance Levels: 684-702-733
Support Levels: 634-602-584
Entry: @/above 669.90
Stop Loss: @/below 590.75
Volume Analysis: A significant volume breakout was observed on April 23rd, surpassing the average volume of 4.65M, suggesting strong market interest and buying power.
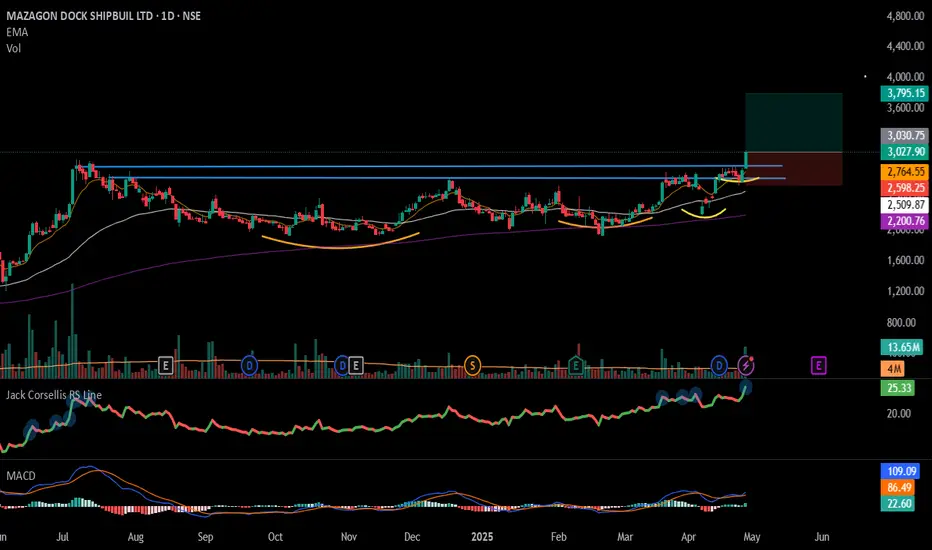
#MAZDOCK - VCP Break Out in Daily Time Frame📊 Script: MAZDOCK
Key highlights: 💡⚡
📈 VCP Break Out in Daily Time Frame.
📈 Price consolidated near Resistance.
📈 BO with Volume spike.
📈 MACD Bounce
📈 RS making 52WH
📈 One can go for Swing Trade.
BUY ONLY ABOVE 3030 DCB
⏱️ C.M.P 📑💰- 3027
🟢 Target 🎯🏆 – 25%
⚠️ Stoploss ☠️🚫 – 14%
️⚠️ Important: Market conditions are Okish, Position size 50% per Trade. Protect Capital Always
⚠️ Important: Always Exit the trade before any Event.
⚠️ Important: Always maintain your Risk:Reward Ratio as 1:2, with this RR, you only need a 33% win rate to Breakeven.
✅Like and follow to never miss a new idea!✅
Disclaimer: I am not SEBI Registered Advisor. My posts are purely for training and educational purposes.
Eat🍜 Sleep😴 TradingView📈 Repeat 🔁
Happy learning with MMT. Cheers!🥂
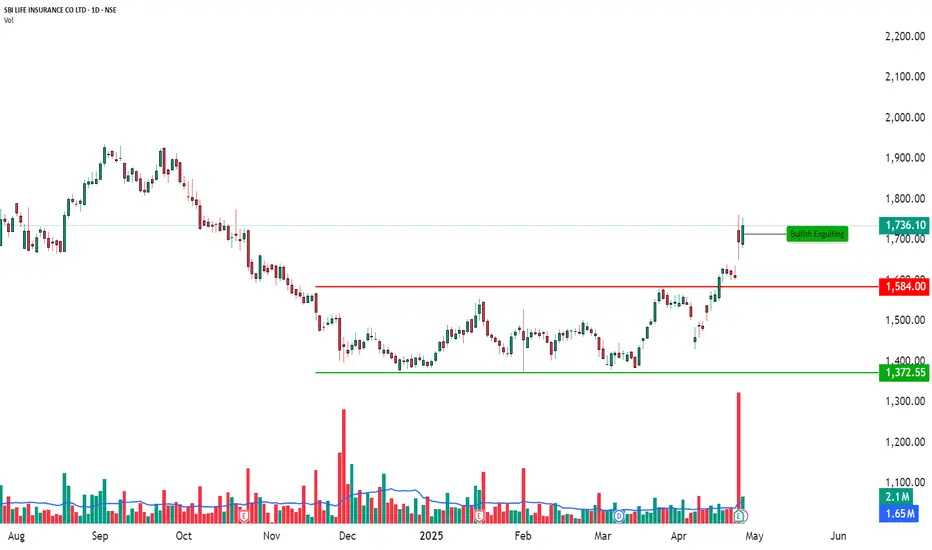
Breakout with Bullish Engulfing Confirmation | Daily Chart🏦 SBI LIFE INSURANCE CO LTD – Breakout with Bullish Engulfing Confirmation | Daily Chart
📅 Date: April 28, 2025
📈 Timeframe: Daily Chart
🔍 Stock: SBI Life Insurance Co Ltd (NSE)
📌 Technical Overview:
SBI Life is showing strong bullish momentum on the daily chart after breaking out above a key horizontal resistance around ₹1,584.
The price has formed a Bullish Engulfing candlestick pattern, indicating renewed buyer strength, backed by heavy volume.
🧩 Chart Pattern:
Strong horizontal resistance at ₹1,584 (now acting as support).
Bullish Engulfing candle printed around ₹1,736.10, showing strong rejection of lower levels.
Price structure continues to maintain higher highs and higher lows – a positive sign for bulls.
🔍 Key Price Levels:
Support Zones: ₹1,584(marked in red)
Major Support: ₹1,372.55(green horizontal line)
Current Market Price (CMP): ₹1,736.10
A sustained move above ₹1,736 with rising volume could potentially take the stock towards higher psychological levels around ₹1,800+.
📊 Volume Analysis:
Strong volume breakout observed during the recent rally.
Volume spike supports the validity of the bullish breakout, indicating increased buying interest.
🧠 Observational Bias:
As long as SBI Life holds above ₹1,584, the short-term to medium-term bias remains positively bullish. Any healthy pullbacks near ₹1,580–₹1,600 zones could offer better risk-reward setups for positional traders.
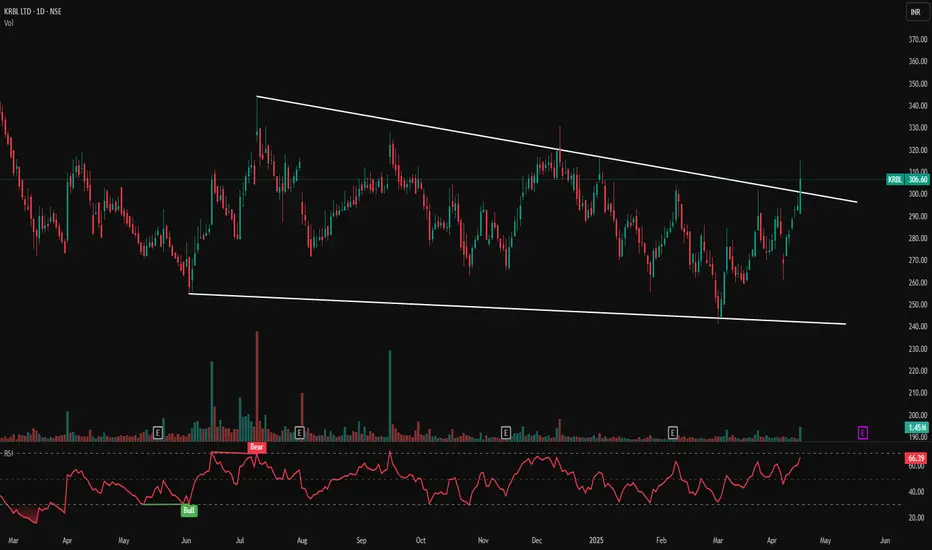
KRBL LTS- Falling Wedge Breakout | Trend Reversal Signal Ahead?KRBL LTD – Falling Wedge Breakout 💥 | Trend Reversal Signal Ahead?
📅 Published on: April 17, 2025
📈 Technical Analysis:
KRBL has shown a bullish breakout from a long-term falling wedge pattern on the daily chart — a classic reversal pattern signalling a potential upward move after prolonged consolidation. The breakout candle is supported by strong volume and a bullish RSI setup.
Pattern: Falling Wedge (Bullish)
Breakout Price: ₹306.60
Previous Resistance Line: Now acting as support
Breakout Volume: 1.45M (above average)
🧭 Key Support & Resistance Levels:
Immediate Support: ₹290
Major Support: ₹275
Immediate Resistance: ₹315
Next Resistance Zone: ₹330 – ₹345
Trendline Resistance (Broken): ₹300 (now support)
🔍 Indicators:
RSI (Relative Strength Index):
Current RSI: 66.39 — bullish, nearing overbought zone, shows strong momentum.
RSI Bullish Crossover observed in April, indicating accumulation before breakout.
🧠 Price Action Observations:
Price respected the wedge formation since March 2024.
A strong bullish candle broke above the upper wedge with conviction.
RSI confirms strength, aligning with price action breakout.
Volume surge supports the breakout's validity.
📌 Strategy (For Educational Purposes):
Entry: ₹305–310 (on retest)
Stop Loss: ₹285 (below wedge support)
Targets:
₹330
₹345
₹360+
📊 Visual Markings & Icons:
White Trendlines: Highlighting falling wedge support and resistance.
Bullish RSI Tags: Marking key bullish RSI crossovers.
Volume Spikes: Notable on breakout day.
Breakout Candle: Large green candle breaching the upper wedge line.
⚠️ Disclaimer:
This analysis is for educational and informational purposes only. Please consult your financial advisor before making any trading decisions.
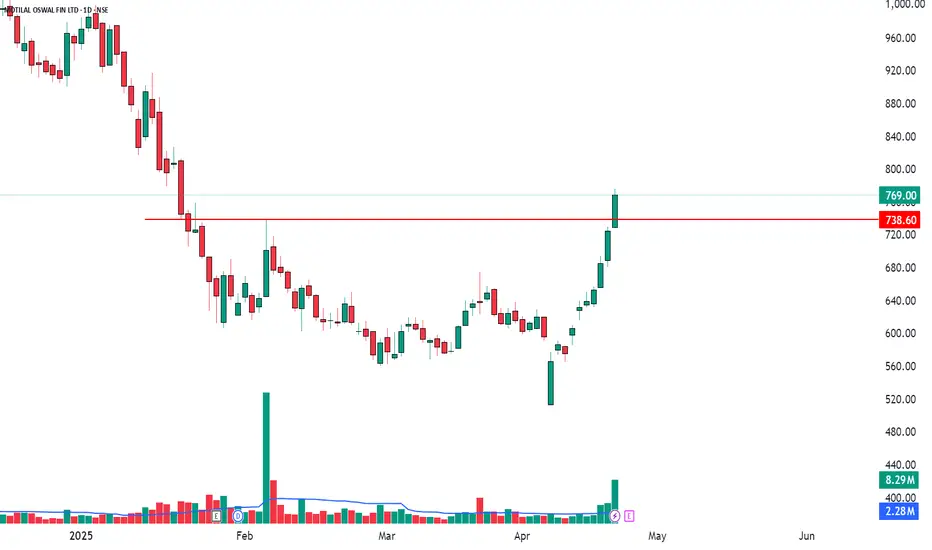
Bullish Momentum with RSI and Bollinger BreakoutMOTILALOFS (6.16%)
Bullish Trend and Breakout
MOTILALOFS is showing strong bullish momentum, with a Bullish Marubozu candlestick signaling the continuation of upward momentum. The RSI Breakout and Bollinger Band Breakout both point to an increase in buying pressure. The volume has seen a notable uptick, confirming the strength of the bullish move.
Resistance Levels: 787-805-834
Support Levels: 740-711-693
Entry: @/above 775.95
Stop Loss: @/below 653.65
Volume Analysis: Volume has been significantly higher than average, with a noticeable volume of 8.29M on 23rd April. This suggests that institutional or large players might be entering the stock.
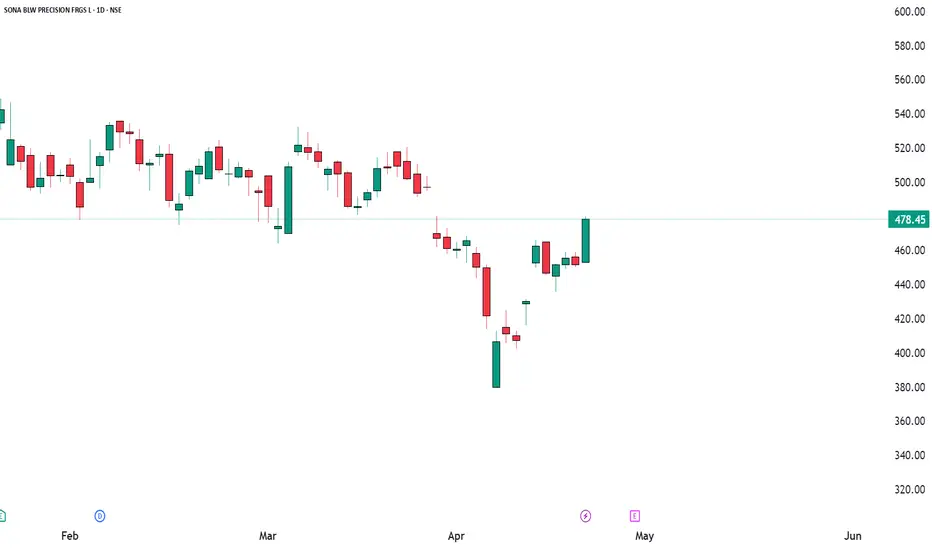
Bullish Breakout SetupSONACOMS (5.95%)
Bullish Setup Alert
We are seeing a strong bullish signal for SONACOMS, with multiple key indicators aligning for a potential breakout. A Bullish Marubozu candlestick has formed, indicating strong bullish momentum. Additionally, the RSI has broken out, signaling increasing buying strength. The SuperTrend and VWAP both confirm bullish sentiment, while the TTM Squeeze suggests a volatility breakout in the making.
Resistance Levels: 488-497-515
Support Levels: 461-444-434
Entry: @/above 479.85
Stop Loss: @/below 448.30
Volume Analysis: Volume has been robust, which could suggest accumulation and increased market interest.
Hindustan Foods Ltd-Symmetrical Triangle Breakout!Hindustan Foods Ltd.—Symmetrical Triangle Breakout! 🚀📈
📅 Published on: April 12, 2025
📊 Chart Insight:
HNDFDS has broken out of a well-formed symmetrical triangle pattern on the daily chart, signaling a potential bullish continuation. The breakout is accompanied by a solid green candle and volume surge, hinting at strong momentum ahead.
🔍 Key Technical Highlights:
🔺 Pattern: Symmetrical Triangle (Lower highs + Higher lows)
📏 Breakout Level: ₹560
📈 Current Price: ₹571.65 (+4.03%)
📊 Volume Spike: 109.28K—a notable increase compared to recent sessions
📌 Support & Resistance Levels:
Immediate Support: ₹560 (breakout level)
Next Support (lower trendline): ₹530
Resistance Levels to Watch:
₹586 (minor supply zone)
₹615
₹645 (swing high)
📉 RSI Indicator:
Current RSI: 60.40—strong upward move, not yet overbought
Hidden Bullish Divergence (visible on chart): RSI made higher lows while price was consolidating—early bullish signal
Bearish markers now invalidated post-breakout
🧠 Trade Idea / Strategy:
📥 Buy on dips near ₹560–₹565 if price retests breakout
🛑 Stop-loss: ₹530 (below ascending trendline)
🎯 Targets: ₹586 ➡ ₹615 ➡ ₹645
📘 Note: Triangle breakouts typically indicate strong price movement after consolidation. Volume confirmation adds conviction.
🔔 Disclaimer: This chart is for educational purposes only. Do your own analysis or consult a financial advisor before investing.

Ujjivan Small Finance Bank-Breakout from Downtrend!Ujjivan Small Finance Bank—Breakout from Downtrend! 🔥
📆 Date: April 9, 2025
📊 Chart Analysis:
UJJIVANSFB has convincingly broken out of a long-standing falling trendline, indicating renewed bullish momentum. The breakout is supported by a strong bullish candle and above-average volume, suggesting a potential trend reversal.
📌 Key Levels:
🛑 Resistance (Breakout Zone): ₹38
✅ Support (Base Formation): ₹30.95
🔼 Immediate Resistance Levels: ₹42, ₹46, ₹50
📈 Indicators & Observations:
📉 Downtrend line broken after multiple rejections—a bullish sign.
🔍 RSI at 67.5—approaching the overbought zone but showing strong momentum.
📊 Volume surge at 32.46M suggests institutional interest and confirmation of breakout.
📌 RSI Bullish Label (Green “Bull” icon) confirms momentum strength earlier.
🧠 Strategy Ideas:
Retesting near the ₹37–₹38 zone can be a buy-on-dip opportunity.
Targets: ₹42 ➡️ ₹46 ➡️ ₹50
SL: Below ₹36 (trendline)
📌 Disclaimer: This analysis is for educational purposes only. Always do your own research or consult a SEBI-registered advisor before investing

RBL Bank Ltd- Range Breakout + Trendline Break!RBL Bank Range Breakout + Trendline Break! 💥🚀
📅 Published on: April 16, 2025
📊 Chart Insight:
RBLBANK has given a dual breakout—piercing above a long-standing descending trendline and breaking out of a rectangle consolidation zone. This combo setup indicates a potential trend reversal or continuation rally from here on.
🔍 Technical Highlights:
🔺 Pattern: Rectangle range breakout + descending trendline breakout
🟪 Consolidation Range: ₹148–₹178 (marked in purple)
📈 Breakout Candle Close: ₹181.57
📊 Volume Surge: 218.23K—strong bullish confirmation
📌 Support & Resistance Levels:
🟢 Immediate Support: ₹178 (top of the rectangle zone)
🟢 Next Strong Support: ₹164 (middle of the rectangle)
🔴 Resistance Levels to Watch:
₹188 (trendline zone retest)
₹198
₹212 (gap fill level)
📈 Trendline Analysis:
Price has broken above the major descending trendline from April 2024 highs.
This trendline had been acting as dynamic resistance and is now a potential trend shifter.
🧠 Trade Idea/Strategy:
💹 Entry: Near ₹178–₹181 (post-breakout retest ideal)
🛑 Stop-loss: Below ₹164
🎯 Targets: ₹188 ➡ ₹198 ➡ ₹212
📍 Visual Indicators Used:
✅ Rectangle drawn to capture sideways accumulation
✅ Trendline from previous highs marking resistance
✅ Volume spike indicating strong buying interest
📘 Note: Multiple timeframe confirmation is advised. Volume and structure align well with bullish bias.
🔔 Disclaimer: Educational post only. Always do your own research or consult with a SEBI-registered advisor

#HCG - VCP Break Out in Daily Time Frame📊 Script: HCG
Key highlights: 💡⚡
📈 VCP Break Out in Daily Time Frame.
📈 Okish Price consolidation near Resistance.
📈 BO with Volume spike.
📈 MACD Bounce
📈 RS making 52WH
📈 One can go for Swing Trade.
BUY ONLY ABOVE 570 DCB
⏱️ C.M.P 📑💰- 574
🟢 Target 🎯🏆 – NA%
⚠️ Stoploss ☠️🚫 – NA%
️⚠️ Important: Market conditions are bad, Position size 20% per Trade. Protect Capital Always
⚠️ Important: Always Exit the trade before any Event.
⚠️ Important: Always maintain your Risk:Reward Ratio as 1:2, with this RR, you only need a 33% win rate to Breakeven.
✅Like and follow to never miss a new idea!✅
Disclaimer: I am not SEBI Registered Advisor. My posts are purely for training and educational purposes.
Eat🍜 Sleep😴 TradingView📈 Repeat 🔁
Happy learning with MMT. Cheers!🥂
