SILVER - HEALTHY CONSOLIDATION LONGSSilver doing a healthy consolidation - momentum intact.
very strong support for momentum to continue is $90, belov that momentum vill be lost.
small resistance at $93.50
major resistance at $95.50 - $96
above $96 v should likely test 3digits - $100.
above that vill be a price discovery one can trail at ST 1.5 on 75m chart.
Volumeprofileanalysis

SILVER - BREAKOUT LONGS R1 - $76.5 -$77
R2 - $78.5 - &79
S1 - $72 (DAILY)
S2 - $70 (VEEKLY)
Above $79 on daily close - Vallhalla !!!

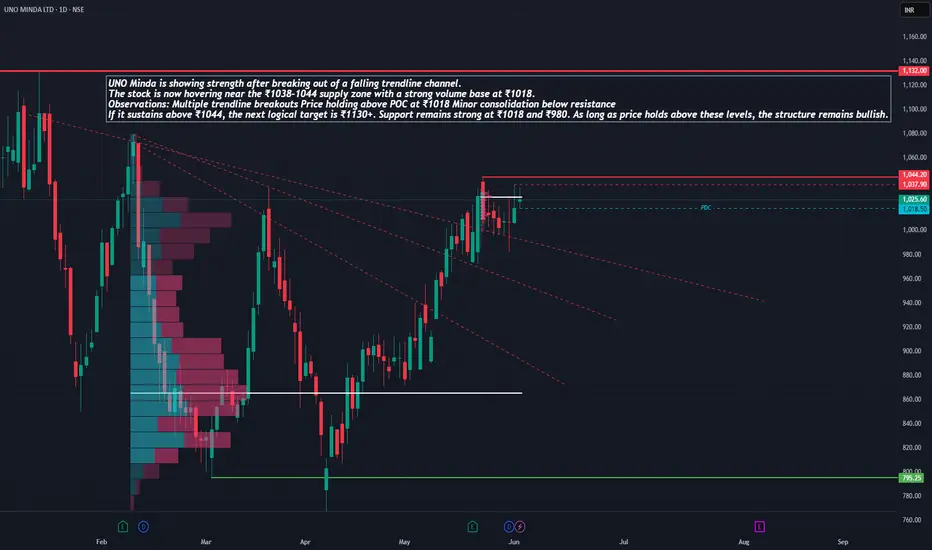
UNO MINDA – Ready to Revisit All-Time Highs?UNO Minda is showing strength after breaking out of a falling trendline channel. The stock is now hovering near the ₹1038–1044 supply zone with a strong volume base at ₹1018.
Observations:
Multiple trendline breakouts
Price holding above POC at ₹1018
Minor consolidation below resistance
If it sustains above ₹1044, the next logical target is ₹1130+. Support remains strong at ₹1018 and ₹980. As long as price holds above these levels, the structure remains bullish.
Like, comment your thoughts, and share this post
Explore more stock ideas on the right hand side your feedback means a lot to me!
Disclaimer: This post is for educational purposes only and should not be considered a buy/sell recommendation.
GOLD MARKET UPDATE 11/19 – STRUCTURE HAS SHIFTED1. Market Structure
Gold has broken above the H4 downtrend line and completed a successful retest around 4,060–4,070.
The strong push toward 4,100 confirms a transition from bearish → short-term bullish.
Structural Signals:
Buyers are gaining control as price continues forming higher lows
The POC zone 4,072–4,075 has turned into strong support
Intraday structure is leaning clearly toward a bullish recovery
2. Technical Breakdown – H1 & H4
H4 Trend
After the previous strong drop, price is forming a potential bottom around 4,030–4,050
H1 Trend
The short-term bullish trend is confirmed after breaking and retesting the descending trendline
3. Key Levels to Watch
Support Zones
4,072–4,075 → POC – major support maintaining the bullish structure
4,060–4,065 → minor support – quick-reaction area
Resistance Zones
4,108–4,112 → first resistance (H1/H4 confluence)
4,147–4,150 → strong H4 resistance, potential higher target if bullish continuation remains
⚠️ Disclaimer
This analysis is for informational and educational purposes only and does not constitute financial advice. Trading involves risk, and you should always conduct your own research before making any trading decisions.

Nifty- Action Near the TopFrom technical perspective there is a triangular contraction formation (which extended from July to Mid-October) seen on this 75 minutes Nifty chart. It was followed by a strong breakout in the mid-October giving a vertical rise scenario.
➡As it is pulling back, there is a Support zone near 25850 (Volume Point of Control), which if holds might take the Index to new highs or at least to its previous highs.
Even if this support holds, I expect a slow grinding action with wide range swings on both the sides near previous highs.
➡A second scenario could be that 25850 doesn't holds. In this case we can expect a test of next potential support zone near 25330.
This was also the breakout zone of the triangle contraction, so the sellers might take it there for a retest before the price pushes back up.
What do you think at this point?
💬Will it hold the current support, or will it move to the next support?
📣Not a buy-sell recommendation, for educational purpose only.
Boost & comment for more such ideas in future.

Edelweiss - Double Bottom Reversal PatternNSE:EDELWEISS Made Beautiful Chart Structure today Before Q4 Results with Good Price and Volume action.
Today's Price Action:
- The stock has been in a clear downtrend since December 2024, forming a descending resistance line (white trendline)
- Recently broke above this major downtrend line with strong momentum
- Current price at ₹86.44, up 5.50 points (+6.80%) in today's session
- The stock appears to have formed a Double bottom Pattern around the ₹75 levels, confirming a potential reversal
Volume Analysis:
- Volume spike visible in today's session (13.85M shares traded)
- The previous volume averaged around 5.6M shares
- This high-volume breakout suggests strong buying conviction
- Volume confirms the price movement, adding credibility to the breakout
Key Supports and Resistances:
- Strong resistance zone at ₹87-90 (previous consolidation area marked by red horizontal line)
- Key support established at ₹75-77 (green horizontal line)
- Previous support at ₹86-87 may now act as resistance that needs to be cleared decisively
Trade Setup:
Entry Points:
1. Aggressive Entry: Current level (₹86.44) with partial position size
2. Conservative Entry: On breakout confirmation above ₹90 with closing price
3. Pullback Entry: If price retraces to the ₹82-83 range (previous breakout level)
Exit Strategy:
- Target 1: ₹95 (first resistance level)
- Target 2: ₹105 (previous support turned resistance)
- Target 3: ₹115-120 (major resistance zone from January-February 2025)
- Trailing Stop: Consider implementing a 5% trailing stop after achieving Target 1
Stop Loss Placement:
- Aggressive Stop: Below today's low (approximately ₹82)
- Conservative Stop: Below the green support line at ₹75
- Double Bottom Pattern-Based Stop: Below ₹73
Risk Management:
- Position sizing: Limit to 1-2% risk of total capital per trade
- Risk-reward ratio: Minimum 1:1 for aggressive entry, 1:1.5 for conservative entry
- Consider scaling out of position at each target level (e.g., 33% at each target)
The improved price action comes after several months of decline, with the potential Double Bottom pattern suggesting a possible trend reversal if completed successfully.
Keep in the Watchlist.
NO RECO. For Buy/Sell.
📌Thank you for exploring my idea! I hope you found it valuable.
🙏FLLOW for more
👍BOOST if useful
✍️COMMENT below with your views.
Meanwhile, check out my other stock ideas on the right side until this trade is activated. I would love your feedback.
Disclaimer: "I am not SEBI REGISTERED RESEARCH ANALYST AND INVESTMENT ADVISER."
This analysis is intended solely for informational and educational purposes and should not be interpreted as financial advice. It is advisable to consult a qualified financial advisor or conduct thorough research before making investment decisions.

Aether Industries has been consolidating?Aether has been consolidating for almost a year within a falling wedge pattern, a structure that often signals the end of a downtrend. Recently, the stock has shown signs of bottoming out near the ₹740–750 zone, where it found strong demand in the past as well.
• This base has now formed two key bottoms, which indicate potential accumulation by long-term investors. The volume is gradually increasing near the lower end of the wedge, which may suggest silent buying.
• From a fundamental perspective, Aether operates in the specialty chemicals sector with a focus on niche products and R&D capabilities. The sector has long-term tailwinds due to India's growing role as a global chemical supplier. Aether's consistent revenue growth and expansion into new chemistries make it a structural story rather than just a trading bet.
• A breakout if close above ₹757 could trigger a strong uptrend, with potential targets around ₹1,150 and even ₹1,400 in the longer term. The price would then be aligning with the company's growth potential, as the fundamentals begin to reflect in the stock price.
• The risk-reward here favors patient investors willing to sit through volatility, especially if the company continues to deliver on execution.
Like, comment your thoughts, and share this post
Explore more stock ideas on the right hand side your feedback means a lot to me!
Disclaimer: This post is for educational purposes only and should not be considered a buy/sell recommendation.

Chola Fin co., Looking good ; min 20% Roi ; swingFor short term investment ;
Leave a " Like If you agree ". 👍
.
Wait for small retracement & daily candle to close above - "1260".
Trade carefully untill ENTRY level.
.
Entry: 1260
Target: 1430-1560
sl: 1199
major stoploss/ support: 1190
.
.
Enter only if market Breaks
"Yellow box" mentioned.
.
.
Don't make complicated trade set-up.📈📉
Keep it " simple, focus on consistency "💹
Refer our old ideas for accuracy rate🧑💻
Follow for daily updates👍
.
Refer old posted idea attached below.

Continuous Accumulation With Consistent VolumesNSE:RENUKA has been Continuously Accumulated with Consistent Volumes in the past 4 Months with Positive Cues on Ethanol on the Domestic Front adding to Brazil's Wildfires on the Global Front. Today it Broke the Consolidation Range with Heavy Volumes.
A Close above 54 Levels will have more Upside, and 47 Will be a Crucial Level to Defend the Accumulation Zone is Crucial. Keep a Watch.
Check out my other stock ideas below until this trade gets activated, I would love your feedback.
Disclaimer: This analysis is intended solely for informational and educational purposes and should not be interpreted as financial advice. It is advisable to consult a qualified financial advisor or conduct thorough research before making investment decisions.

BankNifty - Inventory Analysis with Market Profile - 16 Aug 2024Hi hope you all are doing good, and in today's video i want to share where the positions are being accumulated in BankNifty and why i am long biased.
Area where price stability is seen = 49969
Stops seen = 49817
Area where sellers are competing = 51000
Area where buying interest or supply will shut off = 47500
Disclaimer: Please always do your own analysis or consult with your financial advisor before taking any kind of trades.
Dear traders, do not forget to hit like and follow me, and please do share your thoughts in below comment box, as your response will help me strengthen my market understanding.
Thank you.

HDFCBank - Inventory Analysis using Market Profile - 14 Aug 2024Hope you all are well and HDFCBank is showing signs of inventory accumulated around 1600. In this video i am sharing my process, how i use TradingView's inbuild TPO - Market Profile and Volume Profile indicators to understand the inventory development and how smart money is accumulating their positions in this stock.
1600 is the line in sand and there are less transactions happening below 1600 - Question you should ask is why?
Price is nicely chopping in a 1 month range of 30 points
Below 1600 is where i am looking for responsive buying
Target 1 is 1650, followed by 1700 and the gap fill above 1700, and looking to acquire positions till 1500 in this stock.
This is a long term stock where Market Profile is helping me to understand how positions are being created based on the transactions that are happening.
Disclaimer : Please always do your own analysis or consult with your financial advisor before taking any kind of trades.
Dear traders, do not forget to hit like and follow me, and please do share your thoughts in below comment box, as your response will help me strengthen my market understanding.
Thank you.

NATCOPHARM - FLAG AND POLE FORMATION IN PROGRESSHi All,
This idea is extension of existing idea on Natco Pharma which formed Cup and Handle
Interestingly the price action has formed a FLAG AND POLE formation with price action getting tighter & tighter with shrinking volume.
Flag Breakout may happen anytime soon & till then investor is advised to be patient.
Results are also expected & so market might be waiting for some earnings surprise
Thanks,
Stock-n-Shine

ETHEREUM BREAHOUT on WEEKLY timeframeETHEREUM breaking out of an ascending pattern here. will wait for this WEEK closing for confirmation

ICP NETWORK ICP NETWORK looks like a good accumulation zone here. On WEEKLY timeframe it has given a breakout and retesting. keep an eye on this

SOLAR INDUSTRIES 28/06/2023I analyze chart patterns, price-volume analysis, along with volume profile and avwap. Also check the momentum in daily and weekly charts. Finally make a risk-reward trade setup.

SEQUENT SCIENTIFIC 20/06/2023 Price Volume Analysis, AVWAP, Volume Profile. Chart pattern. Risk-reward scenarios.

LALPATHLAB ANALYSIS 17/06/2023I analyse Lalpathlab on weekly and daily chart. Price, Volume, AVWAP, Volume Profile, other technical indicators are used. Possible targets and risk/reward is also discussed.

Divergence: A Retrospective Divergence Trading is lucrative as the price movement following a divergence is with high momentum, hence rewarding with decent Risk:Reward.
The common way is to add conventional RSI and check for divergence . However we often found that many of the vanilla RSI divergence signals are conveniently ignored by the following price action.
Then the question is: Does RSI divergence fakes out? OR with the confluence of something other stuff we can more accurately identify these sorts of divergence and hop into it happily with lucrative Risk:Reward.
Potentially the Volume Profile (more specifically: The Fixed Range Volume Profile) identified high liquidity zones (classical term: Point of Control , PoC ) are the area where one should look out for a potential RSI divergence.
We have picked up the FX_IDC:USDINR last 5 months Daily chart and followed this analysis tecnique:
Analysis Methodology:
Use Daily (or something like hourly/4-hour etc.) normal candlestick.
Identify the swings in the chart (high, lows).
For each swing, apply Fixed Range Volume Profile free TradingView indicator (available under Technicals > Profile, 2nd from top)
The PoC (Point of control) is visible in the chart. You may mark it in the chart with a horizontal line (or a rectangle). That's the liquid-most zone .
If you see some other areas other than PoC area (technically called Value Area ) are showing decent liquidity (comparable to PoC, say within 60% of PoC), then mark that area also with a horizontal line.
Add a RSI. Cleanout everything other than just the RSI line chart.
Change the main price chart from normal candle to line chart.
Once you see the price is in the high liquidity zone, check the price and the RSI together. See if there is a divergence.
Positive/Bullish Divergence : Price is making a lower-low, but corresponding RSI levels are not making lower-low (either same or making higher low).
Negative/Bearis Divergence : Price is making higher-high, but corresponding RSI levels are not making higher-high (either same or making lower high).
Hidden Divergence : No need to consider too much. Spotting a normal RSI divergence is good enough.
That's it. Once you find out the divergence, take a Positional Trade in the opposite direction of trend. (means +ve divergence Long / -ve divergence Short). Hold it with the SL of the Highest Point of the high liquidity zone (which you have marked earlier) and ride the reversal movement with trailing the stop loss.
In last 5 months USDINR, we can see it happened at least thrice. So it's powerful. Lesser number of quality trades.

Banknifty POC Levels and Trading Range Update 28.06.2022Important POC level Updates for NSE:BANKNIFTY .
Expecting a trending Rally or Drop before expiry. If happens so target levels are given in the chart.
High Volume Node levels have been plotted.
Keep Patience and trade with reversal or Breakout strategy near POC level.
Try to understand psychology of market.
If you like the idea, do not forget to support with a like and follow.
Above is purely my opinion. It doesn't mean that you need to trade accordingly. Please note that I'm not Sebi registered advisor or technical analyst. Trade on your own conviction and please consult your advisor before investing.
#supportandresistance #volumeprofileanalysis #stockmarketindia #banknifty

