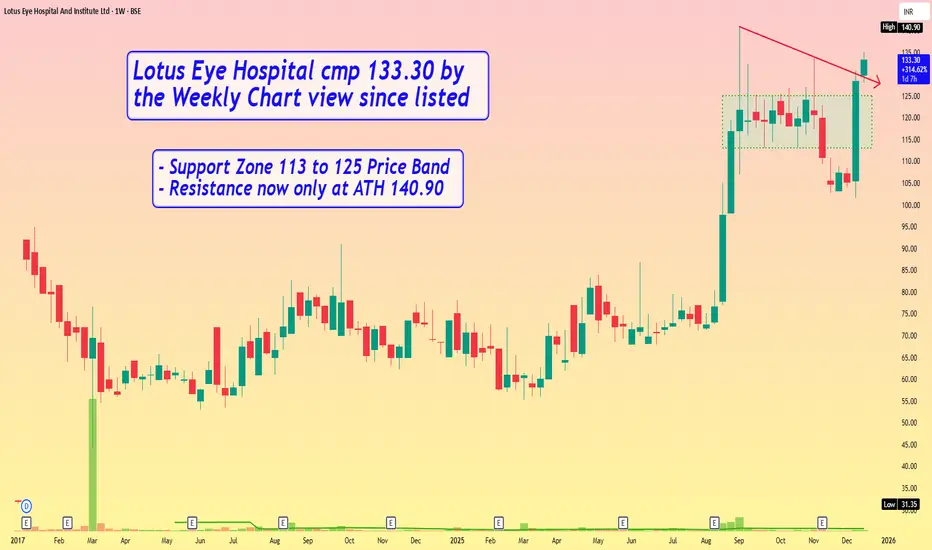
Lotus Eye Hospital cmp 133.30 by Weekly Chart view since listedLotus Eye Hospital cmp 133.30 by Weekly Chart view since listed
- Support Zone 113 to 125 Price Band
- Resistance now only at ATH 140.90
Volumes
Belrise Inds cmp 157.70 by Daily Chart view since listedBelrise Inds cmp 157.70 by Daily Chart view since listed
- Support Zone 150 to 157 Price Band
- Resistance Zone 166.50 to ATH 172.68 Price Band
- Price traversing within Rising Price Channel since listed
- Volumes need to increase for sustained upside movement
- Support Zone been tested retested since mid of November 2025
- Bullish Rounding Bottoms retracing at Resistance Zone inclusive of ATH 172.68

Gravita Triangle Breakout 1DGravita is attempting to breakout after forming a triangle pattern on 1D timeframe with high volumes. The stock is also trading above 200ema. Enter after bullish confirmation.

Bitcoin harmonic 73-81k bitcoin
Volume support+ harmonic shark pattern+ harmonic crab pattern complete at 81k/80k

BREAKOUT TRADE IN GMRGMR has given breakout above 103 levels. Use stop of 100 on closing basis and look for 115 to 118 in short term.
volumes are backing GMR bullish momentum

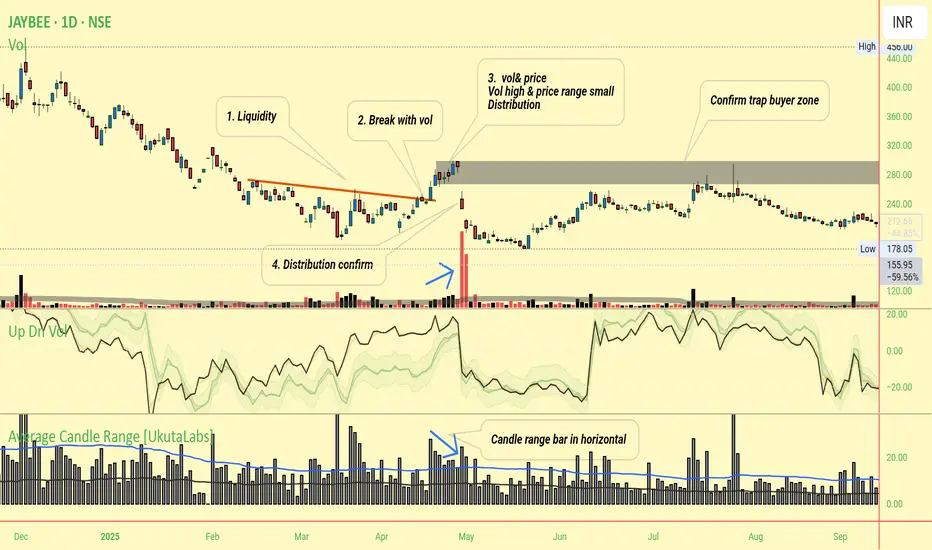
Breakout liquidity accumulation distribution Breakout use as liquidity, offload position using liquidity.
Stock create strong base, given break out with more then avg volume,
After price rise , but With small candle range ( that means buyer+ sellers heavy involved here)
Price range decrease while volume rise show distribution ( offloading someone)
After 4th point big negetive candle if we enter at Breakout must be exited all positions
Because now 3rd point vol rise & small candle now working strong resistance mostly people trap.
Small candle & rise volume distribution confirm only when big candle move down with high volume or low but have big body
( Because big body show dominate sign )
Just make this fast so don't add more details cover in depth
Institute pump and dump Explain I have analysis this pattern by myself and i like to share with you .
Institute sell there stocks to retail and exit there position.
This thing happens in 3 stage .
Below share in detail-
# 1st Leg – Big Institutional Buying
Price breaks out sharply above previous resistance zone.
Huge volume spike clear sign of institutional buying.
Candle structure long bullish candles, often with wide range.
Psychology:
Institutions step in aggressively — they don’t hide accumulation here.
Breakout attracts early smart participants or some retail momentum traders.
#Stage 2: Partial Profit Booking + Retail Entry
After the first upmove, institutions book a small portion of profits.
This causes a minor correction or sideways movement — which you’ve marked as “small correction.”
Then, volume pops up again — but this time driven by retail traders who see the price breakout or recent rally and jump in late.
Institutions use this liquidity from retail buying to offload more of their holdings (distribution phase).
Hence the second leg’s rise is often less strong internally — despite visible volume.
#Stage 3: Retail Trap & Sharp Decline
Once institutions have sold enough to retail, they stop supporting the price.
This results in a sharp fall — large red candles, pointed out.( Here we know fake buying by institute and this is just trap)
Retail traders, who entered during the 2nd leg thinking it’s another rally, now get trapped.
Volume still appears high, but now it’s mostly panic selling or stop-loss triggers.
This confirms institutional distribution is complete and the next cycle may start again from lower levels.
This post may help you understand fake institute buying, but we identify this in 3rd stage .
I have purchased This stock at 2nd leg and trapped exit at 3rd stage.
All ready post available in my profile post tradingview

BEL I think here it create small strong base ,with good accumulation volume
Comapare to nifty 50 index stock more strong ,
Here risk 6% if price 1day close below 392 exit .
Target 20% after 50% book half trailing with ema

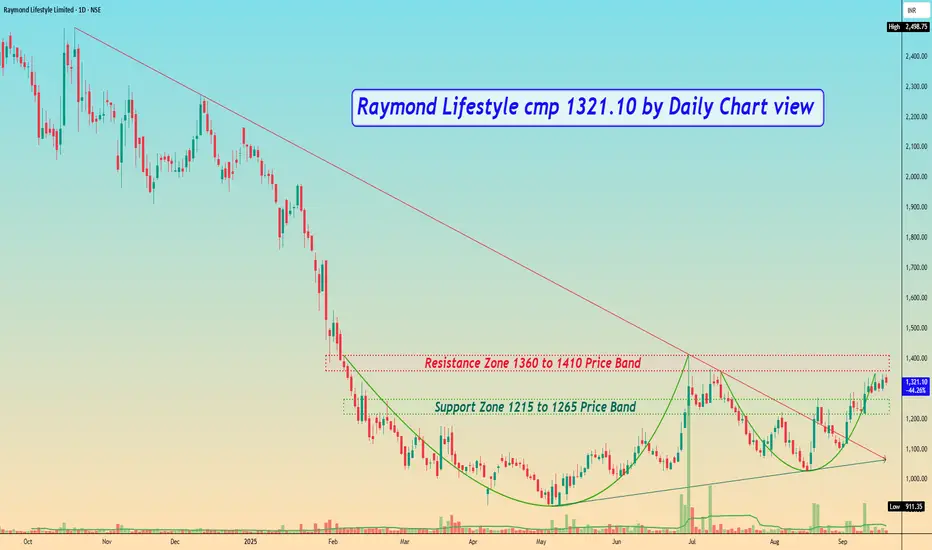
Raymond Lifestyle cmp 1321.10 by Daily Chart viewRaymond Lifestyle cmp 1321.10 by Daily Chart view
- Support Zone 1215 to 1265 Price Band
- Resistance Zone 1360 to 1410 Price Band
- Bullish Rounding Bottoms by Resistance Zone neckline
- Resistance Zone tested rested prior to Breakout attempt
- Breakout sustained above the Falling Resistance Trendline
- Volumes seem subdued, need to increase for good Breakout
- Chart showing indicative positive setup for BB, EMA, MACD, RSI
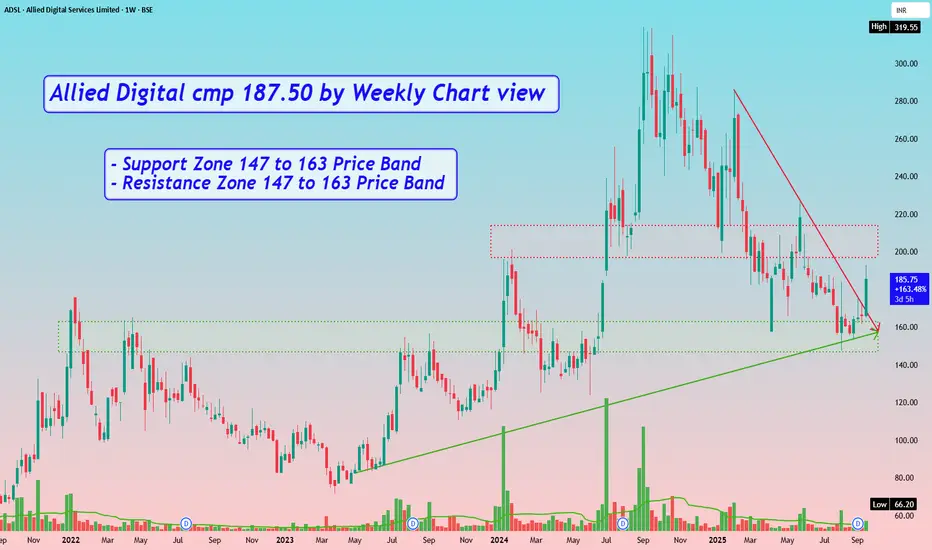
Allied Digital cmp 187.50 by Weekly Chart viewAllied Digital cmp 187.50 by Weekly Chart view
- Support Zone 147 to 163 Price Band
- Resistance Zone 147 to 163 Price Band
- Support Zone was tested retested over past few days
- Volumes are improving by demand based buying on the counter
HeranbaSwing Trade -
Look interesting at current level - still closing pending
If today close above break out level
Maybe we can see Good move upside.
Risk around 8-10% around
Target next resistance

JP Power - Are bad times over for this penny stock?Stock can fly if it gives a monthly closure above 25
Sharing only for educational purposes. Keep in watchlist to see who it unfolds.
Penny stocks should be strictly avoided for investment purposes.
Highly risky.

#WINDMACHIN – Swing Trade Setup Alert📊 #WINDMACHIN – Swing Trade Setup Alert
🔸 VCP setup spotted on the Daily Time Frame (DTF)
🔸 Volume spike observed
🔸 Price consolidating near Resistance (RT)
📌 If a breakout (BO) occurs with strong volume, it could present a solid swing trade opportunity.

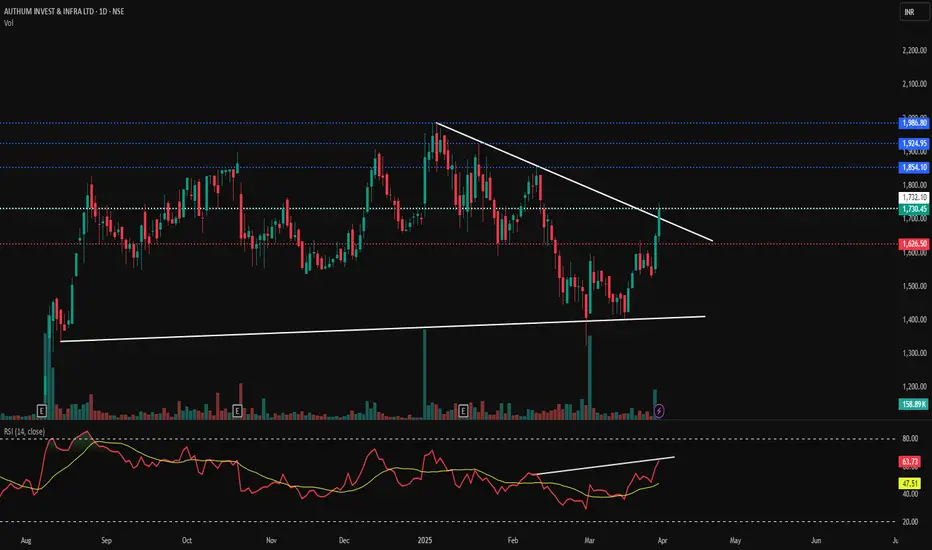
Authum Investment & Infrastructure Ltd**AIIL:**
A one-day breakout has occurred, accompanied by a significant spike in volume. You can consider adding to your position at the current level of 1732 until the retest is complete. Start by adding 50% now, and if the price falls to 1680, add another 15%.
The support level is at 1626.50 based on the daily close, while the resistance levels are at 1854.10, 1924.95, and 1986.80.
#AVANTIFEED - Multi Year Breakout Candidate📊 Script: AVANTIFEED
Key highlights: 💡⚡
📈Multi Year Breakout
📈 VCP in Weekly Time Frame
📈 BO with Volume in Daily Time Frame
📈 MACD gave a Bounce
📈 Price consolidated for 6 Years
📈 One can go for Swing Trade
⚠️ Over All Market condition is bad, Practice paper trading
🟢 If you have any questions regarding the setup, please feel free to leave your inquiries in the comments, and I will respond promptly.
BUY ONLY ABOVE 800 DCB
⏱️ C.M.P 📑💰- 786
🟢 Target 🎯🏆 – 30%
⚠️ Stoploss ☠️🚫 – 15%
⚠️ Important: Always Exit the trade before any Event.
⚠️ Important: Always maintain your Risk & Reward Ratio.
✅#Boost, #Like & #Follow to never miss a new idea! ✅
Disclaimer: I am not SEBI Registered Advisor. My posts are purely for training and educational purposes.
Eat🍜 Sleep😴 TradingView📈 Repeat 🔁
Happy learning with MMT. Cheers!🥂

Volume breakout vs Cluster of Volumes concept for your edgeI make educational content videos for swing / positional trading

Wind Machin technically good. Add to your WLWatch #windmachin:
It looks good Technically.
- Resisting the broader market sell-off.
-Moving up backed by volume.
-Trading well above all key DMAs.
-Low Debt company.
❗️Poor ROE, ROCE.
❗️Poor Sales
❗️Weak Market sentiments.
Watch for a trendline breakout or a retest of the previous breakout base. It's a little bit stretched as of now.
Add to your WL and find your opportunity.

A STRONG BREAKOUT STOCK - INOX WINDNSE:INOXWIND
❇️ Strong breakout on weekly chart.
❇️ Flag and poll pattern in 30mint time frame.
❇️ Stock can achive 250-270 targets in upcoming days.
❇️ Short and log terms targets 300+.
❇️ Nearby support 215-220.
❇️ Above 236 we can see a real move🔥
👉🏻 thetradeforecast 🇮🇳

UTIAMC-DO NOT MISSLogic-Simple weekly resistance breakout, retest and continuation.
Weekly closing above 910 will be a confirmation. 1000 will be immediate resistance.
A good investment stock for long term as well available at a fair valuation with more than 2% dividend yield. I am expecting similar rally as HDFC AMC in this stock but move would be slow.
Not a recommendation, just my personal opinion!

A BREAKOUT WITH VOLUME - ARIHANT CAPITAL.NSE:ARIHANTCAP
❇️ Strong breakout on weekly chart.
❇️ Flag and poll pattern in 30mint time frame.
❇️ Stock can achive 108-115 targets in upcoming days.
❇️ Short and log terms targets 140-160-190++.
❇️ Nearby support 88-90.
❇️ Above 95 we can see a real move🔥
👉🏻 @thetradeforecast 🇮🇳

QUESS Triangle Breakout 1WQuess Corp is trying to breakout from Symmetrical Triangle pattern on 1W timeframe. Volumes are currently high. Enter after bullish closing confirmation. Please follow your stop loss and target rules. It has also shown more than 100% yoy EPS growth for past 2 quarters and is currently trading at P/E of 35.

VENKEYS Triangle BreakoutVenkeys has given a breakout from triangle pattern on 1D timeframe with strong volumes. It has broken its 2 year old resistance. It is apparently retesting its resistance.

Bajel Project, its reaction from 50 emaWhenever market weakness take it to 50 ema, it bounce back strongly : showing big players buying at so called "dip"
And now after budget day shakeout it gapped up showing urgency and accumulating near old BO level.
Check vols: Green > Red
