SHARDACROP: Strong Q3, Descending Trainlge BO, Chart of the WeekFrom Descending Triangle Breakout to Q3FY26 Glory: Why Sharda Cropchem's Could Be Your Next Big Move Lets Understand in "Chart of the Week"
As per the Latest SEBI Mandate, this isn't a Trading/Investment RECOMMENDATION nor for Educational Purposes; it is just for Informational purposes only. The chart data used is 3 Months old, as Showing Live Chart Data is not allowed according to the New SEBI Mandate.
Disclaimer: "I am not a SEBI REGISTERED RESEARCH ANALYST AND INVESTMENT ADVISER."
This analysis is intended solely for informational purposes and should not be interpreted as financial advice. It is advisable to consult a qualified financial advisor or conduct thorough research before making investment decisions.
Price Action Analysis:
Long-Term Trend Overview:
- The stock has demonstrated a multi-year uptrend from 2021 levels around 300-350 to current levels near 1,035
- A significant rally occurred from mid-2021 to early 2025, where the stock surged from approximately 350 to an all-time high of 1,181
- Post the January 2025 peak, the stock has entered a consolidation phase with a descending triangle pattern formation
- Current price of 1,035.85 (as of January 31, 2026) represents a 28.46% gain, showing strong momentum recovery
Recent Price Action Characteristics:
- The stock made an all-time high of 1,181 in early January 2025
- Following the peak, a corrective phase ensued with the formation of lower highs
- A clear descending trendline can be observed connecting the highs from January 2025 peak through subsequent rallies
- The stock found support multiple times around the 750-800 zone, establishing this as a critical demand area
- On January 31, 2026, the stock broke above the descending trendline with a strong bullish candle supported by robust volumes (11.25M shares traded)
Key Technical Patterns:
- Descending Triangle Pattern: The chart clearly shows a descending triangle structure with lower highs and a flat support base around 750-800
- Trendline Break: The recent price action has broken through the descending resistance trendline, which is a classic bullish reversal signal
- The breakout was accompanied by good volumes of 2.03M (shown in green), indicating strong buying interest
- The price action suggests a potential trend reversal from the consolidation phase to a new uptrend
Volume Spread Analysis:
Volume Trends and Characteristics:
- The volume chart shows sporadic high-volume days during the entire period
- The recent breakout candle is accompanied by elevated volumes of 11.25M shares
- Volume of 11M is above average, confirming the validity of the breakout
- Historical volume spikes are observed during significant price movements, both up and down
Volume-Price Correlation:
- During the 2021-2022 rally, several high-volume green bars supported the upward price movement
- The consolidation phase from January 2025 to January 2026 saw relatively lower volumes, typical of a basing pattern
- The recent breakout is validated by the volume surge, a positive technical sign
- Absence of high red volume (selling pressure) during the breakout indicates limited supply
Volume Implications:
- The volume profile suggests strong institutional participation during key price movements
- The current breakout with good volume indicates conviction among buyers
- Sustained volumes above the 2-3M range would confirm continued buying interest
- Any pullback on lower volumes would be healthier and offer better entry opportunities
Support and Resistance Analysis:
Major Support Levels:
- Primary Support Zone: 750-800 (tested multiple times during the consolidation phase, proving to be a strong demand zone)
- Secondary Support: 700 (psychological level and previous consolidation area)
- Critical Support: 600-650 (major swing low from mid-2024, breaking this would invalidate the bullish structure)
- Long-term Support: 500 (aligns with historical resistance turned support from early 2024)
Major Resistance Levels:
- Immediate Resistance: 1,100 (previous consolidation high and psychological barrier)
- All-Time High Resistance: 1,181 (needs to be reclaimed for continuation of uptrend)
- Potential Resistance: 1,200-1,250 (psychological round numbers)
- The broken descending trendline around 900-950 zone may now act as support on any pullbacks
Base Formation Analysis:
- The stock has formed a strong multi-week base between 750 and 800
- This base structure resembles a consolidation platform after a strong uptrend
- The base formation duration provides strong foundation for the next leg up
- The base is indicating accumulation rather than distribution
Technical Pattern Analysis:
Descending Triangle Breakdown and Resolution:
- Pattern Formation: The descending triangle started forming from the January 2025 high at 1,181
- Pattern Characteristics: Lower highs (descending resistance) meeting horizontal support at 750-800
- Pattern Resolution: The recent upward breakout from the descending trendline on January 31, 2026
- Breakout Confirmation: Strong bullish candle with +28.46% gain and volume of 11.25M shares
Short-Term Trend Assessment:
- The recent breakout candle establishes a strong bullish bias in the short term
- The stock has moved from a downtrend (within the triangle) to potentially starting a new uptrend
- Higher high formation above 1,035 would confirm the trend reversal
- The immediate trend is bullish with the breakout above both the trendline and the 900-950 resistance cluster
Medium-Term Outlook:
- The stock needs to sustain above 950-1,000 levels to confirm medium-term bullish structure
- A move above the previous high of 1,181 would resume the primary uptrend
Long-Term Perspective:
- The overall structure from 2021 remains bullish with higher lows and higher highs
- The current consolidation is a healthy correction within a larger uptrend
- Long-term investors can view the 750-800 zone as a strong accumulation area
- The secular trend in the agrochemical sector supports the long-term bullish thesis
Fundamental and Business Overview:
Company Profile and Business Model:
- Sharda Cropchem Ltd is engaged in the marketing and distribution of agrochemicals globally
- The company operates an asset-light business model, focusing on identifying generic molecules, preparing dossiers, seeking registrations, and marketing through distributors
- Core product portfolio includes formulations and generic active ingredients across fungicide, herbicide, and insecticide segments
- The company also operates a non-agrochemicals business including conveyor belts, V-belts, dyes, and industrial chemicals
Geographic Revenue Distribution:
- Europe: Contributes approximately 53% of agrochemical revenue, making it the largest market
- NAFTA (North America): Accounts for around 34% of agrochemical business
- Latin America (LatAm): Represents about 9-10% with high growth potential
- Rest of World: Includes India and other emerging markets
- The company has a presence across 80+ countries with over 150 distributors in India alone
Registration Portfolio and Competitive Moat:
- The company has 2,821 active product registrations globally as of March 2023
- Strong pipeline of 1,143 registrations under process, mainly in EU, US, and LatAm
- The registration process serves as a significant entry barrier due to high costs, complexity, and time requirements
- The company invests approximately 350-400 crores per annum toward new product registrations
- Registrations in highly regulated markets (EU, US) provide sustainable competitive advantages
Recent Financial Performance:
Q3 FY26 Results Highlights (Quarter Ended December 2025)
- Net Sales: Rs 1,288.76 crores, representing 38.7% YoY growth
- Net Profit: Rs 145.12 crores, a stellar 365.87% YoY surge from Rs 31.15 crores in Q3 FY25
- PAT Margin: Expanded dramatically to 11.26% from 3.35% in Q3 FY25, a gain of 791 basis points
- Gross Profit Margin: Stood at 20.32%, significantly improved from 12.36% in Q3 FY25
- The margin expansion reflects improved product mix, better pricing realization, and effective cost management
Nine-Month FY26 Performance (April-December 2025):
- Consolidated Net Sales: Rs 3,202.68 crores, up 27.57% YoY
- Net Profit: Rs 362.21 crores, representing 257.33% YoY growth
- ROCE: Impressive 20.85% for the nine-month period, the highest recorded in recent periods
- The company declared an interim dividend of Rs 6 per share
- Strong cash generation and zero-debt balance sheet underscore financial strength
Financial Trend and Quality Metrics:
- Five-year Sales CAGR: 17.65%, demonstrating consistent top-line growth
- Five-year EBIT CAGR: 21.17%, showing strong operational leverage
- Debt Status: Company is almost debt-free, providing financial flexibility
- EBIT to Interest Coverage: Average of 100 times, indicating negligible debt burden
- Return on Equity: Currently at 9.89% over last 3 years (considered low, but improving)
Sectoral and Industry Backdrop:
Indian Agrochemical Market Overview
- Market Size: The Indian agrochemical market is valued at approximately USD 8-9 billion in 2025
- Growth Trajectory: Expected to grow at a CAGR of 5.5-7.5% during 2026-2032 period
- Market Drivers: Rising population, increasing food demand, agricultural intensification, and government support
- India is ranked as one of the top 10 consumers and producers of agrochemicals globally
Market Dynamics and Growth Drivers:
- Food Security Imperative: India's population projected to reach 1.5 billion by 2030, necessitating enhanced agricultural productivity
- Crop Loss Prevention: Annual crop losses due to pests, weeds, and diseases estimated at 15-25%, valued at USD 10-15 billion
- Land Constraints: Declining arable land per capita due to urbanization drives need for yield optimization
- Technology Adoption: Increasing adoption of precision farming, drone spraying, and fertigation systems
- Export Opportunity: India's status as a net exporter strengthened by global demand for generic agrochemicals
Government Initiatives and Policy Support
- Make in India: Government recognizes agrochemical industry as one of top 12 industries for global leadership
- Subsidy Programs: Continued support through fertilizer subsidies (INR 3.68 lakh crore committed till March 2025)
- PM-PRANAM Scheme: Launched in 2023 to incentivize balanced fertilizer use and alternative technologies
- Drone Subsidies: Up to 40% subsidy on drone purchases for precision spraying
- Digital Infrastructure: Integration of land records, soil health cards, and farmer databases to facilitate input access
Segment-wise Market Trends
- Fertilizers: Hold 55% market share, driven by high applicability across all cropping systems
- Pesticides: Growing at faster CAGR of 10.52% through 2030, with focus on herbicides and fungicides
- Insecticides: Dominate with 72.5% of pesticide market due to tropical climate and pest pressure
- Biopesticides: Emerging segment accounting for 15% of market, driven by sustainability focus
- Regional Dynamics: South India projected to show highest growth due to horticulture and high-value crop expansion
Industry Challenges and Headwinds:
- Chinese Dependence: High reliance on Chinese suppliers for raw materials and active ingredients
- Import Dependency: Trade deficit of around USD 31 billion in chemicals sector due to infrastructure bottlenecks
- Pricing Pressure: Competition from low-priced Chinese products putting pressure on realizations
- Regulatory Complexity: Increasing cost of registrations and re-registrations in developed markets
- Working Capital Intensity: Large inventory and receivables requirements due to wide product portfolio and geography
Competitive Positioning and Business Strengths:
Sharda's Competitive Advantages:
- Asset-Light Model: Focus on registration, marketing, and distribution rather than manufacturing
- Registration Moat: 2,821 active registrations create significant barriers to entry
- Global Footprint: Presence in 80+ countries with diversified revenue streams
- Developed Market Focus: 83-85% revenue from Europe and NAFTA, which are high-value, stable markets
- Debt-Free Balance Sheet: Provides financial flexibility for growth investments
Business Model Strengths:
- Third-Party Manufacturing: Partnerships with manufacturers allow capital-efficient scaling
- Diversified Portfolio: Over 200 products across multiple crop protection categories
- Strong Pipeline: 1,143 registrations in process ensure future revenue visibility
- Direct Sales Force: Building own sales teams in key markets (Europe, US, Canada, Mexico) in addition to distributors
- Non-Agro Diversification: 17% revenue from non-agrochemical business reduces concentration risk
Strategic Positioning in Generic Agrochemicals:
- Generic Focus: Targets off-patent molecules where 75% market share is still held by innovators
- Value Proposition: Offers cost-competitive alternatives to multinational brands
- Regulatory Expertise: Proven capability in navigating complex registration processes in developed markets
- Customer Relationships: Supplies to MNCs as well as end customers, providing multiple revenue channels
- Quality Compliance: Meets stringent regulatory standards of EU and US markets
Valuation Metrics:
- P/E Ratio: Trading at 20x trailing earnings, below industry average of 29x
- EV/EBITDA: 10.61x appears reasonable given the 365.87% profit growth trajectory
- PEG Ratio: 0.18 suggests the stock is significantly undervalued relative to its growth
- Dividend Yield: 0.91% with conservative payout ratio of 84.89% for FY25
Key Strengths:
- Strong quarterly momentum with 365.87% YoY profit growth in Q3 FY26
- Expanding margins (PAT margin up 791 bps YoY) indicating operational improvement
- Record ROCE of 20.85% demonstrating efficient capital deployment
- Zero-debt balance sheet providing safety and growth flexibility
- Technical breakout from year-long consolidation backed by strong volumes
Risk Factors and Concerns:
- Dependence on Chinese Suppliers: Raw material sourcing concentrated in China exposes to currency and policy risks
- Competitive Pricing: Generic nature of business faces pricing pressure from both innovators and other generic players
- Working Capital Intensity: High debtors of 165 days and large inventory requirements
- Regulatory Risks: Stroke of pen risk where simplified registration processes could erode competitive moat
- MNC Competition: Large multinationals with better brand equity and distributor relationships
- Seasonality: 35-40% revenue and 50-55% profit concentrated in certain quarters
Management Guidance and Outlook:
- FY26 Guidance: Company targets 15%+ topline growth with EBITDA margins in 15-18% range
- Capex Plans: Rs 400-450 crore planned investment in registrations for FY26
- Registration Pipeline: Focus on strengthening portfolio across Europe, NAFTA, and LatAm
- Margin Trajectory: Gross margins expected to stabilize around 30-35% range with input cost normalization
- Geographic Expansion: Continued strengthening of sales force in key markets
Sectoral Tailwinds Supporting Growth:
- Indian agrochemical market growing at 5.5-7.5% CAGR through 2032
- Global demand for generic agrochemicals increasing as patents expire
- Government support through Make in India and agricultural modernization programs
- Increasing adoption of precision farming and technology-driven agriculture
- Export opportunities expanding as India becomes a preferred sourcing destination
Monitoring Parameters:
- Volume Consistency: Weekly volumes should sustain above 1.5-2M for continued momentum
- Support Holding: 750-800 zone must hold on any pullbacks
- Quarterly Results: Track margin trends and volume growth in subsequent quarters
- Sectoral Trends: Monitor agrochemical industry news, Chinese raw material prices, and global demand
- Competitive Action: Watch for pricing pressures or market share changes
My 2 Cents:
- Sharda Cropchem has broken out of a descending triangle pattern with strong volumes
- The 750-800 support zone has proven to be a robust demand area tested multiple times
- Volume-backed breakout on January 31, 2026 (+28.46%) confirms buying conviction
- The stock is transitioning from consolidation to a potential new uptrend
- The stock presents a compelling combination of technical breakout and fundamental improvement
- Strong quarterly numbers have acted as a catalyst for the technical pattern resolution
- Valuation at 20x P/E with PEG of 0.18 suggests room for re-rating
- The 750-800 base provides a strong foundation for the next leg of upward movement
Full Coverage on my Mid-Week Newsletter coming Wednesday.
Keep in the Watchlist and DOYR.
NO RECO. For Buy/Sell.
📌Thank you for exploring my idea! I hope you found it valuable.
🙏FOLLOW for more
👍BOOST if you found it useful.
✍️COMMENT below with your views.
Meanwhile, check out my other stock ideas on the right side until this trade is activated. I would love your feedback.
As per the Latest SEBI Mandate, this isn't a Trading/Investment RECOMMENDATION nor for Educational Purposes; it is just for Informational purposes only. The chart data used is 3 Months old, as Showing Live Chart Data is not allowed according to the New SEBI Mandate.
Disclaimer: "I am not a SEBI REGISTERED RESEARCH ANALYST AND INVESTMENT ADVISER."
This analysis is intended solely for informational purposes and should not be interpreted as financial advice. It is advisable to consult a qualified financial advisor or conduct thorough research before making investment decisions.
Volumespreadanalysis

UJJIVANSFB: Testing IPO High with Triple Top, Chart of the MonthFrom IPO Highs to Recovery: Is Ujjivan Small Finance Bank Finally Breaking Out After Six Years? After Posting Robust Q3 FY26 Numbers with asset quality improving and Micro Finance Cycle Turning Back. Let's Analyze in "Chart of the Month"
As per the Latest SEBI Mandate, this isn't a Trading/Investment RECOMMENDATION nor for Educational Purposes; it is just for Informational purposes only. The chart data used is 3 Months old, as Showing Live Chart Data is not allowed according to the New SEBI Mandate.
Disclaimer: "I am not a SEBI REGISTERED RESEARCH ANALYST AND INVESTMENT ADVISER."
This analysis is intended solely for informational purposes and should not be interpreted as financial advice. It is advisable to consult a qualified financial advisor or conduct thorough research before making investment decisions.
Price Action:
- Current Price: ₹63.06
- 52-Week High: ₹68.00
- 52-Week Low: ₹13.90
- Distance from All-Time High: Approaching IPO highs after prolonged consolidation
Volume Spread Analysis:
Volume Characteristics:
- Base Period (2020-2023): Subdued volumes indicating consolidation
- Breakout Period (2024-present): Notable volume expansion
- Recent spike visible in January 2026 showing institutional participation
- Current volume: 442.36M (significantly above 20-day average of 271.01M)
- Volume surge of 63% suggests strong conviction in the breakout
Volume-Price Relationship:
- Price advance accompanied by rising volume - bullish confirmation
- No negative divergences observed
- Accumulation visible during base formation with sporadic volume spikes
Base Formation & Major Patterns:
Rounding Bottom Pattern (2020-2025):
- The stock has carved out a massive rounding bottom base spanning approximately 5 years
- The blue curved trendline marks the U-shaped recovery trajectory
- Base Formation Period: Mid-2020 to Late-2024
- Base Depth: From ₹65-68 levels down to ₹13.90 (approximately 80% decline)
- This extended consolidation suggests thorough distribution at lower levels and strong accumulation
Cup and Handle Formation:
- A textbook cup & Handle pattern is visible in the 2019-2025 period
- Left rim formed in early 2024 at ₹65
- Cup bottom at ₹30-35 range (2024-2025)
- Right rim currently forming at ₹63-68 levels
- Handle consolidation occurred during late 2025
Support & Resistance Levels:
Major Resistance Zones:
- R1 (Immediate): ₹65.00-68.00 (IPO highs)
- This level may act triple top resistance (2020, 2024, 2026)
- Critical breakout zone - sustained move above this unlocks higher targets
- R2 (Psychological): ₹70.00
- R3 (Extension Target): ₹85-90 (measured move from base)
Major Support Levels:
- S1 (Immediate): ₹55.00-58.00 (recent breakout zone)
- S2 (Strong): ₹45.00-48.00 (rounding bottom neckline)
- S3 (Critical): ₹30.00-35.00 (2024-2025 lows, base support)
Trend Analysis:
Long-Term Trend:
- The stock was in a prolonged downtrend from 2020 to 2022
- Transitioned into consolidation/basing phase from 2022 to 2024
- Currently attempting to reverse into an uptrend as of late 2025/early 2026
Medium-Term Trend:
- Strong uptrend established from November 2024 onwards
- Higher highs and higher lows pattern intact
- Moving along the upper channel of the rounding bottom
Short-Term Momentum:
- Explosive momentum in January 2026 (+19% move)
- Stock attempting to reclaim IPO highs for the second time
- Price action suggests breakout on cards from 6-year consolidation
Key Technical Observations:
Breakout Attempt #2
- This is the "2nd time to break IPO Highs"
- First attempt in early 2024 failed, leading to a correction
- Current attempt appears stronger with better fundamentals and volume support
- Risk of triple top failure exists if price fails at ₹65-68 zone again
Risks & Triple Top Persistence:
- The ₹65-68 zone has proven to be formidable resistance over 6 years
- Three distinct peaks at this level (2020, 2024, 2026) create triple top risk
- A decisive close above ₹68 with sustained volume would negate this pattern
- Failure here could lead to another correction toward ₹45-48 support
Fundamental & Sectoral Backdrop:
Recent Financial Performance (Q3 FY26):
Profitability Metrics:
- Net Profit: ₹186 crore (up 71% YoY from ₹109 crore)
- Sequential Growth: 53% QoQ from ₹121.72 crore in Q2 FY26
- Nine-Month Performance: ₹411 crore (down 36% YoY) - signals recovery from challenging period
- Net Interest Income: ₹1,000 crore (all-time high, up 12.8% YoY)
- Interest Earned: ₹1,752 crore (all-time high, up 16.12% YoY)
Balance Sheet Growth:
- Gross Loan Book: ₹37,057 crore (up 21.6% YoY)
- Total Deposits: ₹42,223 crore (up 22.4% YoY)
- Disbursements: ₹8,293 crore (highest ever quarterly disbursements)
- Credit-Deposit Ratio: 88% (healthy and stable)
- CASA Ratio: 27.3% (up from 25.1% YoY)
Asset Quality Improvement:
- Gross NPA: 2.45% (improved from 2.68% in December 2024)
- Current position better than historical average of 4.84%
- Portfolio at Risk (PAR): 3.98% (down from 4.44% QoQ and 5.36% YoY)
- Provisions: ₹195 crore (down from ₹235 crore in Q2, signaling improvement)
- Micro banking collection efficiency: 99.70% (December 2025)
Business Strategy & Positioning:
Portfolio Diversification:
- Shift from unsecured microfinance to secured lending
- Secured portfolio: ₹17,829 crore (up 48.8% YoY), now 48.1% of total book
- Growth in housing loans, MSME finance, gold loans, vehicle loans, and agri loans
- Microfinance exposure reducing as part of risk mitigation strategy
Target Market:
- Focus on financially underserved segments
- Mass market banking for economically active poor customers
- Operating since 2005 (as NBFC), became Small Finance Bank in 2017
- Strong presence in rural and semi-urban markets
Growth Drivers:
- Record quarterly disbursements driven by all-around performance
- Unsecured and secured products both contributing
- Digital transformation initiatives underway
- Branch network expansion supporting deposit mobilization
Key Concerns:
- Nine-month profit decline of 36% YoY raises sustainability questions
- Non-operating income constituted 121% of PBT in Q3 (concerning dependency)
- Stretched valuations with limited margin for error
- Success hinges on sustaining Q3 momentum
Small Finance Bank Sector Outlook:
Industry Growth Trajectory:
- SFB sector growing at 20-25% CAGR
- Total advances projected to exceed ₹2 trillion by FY26
- Deposits reached ₹3.15 lakh crore in FY25
- Expected to grow to ₹3.77 lakh crore in FY26
Regulatory Environment:
- RBI reduced priority sector lending norms from 75% to 60% in June 2025
- Provides greater flexibility for credit diversification
- Pathway to universal banking license for qualifying SFBs
- AU Small Finance Bank received approval for universal bank transition they can do it too
Sector Challenges:
- Asset quality stress in microfinance portfolios across sector is Improving
- GNPA in microfinance segment spiked to 6.8% in FY25 from 3.2% in FY24
- High operating costs (5.5% of assets vs 2% for broader banking sector)
- Net Interest Margins declining sector-wide (from 7.4% to 6.6%)
- Modest CASA ratios (26.2% average) leading to higher cost of funds
- Return on Assets dropped from 2.1% to 1.0% in FY25 across SFBs
Competitive Landscape:
- Competition from commercial banks, fintech lenders, NBFCs
- Pressure on margins due to intense competition
- Need for continuous digital transformation
- Branch-intensive operating model with mandated rural presence
Microfinance Industry Trends:
Market Size & Growth:
- Microfinance sector loan portfolio: ₹3.48 lakh crore (as of December 2024)
- Expected to reach ₹5 lakh crore by FY27
- Serving over 8 crore clients across India
- Sector contributes 2-3% to India's GVA
Recent Developments:
- 80% growth in loan disbursals in recent periods
- Digital transformation accelerating across industry
- Focus on financial literacy programs
- RBI regulatory changes providing operational flexibility
- Asset quality challenges persist with over-leveraging concerns
Risk Factors:
- Vulnerable to regional economic shocks
- Weather-dependent borrower segments
- Competition from traditional banks entering microfinance space
- Regulatory compliance requirements
- Portfolio concentration risks in certain geographies
Risk Assessment:
Technical Risks:
- Triple top pattern risk at ₹65-68 resistance zone
- Failure to decisively break IPO highs could trigger profit booking
- Potential pullback to ₹48-55 support if breakout fails
- Overextended short-term momentum
Fundamental Risks
- Sustainability of Q3 profit recovery remains unproven
- High reliance on non-operating income
- Microfinance asset quality pressures sector-wide
- Operating cost structure higher than traditional banks
- Modest CASA ratio impacting cost of funds
Sector Risks:
- Regulatory changes impacting business model
- Competition intensifying from multiple fronts
- Economic slowdown could impact borrower repayment capacity
- Regional concentration exposing to local risks
Bull Case Scenario:
- Successful breakout above ₹68
- Strong Q3 FY26 results indicate operational turnaround
- Asset quality improvement trajectory well-established
- Secured lending mix improving risk profile
- Potential universal banking license in future
- Sectoral tailwinds from financial inclusion drive
Bear Case Scenario:
- Failure at ₹65-68 resistance for third time
- Nine-month profit decline raises sustainability concerns
- Sector-wide margin compression continues
- Asset quality deterioration in microfinance segment
- High operating costs pressuring profitability
- Regulatory headwinds or policy changes
My 2 Cents:
NSE:UJJIVANSFB presents an interesting technical setup the stock is at a critical juncture - attempting to break out from a 6-year consolidation. Success above ₹68 could unlock significant upside, while failure creates triple top risk. The fundamental improvement supports the technical breakout attempt, but sustainability remains a key question mark given the nine-month profit decline.
Full Coverage on my Mid-Week Newsletter coming Wednesday.
Keep in the Watchlist and DOYR.
NO RECO. For Buy/Sell.
📌Thank you for exploring my idea! I hope you found it valuable.
🙏FOLLOW for more
👍BOOST if you found it useful.
✍️COMMENT below with your views.
Meanwhile, check out my other stock ideas on the right side until this trade is activated. I would love your feedback.
As per the Latest SEBI Mandate, this isn't a Trading/Investment RECOMMENDATION nor for Educational Purposes; it is just for Informational purposes only. The chart data used is 3 Months old, as Showing Live Chart Data is not allowed according to the New SEBI Mandate.
Disclaimer: "I am not a SEBI REGISTERED RESEARCH ANALYST AND INVESTMENT ADVISER."
This analysis is intended solely for informational purposes and should not be interpreted as financial advice. It is advisable to consult a qualified financial advisor or conduct thorough research before making investment decisions.

JTLIND: 3 year Downtrend Trendline Breakout, Chart of the WeekFrom ₹138 to ₹50: Why This Old Multi-Bagger Steel Stock Just Hit 20% Upper Circuit, Breaking 3-Year Downtrend and Getting a Big Order. Let's Understand in "Chart of The Week"
As per the Latest SEBI Mandate, this isn't a Trading/Investment RECOMMENDATION nor for Educational Purposes; it is just for Informational purposes only. The chart data used is 3 Months old, as Showing Live Chart Data is not allowed according to the New SEBI Mandate.
Disclaimer: "I am not a SEBI REGISTERED RESEARCH ANALYST AND INVESTMENT ADVISER."
This analysis is intended solely for informational purposes and should not be interpreted as financial advice. It is advisable to consult a qualified financial advisor or conduct thorough research before making investment decisions.
Price Action:
- Current Price: ₹72.29
- 52W High: ₹138.30
- 52W Low: ₹21.79
- The stock has recently broken above a critical downward trendline that had been in effect since mid-2024, showing strong reversal momentum with 15x average volume spike
Volume Spread Analysis:
Volume Characteristics:
- Average Volume: 1.42M shares
- Recent Spike: 21.33M shares (15x average)
- This represents exceptional institutional participation and strong momentum buying
- Historical volume spikes occurred during the 2021-2023 rally phase, suggesting similar strong hands accumulation
Volume Patterns:
- Volume dried up significantly during the downtrend, reaching multi-year lows near the ₹50 base
- This "spring" action with low volume at support followed by explosive volume on breakout is a classic Wyckoff accumulation pattern
- The volume bar chart shows distinct phases: high volume during 2023 rally, declining volume during correction, and massive spike on recent breakout
Volume-Price Correlation:
- The stock showed positive volume-price correlation during the breakout, confirming institutional buying
- Previous high-volume days in 2023 coincided with price rallies, suggesting volume leads price for this stock
- Current volume expansion suggests a potential multi-week rally ahead
Base Formation and Support Levels:
- Primary Base: ₹50-55 zone (marked with horizontal green dashed line)
- This base represents a critical accumulation zone where most institutional hands exchanged during the 2021-2022 period
- The stock tested this support multiple times between 2021-2022 before the explosive rally to ₹138
- Recent re-test of this base in late 2025/early 2026 at ₹50-52 suggests strong institutional buying interest
- Secondary Support: ₹21-22 zone represents the absolute low and panic bottom
Resistance Levels:
- Immediate Resistance: ₹80-85 zone
- Major Resistance: ₹95-100 (previous consolidation area in mid-2025)
- Critical Resistance: ₹110-115 zone
- Ultimate Resistance: ₹120-125 (prior to all-time high of ₹138.30)
Trendline Analysis:
- A clear downward trendline has been connecting lower highs since the peak at ₹138.30
- This trendline acted as resistance throughout 2024-2025, rejecting multiple bounce attempts
- Recent breakout above this trendline with massive volume confirms trend reversal
- The breakout occurred at approximately ₹60-62 level, suggesting the downtrend has been structurally broken
Breakout Confirmation:
- The recent 40% single-day rally with 20% upper circuit suggests strong momentum
- Breakout above the descending trendline with volume confirmation is a textbook bullish signal
- The stock reclaimed the ₹70 level, which previously acted as support-turned-resistance
Sectoral Backdrop:
Industry Overview:
- JTL Industries operates in the Steel Pipes & Tubes manufacturing sector, specifically focused on Electric Resistance Welded (ERW) pipes
- The company is positioned in the Basic Materials sector, under Steel & Iron Products subsector
- It serves critical end-use industries including Infrastructure, Oil & Gas, Power Transmission, Water Management, and Construction
Market Position:
- JTL is among the top 5 steel tube manufacturers in India and the largest ERW pipe manufacturer in North India
- Current manufacturing capacity: 9,36,000 MTPA (Metric Tons Per Annum) across 4 state-of-the-art facilities
- Geographic presence: Pan-India domestic market plus exports to 20+ countries across 5 continents
- Product portfolio: 1,200+ SKUs covering MS Black pipes, Galvanized pipes, Hollow sections, Solar mounting structures, Transmission towers, and specialty products
Sectoral Growth Drivers:
- Infrastructure Boom: India's infrastructure spending is accelerating with massive government projects including Bharatmala (34,800 km highways), PM-AWAS housing program, and Smart Cities 2.0
- Steel Demand Growth: India's steel demand is projected to grow at approximately 9% CAGR during 2025-2026, the highest globally according to World Steel Association
- Pipe Market Expansion: The Indian steel pipes market is expected to grow from USD 32.88 billion (2023) to USD 37.69 billion by 2030 at a CAGR of 6.43%
- Government Policy Support: Production Linked Incentive (PLI) scheme for specialty steel worth ₹27,106 crore and preferential procurement mandates support domestic manufacturers
- Power Sector Growth: Significant investments in power transmission infrastructure across India creating sustained demand for transmission towers and related products
Sector Challenges:
- Raw Material Volatility: Steel prices remain subject to global commodity cycles, coal costs, and iron ore price fluctuations
- Chinese Competition: China's steel oversupply and export surge create pricing pressure
- Environmental Regulations: EU's Carbon Border Adjustment Mechanism (CBAM) effective 2026 could add USD 80-397 per ton cost to exports
- Working Capital Intensity: Industry characterized by high working capital requirements (JTL's working capital days increased from 100 to 147 days)
Fundamental Backdrop:
Business Model:
- Integrated manufacturer of ERW steel pipes with backward integration capabilities
- Recent acquisition of 67% stake in Nabha Steels & Metals adds 2 lakh MT HRC (Hot Rolled Coil) capacity
- Diversified customer base across B2B, B2G, OEMs, and international markets reduces concentration risk
- Distribution network of 800+ dealers/distributors ensures strong market reach
Recent Corporate Actions:
- Major Order Win: Secured significant order from Punjab State Transmission Corporation Limited (PSTCL) for manufacturing 220kV transmission tower material and substation structures
- Execution Timeline: Order to be completed within FY 2025-26
- Strategic Significance: This order reinforces JTL's positioning in the power transmission infrastructure segment
- Stock Impact: The PSTCL order announcement triggered a 20% upper circuit rally, demonstrating market confidence
Financial Performance Snapshot:
- Q2 FY26 Revenue: ₹371 crores (down 22% YoY from ₹480 crores)
- Q2 FY26 EBITDA: ₹29 crores
- EBITDA Margin: Improved to 8% (from 6% YoY)
- EBITDA per ton: Increased 29% YoY to ₹4,247
- Market Capitalization: Approximately ₹2,360 crores
- Sales Mix: 88% domestic, 12% exports
Operational Efficiency Metrics:
- Despite revenue decline, operational efficiency has improved as evidenced by EBITDA margin expansion
- Higher EBITDA per ton suggests better realization and product mix optimization
- Working capital pressure visible with debtor days increasing from 40.1 to 52.8 days
Growth Catalysts:
- Capacity Expansion: With acquired Nabha Steels capacity, total capacity stands at 6 lakh MT for pipes + 2.5 lakh MT HRC + 1 lakh MT long products
- Product Diversification: Expansion into solar mounting structures, transmission towers, and specialty products reduces cyclicality
- Export Growth Potential: Recognition as "Star Export House" by Government of India supports international expansion
- Green Transition: Focus on sustainable practices and potential for green steel production aligns with global trends
Management & Governance:
- Promoter holding remains stable with recent inter-se transfers within promoter group
- ISO 9001:2015 certified operations demonstrating quality commitment
- Established in 1991, providing 30+ years of industry expertise
- Leadership under Pranav Singla (Executive Director) has articulated growth strategy and export targets
Competitive Landscape:
- Key competitors include APL Apollo Tubes, Rama Steel Tubes, Hi-Tech Pipes, Sambhv Steel
- Industry seeing consolidation with smaller players struggling with working capital and raw material costs
- JTL's integrated model and backward integration through Nabha Steels acquisition provides competitive advantage
Valuation Considerations:
- 5-Year Returns: Stock has delivered 312% returns over 5 years vs NIFTY 50's 79%
- Despite recent correction from ₹138 to ₹50, long-term value creation trajectory remains intact
- Current levels around ₹72 offer attractive entry for investors with 2-3 year horizon
- Recent order wins and capacity additions support earnings growth potential
Bull Case:
- Technical breakout from multi-month downtrend with exceptional volume confirmation
- Strong sectoral tailwinds from India's infrastructure boom and 9% steel demand growth
- Recent PSTCL order validates competitive positioning and execution capabilities
- Improved operational efficiency despite revenue headwinds
- Capacity expansion and backward integration strengthen margin profile
- Government policy support through PLI schemes and procurement preferences
Bear Case:
- Revenue declined 11% YoY in Q2 FY26, indicating near-term demand challenges
- Working capital pressure with increased debtor and working capital days
- Raw material cost volatility remains a persistent risk
- Global trade uncertainties and potential CBAM impact on exports
- Chinese steel oversupply creating pricing pressure
- Technical pattern needs confirmation with sustained trading above ₹65-70 zone
Key Monitorables:
- Quarterly revenue and EBITDA trend in coming quarters
- Execution and revenue recognition from PSTCL order
- Raw material cost trends and margin sustainability
- Order book build-up from infrastructure projects
- Working capital management improvements
- Technical price action: Holding above ₹65-70 support zone would confirm bullish reversal
My 2 Cents:
NSE:JTLIND presents an interesting technical setup following the breakout from a prolonged downtrend, supported by a major order win and improving operational metrics. The stock's 15x volume spike and 20% upper circuit rally suggest strong institutional interest resuming after extended consolidation at the ₹50-55 base.
From a sectoral perspective, the company is well-positioned to benefit from India's infrastructure boom, power transmission expansion, and robust steel demand growth. The recent PSTCL order validates its competitive capabilities in the high-value transmission infrastructure segment.
Full Coverage on my Mid-Week Newsletter coming Wednesday.
Keep in the Watchlist and DOYR.
NO RECO. For Buy/Sell.
📌Thank you for exploring my idea! I hope you found it valuable.
🙏FOLLOW for more
👍BOOST if you found it useful.
✍️COMMENT below with your views.
Meanwhile, check out my other stock ideas on the right side until this trade is activated. I would love your feedback.
As per the Latest SEBI Mandate, this isn't a Trading/Investment RECOMMENDATION nor for Educational Purposes; it is just for Informational purposes only. The chart data used is 3 Months old, as Showing Live Chart Data is not allowed according to the New SEBI Mandate.
Disclaimer: "I am not a SEBI REGISTERED RESEARCH ANALYST AND INVESTMENT ADVISER."
This analysis is intended solely for informational purposes and should not be interpreted as financial advice. It is advisable to consult a qualified financial advisor or conduct thorough research before making investment decisions.

MTARTECH: Trendline BO with Fresh Momentun, Chart of the WeekNSE:MTARTECH Trendline Breakout after Signals Fresh Momentum as BofA Takes Stake in It. Let us understand it in the "Chart of the Week."
As per the Latest SEBI Mandate, this isn't a Trading/Investment RECOMMENDATION nor for Educational Purposes; it is just for Informational purposes only. The chart data used is 3 Months old, as Showing Live Chart Data is not allowed according to the New SEBI Mandate.
Disclaimer: "I am not a SEBI REGISTERED RESEARCH ANALYST AND INVESTMENT ADVISER."
This analysis is intended solely for informational purposes and should not be interpreted as financial advice. It is advisable to consult a qualified financial advisor or conduct thorough research before making investment decisions.
Price Action Overview:
- Current Price: ₹2,689.70 (+13.38%)
- 52-Week High: ₹2,920.35
- 52-Week Low: ₹1,155.60
- The stock has broken out from a multi-month symmetrical triangle pattern with strong volumes
- Price is currently trading 8% below its all-time high, showing recovery momentum
- A recent breakout occurred with significant volume expansion (6.66M vs the average of 2.38M)
Volume Spread Analysis:
- Current Volume: 6.66M (significantly above average)
- Average Volume: 2.38M
- Volume Spike: Nearly 3x the average, confirming strong institutional interest
- Breakout accompanied by highest volume in recent months
- Volume expansion during up-moves and contraction during corrections is a bullish sign
- Green volume bars dominating in recent sessions indicating buying pressure
Symmetrical Triangle Breakout:
- Formation Period: Mid-2024 to Early 2026
- Apex Point: Around ₹1,600-1,700 zone
- Breakout Level: ₹2,400-2,450
- Pattern indicates consolidation followed by directional move
- Breakout suggests potential continuation of the prior uptrend from 2022 to 2023
Descending Trendline Break:
- A major descending trendline resistance from the 2023 peak has been decisively broken
- This trendline acted as resistance throughout 2024-2025
- Break confirms shift in market sentiment from bearish to bullish
Key Support and Resistance Levels:
Major Support Zones:
- Immediate Support: ₹2,400-2,450 (breakout zone and recent consolidation)
- Secondary Support: ₹2,200-2,250 (previous resistance turned support)
- Strong Support: ₹1,900-2,000 (triangle mid-point and psychological level)
- Critical Support: ₹1,600-1,700 (triangle apex and long-term support)
Major Resistance Zones:
- Immediate Resistance: ₹2,750-2,800 (short-term supply zone)
- Major Resistance: ₹2,900-2,920 (all-time high zone)
- Psychological Resistance: ₹3,000 (round number psychological barrier)
Base Formation:
- Primary Base: The symmetrical triangle from mid-2024 to early 2026 represents a consolidation base
- This base formed after a significant decline from the 2023 highs
- Base width suggests potential for sustained upward movement
- The longer consolidation typically leads to stronger breakouts
Trend Analysis:
- Short-term Trend (Daily): Bullish with strong momentum
- Medium-term Trend (Weekly): Transitioning from consolidation to bullish
- Long-term Trend (Monthly): In recovery phase after 2023-2024 correction
- Price trading above key moving average levels post-breakout
Sectoral Backdrop:
Clean Energy and Nuclear Power Sector:
- India's nuclear power capacity expansion plans gaining momentum
- Government targeting 100 GW nuclear capacity by 2047
- Small Modular Reactors (SMRs) emerging as key focus area
- Global shift toward carbon-neutral energy boosting nuclear power demand
- MTAR is positioned as a key supplier to India's nuclear program
Defense Manufacturing Sector:
- India's defense budget increased to ₹6.21 lakh crore for FY25
- The government's 'Aatmanirbhar Bharat' initiative driving domestic defense manufacturing
- Capital outlay for defense modernization supporting equipment manufacturers
- Private sector participation in defense production expanding
- MTAR supplies critical components to defence applications, including missile systems
Space Technology Sector:
- ISRO's increasing launch frequency and ambitious missions
- Private space sector opening up with policy reforms
- Growing demand for satellite components and launch vehicle parts
- India positioning itself as a low-cost space launch provider globally
- MTAR manufactures precision components for space applications
Industrial and Clean Energy Equipment:
- India's renewable energy target of 500 GW by 2030
- Growing demand for precision-engineered components in various industries
- Export opportunities expanding in specialized manufacturing
- The government's PLI schemes supporting manufacturing competitiveness
Fundamental Backdrop:
Company Overview:
- MTAR Technologies is a precision engineering solutions company
- Specializes in manufacturing critical and precision components
- Serves diversified sectors: Nuclear, Defense, Space, and Clean Energy
- Established reputation with marquee clients including ISRO, BARC, DRDO
- Listed on NSE and BSE in March 2021
Recent Key Developments:
- BofA Securities (Bank of America) has reportedly acquired a stake in the company
- This institutional interest signals confidence in the company's growth prospects
- The timing of the stake acquisition coinciding with technical breakout is noteworthy
- Institutional buying often precedes sustained upward moves
Business Strengths:
- Strong order book visibility across multiple sectors
- High entry barriers due to specialized manufacturing capabilities
- Long-term relationships with government and PSU clients
- Diversified revenue streams reducing concentration risk
- Focus on high-margin precision engineering products
Growth Drivers:
- Expanding nuclear power program in India
- Increasing defense indigenization requirements
- Growing space sector opportunities with ISRO and private players
- Clean energy transition driving demand for specialized components
- Potential for export growth in precision engineering
Key Metrics to Watch:
- Order book growth and execution
- Revenue mix across different sectors
- Operating margins and profitability trends
- Capacity utilization and expansion plans
- Working capital management
Risk Factors:
- Failure to hold ₹2,400 support could trigger profit booking
- Market-wide correction could impact momentum
- Any negative news on key sectors (defence/nuclear) could affect sentiment
- Overbought conditions in the near term may lead to consolidation
Key Levels to Watch:
- Breakout Confirmation: Sustained trade above ₹2,700
- Momentum Acceleration: Break above ₹2,920 (all-time high)
- Support Test: How price behaves if it retests ₹2,400-2,450 zone
- Volume Sustenance: Whether high volumes continue or fade
My 2 Cents:
MTAR Technologies is showing a strong technical setup following a prior symmetrical triangle breakout and current trendline breakout with exceptional volumes. The combination of technical breakout, institutional interest from BofA Securities, and favorable sectoral tailwinds in nuclear, defense, and space sectors creates a compelling case. However, traders should watch for confirmation above the ₹2,700-2,750 levels and manage risk appropriately. The stock's positioning in high-growth strategic sectors provides a supportive fundamental backdrop for the technical rally.
Full Coverage on my Mid-Week Newsletter coming Wednesday.
Keep in the Watchlist and DOYR.
NO RECO. For Buy/Sell.
📌Thank you for exploring my idea! I hope you found it valuable.
🙏FOLLOW for more
👍BOOST if you found it useful.
✍️COMMENT below with your views.
Meanwhile, check out my other stock ideas on the right side until this trade is activated. I would love your feedback.
As per the Latest SEBI Mandate, this isn't a Trading/Investment RECOMMENDATION nor for Educational Purposes; it is just for Informational purposes only. The chart data used is 3 Months old, as Showing Live Chart Data is not allowed according to the New SEBI Mandate.
Disclaimer: "I am not a SEBI REGISTERED RESEARCH ANALYST AND INVESTMENT ADVISER."
This analysis is intended solely for informational purposes and should not be interpreted as financial advice. It is advisable to consult a qualified financial advisor or conduct thorough research before making investment decisions.

ENTERO: Trendline Breakout From IPO Base, Chart of The WeekFrom IPO Euphoria to Reality Check: Is Entero Healthcare Finding Its Footing at ₹1,000? Last Week, it broke the Trendline after Taking Support on the IPO base. Let's Understand in "Chart of the Week"
As per the Latest SEBI Mandate, this isn't a Trading/Investment RECOMMENDATION nor for Educational Purposes; it is just for Informational purposes only. The chart data used is 3 Months old, as Showing Live Chart Data is not allowed according to the New SEBI Mandate.
Disclaimer: "I am not a SEBI REGISTERED RESEARCH ANALYST AND INVESTMENT ADVISER."
This analysis is intended solely for informational purposes and should not be interpreted as financial advice. It is advisable to consult a qualified financial advisor or conduct thorough research before making investment decisions.
Price Action Analysis:
Overall Trend Structure:
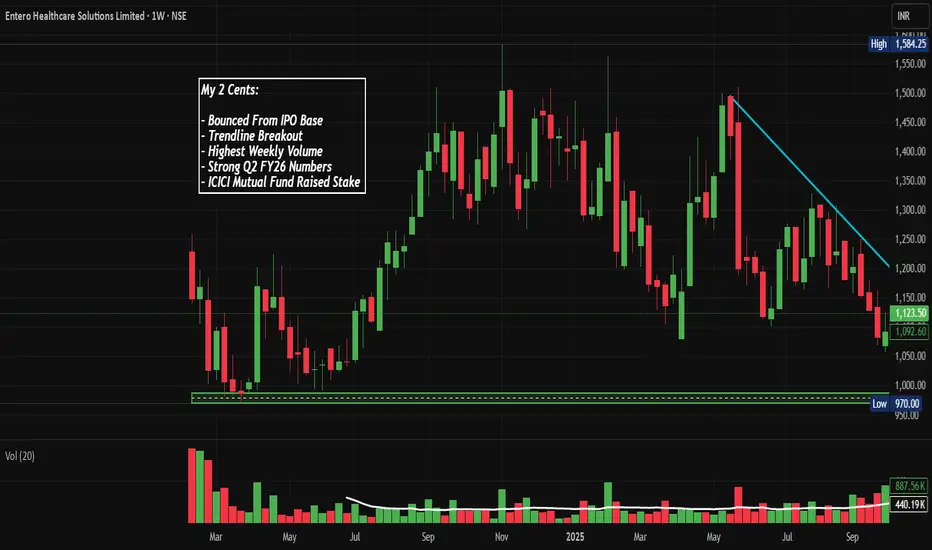
The stock exhibits a classic post-IPO distribution pattern that has transitioned into a prolonged corrective phase. After listing at premium levels, Entero Healthcare established an all-time high of around ₹1,584 in the early trading sessions. Since then, the stock has been in a consistent downtrend, forming a descending channel pattern characterised by lower highs and lower lows.
The current price action at ₹1,123 represents a potential inflexion point, with the stock attempting to reverse from its 52-week low of ₹944. This level has now been tested multiple times, suggesting it may be forming a demand zone.
Base Formation and Consolidation Zones:
A Critical IPO base zone around the ₹950-1,000 level represents the convergence of several technical factors:
- Initial Public Offering pricing memory
- Multiple tests of support over several weeks
- High volume accumulation zone
- Psychological round number support at ₹1,000
The stock spent considerable time between ₹1,100-1,300 during the mid-2025 period, forming what appears to be a distribution zone where early investors and IPO allocates likely exited positions.
Trendline Analysis:
A prominent downtrend line connects the series of lower highs from the peak at ₹1,584 down to current levels. This trendline has acted as dynamic resistance throughout the decline, with multiple failed breakout attempts. The angle of decline suggests aggressive selling pressure that has only recently started to moderate.
The recent price action shows the stock attempting to break above this multi-week downtrend line, which, if successful on sustained volume, could signal a trend reversal.
Current Price Structure:
Recent candlestick patterns show increasing buying pressure:
- Strong bullish candle with 17.95% gain, breaking above recent consolidation
- Price attempting to reclaim the ₹1,100-1,200 zone
- Reduction in selling pressure as evidenced by smaller-bodied bearish candles in recent sessions
Volume Spread Analysis:
Volume Profile:
The volume bar chart at the bottom reveals several critical insights:
Initial listing period showed extremely high volumes (approaching 3M shares), reflecting IPO excitement and allocation distribution. As the stock price declined, volume generally decreased, which is typical of a loss of interest and momentum.
Recent sessions have shown a notable pickup in volume, particularly:
- The current session is showing 2.17M shares traded
- This represents the highest weekly volume since the post-IPO period
- Volume spike coinciding with price bounce from the ₹944 low
Volume-Price Correlation:
The relationship between price and volume provides important context:
- Downtrend was accompanied by declining volume, suggesting weak conviction in the selling
- Recent bounce from ₹944 came with significant volume expansion, indicating institutional or informed buying
- The volume surge at support levels suggests accumulation rather than distribution
- Volume on up days is starting to exceed volume on down days, a positive divergence
Volume at Key Levels:
The IPO base around ₹1,000 has seen sustained high volume, creating a significant support zone. This volume cluster suggests that many participants have established positions at these levels and are likely to defend them.
Key Support and Resistance:
Major Support Levels:
Primary Support: ₹944 - This represents the 52-week low and has been tested multiple times. A breakdown below this level would be technically significant and likely trigger stop losses.
Secondary Support : ₹1,000 (IPO Base) - This psychological level and IPO reference point have provided support during multiple retests.
Tertiary Support: ₹1,100 - This level has acted as both support and resistance during the consolidation phase and represents a minor demand zone.
Major Resistance Levels:
Immediate Resistance: ₹1,200 - This level represents the recent consolidation zone ceiling and the lower boundary of the prior distribution range.
Primary Resistance: ₹1,300 - Strong resistance zone where the stock has repeatedly failed to sustain higher prices. This area coincides with multiple supply zones from earlier in the year.
Major Resistance: ₹1,400 - The upper boundary of the post-IPO distribution range. Breaking above this would negate the bearish structure.
Ultimate Resistance: ₹1,584 (All-Time High) - The peak was established shortly after IPO listing. A move to this level would represent a full recovery.
Downtrend Line Resistance:
The descending trendline connecting the highs currently intersects around the ₹1,150-1,200 zone. This dynamic resistance will need to be convincingly broken for the downtrend to be considered over. The current price action suggests this breakout may be in progress.
Major Technical Patterns:
Falling Wedge (Potential): In the most recent price action, there are early signs of a falling wedge pattern forming, characterised by converging trendlines as the stock makes lower lows with decreasing momentum. This is typically a bullish reversal pattern.
Double Bottom (Forming): The chart shows a potential double bottom pattern with lows around ₹944 separated by several weeks. This pattern would be confirmed on a break above ₹1,200 with volume.
Candlestick Patterns:
Recent price action displays several notable candlestick formations:
- Hammer candles at the ₹944 support level, indicating rejection of lower prices
- Doji candles during consolidation phases, showing indecision
- Today's strong bullish engulfing pattern suggests a momentum shift
- Decreasing size of bearish candles in the downtrend, showing exhaustion
Chart Pattern Implications:
The combination of these patterns suggests:
- Downtrend may be exhausting
- Support at ₹944 is holding firm
- Volume accumulation at lows indicates smart money positioning
- Breaking the downtrend line could trigger technical buying
- A confirmed reversal would target ₹1,300-1,400 initially
Fundamental and Sectoral Backdrop:
Company Overview:
NSE:ENTERO operates as a leading healthcare products distributor in India, ranking among the top three in the sector. Founded in 2018 by promoter Prabhat Agrawal, the company has rapidly scaled its operations through both organic growth and strategic acquisitions.
Business Model and Operations:
Core Business: Distribution and marketing of pharmaceutical and surgical products, including generic formulations, surgical consumables, medical devices, nutraceuticals, biosimilars, and hospital consumables.
Infrastructure: The company operates an extensive distribution network with 101 warehouses across 20 states, serving over 95,300 retail pharmacies and more than 3,600 hospitals.
Growth Strategy: Aggressive expansion through acquisitions. In FY2025 alone, the company acquired stakes in seven distribution entities, including 80% stakes in Avenir Lifecare and Gourav Medical Agencies, and the full acquisition of Suprabhat Pharmaceuticals and Devi Pharma Wellness.
Technology Edge: Utilises a proprietary technology platform for demand fulfilment and supply chain optimisation, positioning itself as a "Healthcare Supply Chain Solutions Specialist."
Financial Performance:
Revenue Growth: Demonstrated strong top-line growth with Q2 FY2025-26 showing 20.1% year-over-year growth and 11.8% quarter-on-quarter increase to ₹5,135 crores.
Market Capitalization: Currently around ₹4,888 crores
Profitability Journey: The company was loss-making from FY2021-2023 but turned profitable in FY2024. For the full year FY2025-2026, profit reached ₹107.43 crores, marking a significant turnaround.
Institutional Interest:
Recent institutional activity indicates growing confidence:
ICICI Prudential Mutual Fund acquired approximately 21.82 lakh shares at ₹950 per share in December 2025, signalling institutional confidence at current levels.
The acquisition was part of bulk deals, with a total transaction value of around ₹207.3 crores, showing significant institutional capital allocation.
This institutional buying coincides with the technical support zone, suggesting smart money accumulation at perceived value levels.
Sectoral Dynamics:
India's Healthcare Distribution Opportunity:
The Indian healthcare sector is experiencing transformative growth, valued at ₹31.87 lakh crores ($372 billion) in 2023 and projected to reach ₹54.67 lakh crores ($638 billion) by 2025, representing a 17.5-22.5% CAGR.
Healthcare spending is increasing from 3.3% of GDP to an expected 5% by 2030, driven by government initiatives, insurance penetration, and rising middle-class healthcare consumption.
Market Structure: The healthcare distribution sector in India remains highly fragmented, with consolidation opportunities. Entero's strategy of acquiring regional distributors aligns with this consolidation trend.
Growth Drivers:
- Expanding hospital infrastructure: Private hospitals adding 4,000+ beds with ₹11,500 crore investments in FY26
- Rising insurance penetration: Over 550 million Indians are now covered under health insurance schemes
- Tier 2 and Tier 3 city expansion: 55-60% of new hospital beds coming from secondary cities
- Ageing population: A Growing elderly demographic requiring chronic disease management
- Medical tourism: Expected to reach $14.31 billion by 2029
Competitive Positioning:
Strengths:
- Pan-India presence with an extensive warehousing network
- Authorised distributor for top pharmaceutical companies
- Strategic relationships with leading corporate hospital chains
- Technology-driven platform providing operational efficiency
- Aggressive growth through acquisitions in a fragmented market
Challenges:
- Capital-intensive business model requiring continuous working capital
- Thin margins are typical of distribution businesses
- Integration risk from multiple acquisitions
- Competition from established distributors and direct distribution by manufacturers
Credit Rating and Financial Health:
India Ratings affirmed Entero Healthcare's issuer rating at IND A-/Stable in December 2025, indicating adequate credit quality with a stable outlook.
Working Capital Intensive: A Significant portion of IPO proceeds (₹600 crores) is allocated for long-term working capital requirements, highlighting the capital-intensive nature of the business.
Strategic Outlook:
The company is well-positioned to benefit from several macro trends:
Healthcare Sector Consolidation: As the industry matures, organised distribution players like Entero will gain market share from fragmented local distributors.
Digital Health Integration: The digital health market is expected to grow at a 24.4% CAGR from 2025-2030, and Entero's technology platform positions it to capitalise on this trend.
Supply Chain Optimisation: Post-pandemic focus on resilient healthcare supply chains favours established distribution networks.
Rural Penetration: Government push for rural healthcare infrastructure creates distribution opportunities beyond metros.
Risk Factors:
Business Risks:
- High dependence on working capital financing
- Potential for inventory obsolescence in pharmaceutical distribution
- Regulatory changes in pharmaceutical pricing and distribution
- Competition from direct-to-pharmacy models by manufacturers
Financial Risks:
- Debt levels from acquisition financing
- Integration challenges from multiple acquisitions
- Margin pressure in a competitive distribution landscape
Key Metrics to Watch:
- EBITDA margin improvement from operational leverage
- Return on capital employed as brownfield expansions mature
- Working capital efficiency and cash conversion cycle
- Market share gains in key geographies
My 2 Cents:
Entero Healthcare is at a critical technical juncture, testing the boundaries of a months-long downtrend. The stock has established a strong support base around ₹944-1,000, coinciding with IPO pricing memories and significant institutional buying. Recent volume surge and price action suggest potential trend reversal, though confirmation requires a sustained break above ₹1,200.
The technical setup presents a balanced risk-reward for traders willing to use tight stops below ₹944, with initial upside targets of ₹1,300-1,400 if the reversal confirms.
From a fundamental perspective, Entero Healthcare operates in a structurally attractive sector with strong tailwinds. The company has demonstrated impressive revenue growth and recently achieved profitability. Its extensive distribution network and strategic acquisitions position it well for continued market share gains in a consolidating industry.
However, investors should note the capital-intensive nature of the business, integration risks from rapid acquisitions, and the need for sustained margin improvement to justify valuations.
The alignment of technical support with institutional buying at ₹950 levels and the strong sectoral backdrop creates an interesting setup. The stock appears to be transitioning from the IPO distribution phase to the potential accumulation phase. For position traders, the current levels offer an entry opportunity with defined risk below ₹944 and potential reward toward ₹1,300-1,400.
The key catalysts to watch include:
- Quarterly results demonstrating margin expansion
- Successful integration of recent acquisitions
- Sustained volume above ₹1,200 confirming trend reversal
- Further institutional accumulation
- Sector-wide tailwinds from healthcare spending growth
The convergence of technical base formation, institutional interest, and strong sectoral dynamics creates a compelling narrative, though investors should remain mindful of execution risks and maintain appropriate position sizing with stop losses.
Full Coverage on my Mid-Week Newsletter coming Wednesday.
Keep in the Watchlist and DOYR.
NO RECO. For Buy/Sell.
📌Thank you for exploring my idea! I hope you found it valuable.
🙏FOLLOW for more
👍BOOST if you found it useful.
✍️COMMENT below with your views.
Meanwhile, check out my other stock ideas on the right side until this trade is activated. I would love your feedback.
As per the Latest SEBI Mandate, this isn't a Trading/Investment RECOMMENDATION nor for Educational Purposes; it is just for Informational purposes only. The chart data used is 3 Months old, as Showing Live Chart Data is not allowed according to the New SEBI Mandate.
Disclaimer: "I am not a SEBI REGISTERED RESEARCH ANALYST AND INVESTMENT ADVISER."
This analysis is intended solely for informational purposes and should not be interpreted as financial advice. It is advisable to consult a qualified financial advisor or conduct thorough research before making investment decisions.
How to trade fake Breakout using volume
The Breakout - Price breaks above a resistance line, tricking buyers into thinking the price will keep going up.
The Trap - Professional sellers step in, creating an "imbalance" where selling pressure outweighs buying.
The Result - Price crashes back down, "trapping" the buyers who bought at the top. This sharp drop often provides a strong Short Entry for traders.
Also top now working as strong resistance
For identifying volume imbalance i made indicator to find aggresive buyer sellers active maybe it will help you to identify buyer sellers aggressive activity.
Here pine script -

HINDCOPPER: Trendline and Triangle Breakout, Chart of the MonthWhy This NSE:HINDCOPPER Chart Could Signal India's Next Major Commodity Play, even after giving such a robust run so far. Let's Understand in the "Chart of The Month"
As per the Latest SEBI Mandate, this isn't a Trading/Investment RECOMMENDATION nor for Educational Purposes; it is just for Informational purposes only. The chart data used is 3 Months old, as Showing Live Chart Data is not allowed according to the New SEBI Mandate.
Disclaimer: "I am not a SEBI REGISTERED RESEARCH ANALYST AND INVESTMENT ADVISER."
This analysis is intended solely for informational purposes and should not be interpreted as financial advice. It is advisable to consult a qualified financial advisor or conduct thorough research before making investment decisions.
Price Action Analysis:
Long-Term Trend Structure:
- Historical Peak and Correction: The stock witnessed a spectacular rally in early 2010, reaching an all-time high of ₹658, marking its glory days during the global commodity super-cycle. This was followed by a brutal multi-year correction that took the stock down approximately 90% to levels near ₹55 by 2013.
- Extended Consolidation Phase (2013-2020): After the sharp decline, the stock entered a prolonged seven-year consolidation phase, oscillating between ₹40 and ₹90, building a massive base structure. This extended sideways movement allowed weak hands to exit and created a solid accumulation zone.
- The 2020-2023 Recovery Rally: Post-COVID recovery and commodity reflation themes triggered a strong upward movement from pandemic lows around ₹30-40 to the ₹90-120 range, marking the beginning of a structural reversal.
- Triangle Breakout Formation: The chart clearly displays a large ascending triangle pattern formed between 2020 and 2025, with the stock making higher lows while testing resistance near the ₹420-450 zone multiple times. The recent price action shows a decisive breakout above this multi-year resistance.
Current Price Action:
- Breakout and Retest: The stock has broken out from the ascending triangle pattern and is currently trading around ₹475.60 (as of December 27, 2025), showing a gain of approximately 45% from its recent breakout point.
- Intraday Movement: Current session shows strong volatility with an intraday high of ₹480.85 and a low of ₹443.25, indicating active participation from both bulls and bears near record levels.
- Short-Term Performance: The stock has surged over 75% in calendar year 2025 and has gained approximately 74.8% in the last six months, significantly outperforming the broader Nifty 50 index, which is up only 10.83% year-to-date.
Volume Spread Analysis:
- Volume Surge: The volume panel shows exceptional activity in recent sessions, with December 27 recording 494.78 million shares traded versus the 20-day average of 166.43 million shares, representing nearly 3x the normal volume. This indicates strong institutional and retail interest.
- Second Best Volume in History: Recent sessions have recorded the second-highest volume in the stock's trading history, suggesting a major accumulation or distribution phase.
- Volume Confirmation: The breakout from the triangle pattern is accompanied by robust volume expansion, which validates the move and reduces the probability of a false breakout.
Key Technical Levels:
Support Zones:
- Immediate Support: ₹415-420 zone, which represents the upper boundary of the recently broken triangle pattern. This level previously acted as resistance and should now provide support on any pullback.
- Secondary Support: ₹380-390 range, coinciding with the previous swing high from mid-2024.
- Major Support Base: ₹300-320 zone, which served as a strong consolidation area during the triangle formation phase. This represents a critical support level for the medium-term uptrend.
- Long-Term Base: ₹200-220 area, which marks the ascending trendline of the triangle pattern and would be a key level to watch in case of a deeper correction.
Resistance Zones:
- Immediate Resistance: ₹480-490 zone, representing the current all-time high region for this rally phase.
- Psychological Barrier: ₹500 level, a round number that often acts as psychological resistance.
- Historical Peak: ₹658 (all-time high from 2010), which remains the ultimate resistance target. However, adjusting for inflation and changed market conditions, this level may need to be recalculated.
Base Formation:
- Multi-Year Base (2020-2024): The stock carved out a large accumulation base between ₹150 and ₹450 over approximately four years, characterised by higher lows and repeated tests of the ₹400-420 resistance zone.
- Base Depth and Width: The base shows a well-structured pattern with good width (4+ years) and reasonable depth, which typically precedes significant upward moves.
Technical Patterns:
Ascending Triangle Pattern:
- Formation: Clear ascending triangle pattern visible from 2022 to 2025 with a flat top around ₹420-450 and rising bottoms connecting approximately ₹200 to ₹380.
- Breakout: Decisive breakout occurred in late 2024/early 2025 with strong volume confirmation.
Symmetrical Triangle:
- The cyan-colored triangle marked on the chart shows a shorter-term symmetrical compression pattern forming during 2024-2025, which has also been broken to the upside.
- This pattern suggests continuation of the bullish momentum with potential targets in the ₹500-550 range in the near term.
Higher Highs and Higher Lows:
- Since the 2020 bottom, the stock has consistently printed higher highs and higher lows, establishing a clear uptrend structure across multiple timeframes.
- Each correction has found support at progressively higher levels, indicating strong underlying demand.
Sectoral Backdrop:
Global Copper Market Dynamics:
- Supply-Demand Imbalance: The global copper market is sliding into a deficit, with the International Copper Study Group expecting a refined copper shortfall of around 150,000 tonnes in 2026, reversing previous surplus forecasts.
- Production Challenges: UBS forecasts deficits of 230,000 tonnes in 2025 and more than 400,000 tonnes in 2026 as mine disruptions in Chile, Peru and Indonesia collide with rising demand.
- Price Rally: International copper prices have surged approximately 36% year-to-date, reaching near-record levels above $12,000 per tonne on the LME, driven by tight supply and robust demand.
Structural Demand Drivers:
- AI and Data Centres: Data centres are estimated to need around 1.1 million tonnes of copper annually by 2030, close to 3% of global demand, representing a massive new source of inelastic demand.
- Electric Vehicles: Copper demand from the EV sector is projected to climb from 1.7 million tonnes per annum today to 4.3 million tonnes by 2035, growing at an annual rate of 10%.
- Energy Transition: The shift to renewable energy systems will require an additional 2 million tonnes of copper supply over the next decade, according to Wood Mackenzie research.
- Emerging Market Growth: India and Southeast Asia are expected to add 3.3 million tonnes of demand by 2035, translating to average annual growth rates of 7.8% and 8.2% respectively.
India-Specific Dynamics:
- Strategic Positioning: India is expected to surpass the United States as the world's third-largest copper consumer by 2050, reflecting rapid industrialisation and infrastructure development.
- Import Dependence: India currently imports a significant portion of its copper requirements, making domestic producers like Hindustan Copper strategically important.
- Government Focus: Copper has been included in the US Critical Minerals list, and similar designations globally highlight its strategic importance for economic and national security.
Fundamental Backdrop:
Company Overview:
- Monopoly Position: Hindustan Copper is the only Indian company mining copper and owns all the operating mining leases of copper ore in India, having access to about 45% of India's copper ore reserves and resources as of FY25.
- Vertical Integration: The company is India's sole vertically integrated copper producer, with operations spanning mining, ore beneficiation, smelting, refining, and rod extrusion.
- Government Backing: HCL is a Miniratna Category-I Central Public Sector Enterprise under the Ministry of Mines, providing it with government support and strategic importance.
Production and Operations:
- Production Capacity: Hindustan Copper produced approximately 537,000 tonnes of copper in the financial year 2025, outperforming private sector peers.
- Resource Base: The company holds resources and reserves of 755.32 million tonnes estimated as of April 1, 2024.
- Operational Units: HCL operates mines at Malanjkhand (Madhya Pradesh), Khetri (Rajasthan), and the Indian Copper Complex at Ghatsila (Jharkhand), along with smelting and refining facilities.
Recent Financial Performance:
- Strong Growth: Hindustan Copper reported a 39.1% quarter-on-quarter increase in consolidated revenues for Q2 FY 2025-26, with year-on-year growth of 38.5%.
- Profitability: Net profit increased 38.5% QoQ and 83% YoY in Q2 FY26, demonstrating strong operational leverage.
- Debt Reduction: The company has significantly reduced its debt burden, improving financial health and flexibility for expansion projects.
Strategic Initiatives:
- Revival of Rakha Mine: The company successfully executed a mining lease deed for the strategically important Rakha Mine in September 2024, which should boost future copper output.
- International Collaboration: HCL signed an MoU with CODELCO, Chile's state-owned copper mining giant, in April 2025 to exchange expertise and enhance capabilities in mineral exploration and processing.
- Expansion Plans: An MoU with NTPC Mining Ltd was signed in December 2025 to jointly pursue copper and critical minerals block auctions, indicating an aggressive expansion strategy.
- State-Level Partnerships: MoU signed with Madhya Pradesh State Mining Corporation for exploration of critical minerals, including copper, in the state.
Valuation Metrics:
- PE Ratio: The stock trades at a trailing PE of approximately 80x, which is elevated but reflects its monopoly position and growth expectations.
- Market Capitalisation: As of December 27, 2025, the company's market cap stands at approximately ₹42,992 crore.
Key Developments:
- LIC Stake Sale: Life Insurance Corporation of India reduced its stake from 6.086% to 4.072% through open market sales between August 2024 and December 2025, representing a booking of profits after the strong rally.
Risk Factors:
Technical Risks:
- Overextension: The stock has rallied 75% year-to-date and is trading well above its intrinsic value estimates, suggesting vulnerability to profit-booking.
- Resistance Ahead: The stock is approaching psychological resistance at ₹500 and faces uncertain price discovery beyond current levels.
- Volume Concerns: Extremely high volumes could indicate climactic buying, which sometimes precedes consolidation or correction phases.
Fundamental Risks:
- Commodity Price Volatility: As a pure-play copper producer, the company is susceptible to international copper price fluctuations.
- Production Constraints: Several of the company's smelting and refining facilities have remained suspended since 2019, limiting downstream value addition.
- Operational Efficiency: The company currently sells copper concentrate rather than finished products from some facilities, reducing margins.
- Execution Risk: Ambitious expansion plans through auctions and partnerships carry execution and capital deployment risks.
Market Risks:
- Valuation Multiple Compression: At current elevated valuations, any disappointment in earnings growth or copper prices could trigger sharp corrections.
- Global Economic Slowdown: Recession fears or China slowdown could impact copper demand despite structural growth drivers.
- Supply Response: Higher prices may eventually incentivise new supply additions globally, potentially easing the deficit.
Bull Case:
- India's Only Copper Miner: Monopoly position in copper ore mining provides strategic moat and pricing power.
- Structural Demand Drivers: AI, EVs, renewable energy, and India's industrialisation create multi-year demand tailwinds.
- Supply Deficit: Global copper market moving into deficit with limited near-term supply additions supporting prices.
- Operational Leverage: Fixed cost base means higher copper prices flow directly to the bottom line.
- Strategic Importance: Government backing and critical mineral status provide support for expansion.
Bear Case:
- Extreme Valuation: Trading at a 257% premium to intrinsic value leaves little room for error.
- Production Limitations: Suspended facilities and the concentrate sales model limit revenue potential.
- Execution Uncertainty: New projects through auctions are years away from production.
- Commodity Cyclicality: Copper prices could correct sharply if macro conditions deteriorate.
- Institutional Profit-Booking: LIC stake reduction signals some smart money taking profits.
My 2 Cents:
NSE:HINDCOPPER is at a critical juncture, benefiting from a rare combination of technical breakout, commodity super-cycle dynamics, and structural demand shifts driven by AI and electrification. But at these elevated valuations, be cautious and have disciplined risk management.
Full Coverage on my Mid-Week Newsletter coming Wednesday.
Keep in the Watchlist and DOYR.
NO RECO. For Buy/Sell.
📌Thank you for exploring my idea! I hope you found it valuable.
🙏FOLLOW for more
👍BOOST if you found it useful.
✍️COMMENT below with your views.
Meanwhile, check out my other stock ideas on the right side until this trade is activated. I would love your feedback.
As per the Latest SEBI Mandate, this isn't a Trading/Investment RECOMMENDATION nor for Educational Purposes; it is just for Informational purposes only. The chart data used is 3 Months old, as Showing Live Chart Data is not allowed according to the New SEBI Mandate.
Disclaimer: "I am not a SEBI REGISTERED RESEARCH ANALYST AND INVESTMENT ADVISER."
This analysis is intended solely for informational purposes and should not be interpreted as financial advice. It is advisable to consult a qualified financial advisor or conduct thorough research before making investment decisions.

RAIN: Turnaround Fundamental Play,Trendline BO,Chart of the WeekNSE:RAIN When Carbon Giants Face the Perfect Storm of Bearish Signals and Sectoral Headwinds NSE:RAIN showing signs of Fundamental Turnaround. Let's understand this week's "chart of the week"
As per the Latest SEBI Mandate, this isn't a Trading/Investment RECOMMENDATION nor for Educational Purposes; it is just for Informational purposes only. The chart data used is 3 Months old, as Showing Live Chart Data is not allowed according to the New SEBI Mandate.
Disclaimer: "I am not a SEBI REGISTERED RESEARCH ANALYST AND INVESTMENT ADVISER."
This analysis is intended solely for informational purposes and should not be interpreted as financial advice. It is advisable to consult a qualified financial advisor or conduct thorough research before making investment decisions.
Price Action Analysis:
Long-Term Trend Structure:
- The stock demonstrated a spectacular bull run from 2021 lows around ₹75-80 levels to highs of ₹272.75 achieved in mid-2021
- Post the euphoric rally, the stock entered a prolonged consolidation and distribution phase spanning from July 2021 to early 2024
- During 2022-2023, the stock oscillated in a broad range between ₹130 and ₹ 220, forming a rectangular consolidation pattern
- From late 2023 onwards, the stock began showing signs of weakness with lower highs formation
Current Breakdown Phase (2024-2025):
- A decisive breakdown occurred in late 2024 when the stock breached the crucial ₹140-145 support zone
- The stock has entered a steep declining phase, currently trading around ₹124.60 (as of Dec 20, 2025)
- The recent price action shows a sharp downturn with the stock making new 52-week lows at ₹99.90
Volume Spread Analysis:
Volume Trends:
- A massive volume spike is visible in the most recent sessions, reaching approximately 36.64 million shares
- This represents nearly 4x the average weekly volume of around 9.36 million shares
- Historical volume analysis shows earlier spikes during the 2021 peak (around 80 million) and the 2024 rally attempts
Key Technical Levels:
Support Zones:
- Major Support: ₹99.90 - The recent 52-week low and next critical support level
- Psychological Support: ₹100 - Round number support with psychological significance
- Ultimate Support: ₹80-85 zone - Corresponds to early 2023 lows
Resistance Zones:
- Immediate Resistance: ₹135-140 - Previous support turned resistance
- Minor Resistance: ₹150-155
- Major Resistance: ₹165-170
- Strong Resistance: ₹180-185 - Breakdown point of the larger distribution pattern
- Formidable Resistance: ₹200-210 - Multiple failed rally attempts from this zone
Base Formation Analysis:
- No clear base formation is visible in the current structure
- The stock is in an active downtrend without any consolidation base
- The previous base was formed between ₹140-180 during 2023-2024, which has now failed
- A new base formation would require at least 2-3 months of sideways consolidation
- An ideal base would form above the ₹100 psychological level with declining volume
Sectoral Overview:
Industry Classification:
- Rain Industries operates in the Chemicals and Petrochemicals sector
- Specifically focused on Carbon Products, Advanced Materials, and Cement segments
- The company is a leading vertically integrated producer of calcined petroleum coke (CPC) and coal tar pitch (CTP)
- Products serve the aluminium, steel, graphite electrodes, and construction industries
Global Market Position:
- Rain Industries is among the world's largest producers of calcined petroleum coke
- The company is the largest coal tar distiller globally
- Operations span across 14 locations in 8 countries across three continents
- Annual production capacity: 2.4 million tons of CPC and 1.0 million tons of tar distillation
Sectoral Challenges (2024-2025):
- The aluminium industry, which accounts for approximately 42% of Rain's revenues, has faced headwinds
- Global aluminium production continues to expand to meet growing demand, with LME aluminium prices trading around $2,600 per ton
- European aluminium smelters face structural decline pressures due to high energy costs
- Raw material availability constraints have impacted production schedules
- Supply chain issues and challenges in securing raw materials could impact production and costs
Sector Outlook for 2025-2026:
- The global aluminium market is projected to reach $355 billion by 2030, expanding at a CAGR of approximately 4.8%
- Demand growth expected from the automotive industry's lightweighting trend and electric vehicle adoption
- Increasing emphasis on low-carbon aluminium and sustainability initiatives
- Aluminium's recyclability has become significant, with recycling requiring only 5% of the energy needed for primary production
- Infrastructure spending in India and globally should support aluminium and construction material demand
Fundamental Backdrop:
Recent Financial Performance:
- Q3 FY2025 revenue stood at ₹44.76 billion with adjusted EBITDA of ₹6.48 billion
- Q2 2025 showed revenue growth of 17% quarter-over-quarter, driven by higher CPC volumes and prices
- The company operates at approximately 90% capacity utilization
- For Q2 FY2026, the company posted a profit of ₹106.01 crore, reversing a ₹179.11 crore loss year-over-year
Business Segment Performance:
- Carbon Segment: Largest revenue contributor with sales volumes of 664,000 MT in Q2 FY2025
- Advanced Materials: Showed 317% EBITDA growth quarter-over-quarter due to improved seasonality
- Cement Business: Faces challenges, but outlook is improving with infrastructure spending
- Company approved ₹7.57 billion cement expansion with commercial operation date in H2 2027
Financial Health Concerns:
- The company has a low interest coverage ratio and delivered poor sales growth of 4.46% over the past five years
- Return on equity is negative at -0.31% over the last 3 years
- Market capitalization as of November 27, 2025, stood at ₹3,619.08 crore
- High net debt of $699 million could constrain financial flexibility
- PE ratio of -104.48 indicates negative earnings
Recent Developments:
- The company declared a dividend of ₹1.00 per share in June 2025, yielding 1.58%
- Safety performance improved significantly with the Total Recordable Incident Rate decreasing to 0.03 in H1 2025
- Management focusing on cost-saving measures, ESG compliance, and debt optimisation
- Company investigating application of biocarbon materials in its product portfolio
Valuation Metrics:
- 52-week high: ₹180 (touched in early 2025)
- 52-week low: ₹99.80
- Current price: ₹124.60
- Price-to-Book ratio: 0.60 (as of Dec 2025)
- Stock down approximately -27.80% year-over-year, underperforming Sensex's 9.5% gain
Risk Factors and Challenges:
Operational Risks:
- Dependence on raw material availability, particularly green petroleum coke
- Energy cost volatility, especially in European operations
- Capacity utilization challenges impacting profitability
- Competition in battery materials and advanced materials segments
- Planned maintenance activities disrupting production schedules
Market and Sectoral Risks:
- Aluminium industry demand uncertainty in the European and US markets
- Geopolitical tensions affecting global trade and supply chains
- China's production nearing regulatory ceiling could trigger market distortions
- Regulatory changes and environmental compliance costs are increasing
- Potential tariff impacts on international trade
Financial Risks:
- High debt levels constrain strategic flexibility
- Negative operating cash flow concerns
- Low profitability margins despite revenue growth
- Currency fluctuation risks due to global operations
- Interest coverage ratio remaining weak
My 2 Cents:
Fundamental vs Technical Divergence:
- While the company shows operational improvement in recent quarters, market sentiment remains negative
- The gap between fundamental progress and stock performance is widening
- High debt levels and sectoral headwinds overshadow operational gains
- Market positioning the stock as a value trap rather than a value opportunity currently
- Investor confidence needs restoration through consistent delivery and debt reduction
NSE:RAIN represents a classic case of a fundamentally improving company caught in a perfect storm of technical breakdown, sectoral headwinds, and erosion of sentiment. The chart structure has deteriorated significantly, with the stock breaking below multi-year support zones and displaying all characteristics of a sustained downtrend. While the aluminium sector outlook for 2025-2026 appears constructive and the company has shown operational improvements, the market is clearly sceptical about near-term prospects given the high debt burden and challenging market environment.
The coming months will be crucial in determining whether Rain Industries can stabilise around the psychological ₹100 mark or if further capitulation to ₹85-90 levels is in store. Only a decisive reclaim of ₹140 with volume would suggest that the worst is behind, making it a level to watch closely for any signs of trend reversal.
Full Coverage on my Newsletter this Week
Keep in the Watchlist and DOYR.
NO RECO. For Buy/Sell.
📌Thank you for exploring my idea! I hope you found it valuable.
🙏FOLLOW for more
👍BOOST if you found it useful.
✍️COMMENT below with your views.
Meanwhile, check out my other stock ideas on the right side until this trade is activated. I would love your feedback.
As per the Latest SEBI Mandate, this isn't a Trading/Investment RECOMMENDATION nor for Educational Purposes; it is just for Informational purposes only. The chart data used is 3 Months old, as Showing Live Chart Data is not allowed according to the New SEBI Mandate.
Disclaimer: "I am not a SEBI REGISTERED RESEARCH ANALYST AND INVESTMENT ADVISER."
This analysis is intended solely for informational purposes and should not be interpreted as financial advice. It is advisable to consult a qualified financial advisor or conduct thorough research before making investment decisions.

ROLEXRINGS: Trendline BO & IPO Base Bounce, Chart of the WeekFrom IPO Highs to back to IPO Base: Can Rolex Rings Break the Downtrend After 64% Crash?
After Promoter Buying and Decent Mangment Commentary Post Q2 FY26 Amid US Tariff, Let's Decode in This Week's "Chart of the Week"
As per the Latest SEBI Mandate, this isn't a Trading/Investment RECOMMENDATION nor for Educational Purposes; it is just for Informational purposes only. The chart data used is 3 Months old, as Showing Live Chart Data is not allowed according to the New SEBI Mandate.
Disclaimer: "I am not a SEBI REGISTERED RESEARCH ANALYST AND INVESTMENT ADVISER."
This analysis is intended solely for informational purposes and should not be interpreted as financial advice. It is advisable to consult a qualified financial advisor or conduct thorough research before making investment decisions.
Price Action:
- The stock has witnessed a severe downtrend from its peak of approximately ₹280 in mid-2024 to a low of ₹99.48, representing a decline of approximately 64% from peak levels
- The chart displays a classic bearish trend characterized by lower highs and lower lows throughout 2024 and into 2025
- Price action shows the stock trading near its 52-week lows, with current price around ₹111 after bouncing from the ₹99.48 IPO Base
Trendline Analysis:
- A descending trendline has been drawn connecting the highs from mid-2024 through late 2025
- This trendline has acted as strong dynamic resistance, rejecting price advances multiple times
- The trendline currently extends downward toward the ₹100-110 zone, suggesting continued bearish momentum unless broken decisively
- The stock broke this trendline with good volumes recently, as evidenced by the spike in volume to 76.29M from an average of 6.23M.
Volume Spread Analysis:
- Average volume: 6.23M shares
- Recent surge: 76.29M shares (more than 12x average)
- Volume spike coincides with the trendline breakout attempt and bounce from lows
- This extraordinary volume surge suggests significant institutional or promoter buying interest
- Volume pattern shows accumulation at lower levels, which is a positive sign
- Higher volumes during bounce from support indicate strong conviction in buyers
Base Formation & Support Levels:
Key Support Zones:
- Primary Support (IPO Base): ₹98-120 zone - This was the IPO issue price and has historical significance as a psychological support level
- Immediate Support: ₹99.48 - The recent low established, which acted as a strong bounce point
- Secondary Support: ₹100 - Round number psychological support
- A potential base formation is emerging in the ₹99-120 range after months of decline
Resistance Levels:
- Immediate Resistance: ₹130-140 zone (previous support turned resistance)
- Intermediate Resistance: ₹160-170 (multiple rejections in this zone during the downtrend)
- Major Resistance: ₹180-200 zone (previous consolidation area)
- The descending trendline acts as dynamic resistance currently around ₹150-160
- Ultimate Resistance: ₹240-280 zone (peak highs from 2024)
Technical Patterns:
Descending Channel:
- The stock has been trading within a well-defined descending channel since mid-2024
- Lower boundary of channel approximately at ₹100, upper boundary following the drawn trendline
- Recent price action suggests potential channel breakout attempt
Double Bottom Formation (Potential):
- The chart shows a potential double bottom pattern forming around the ₹100 level
- First bottom at ₹99.48 (recent low)
- Second bottom would need to be confirmed near similar levels with higher low
- Neckline resistance would be around ₹140-150 zone
- This pattern, if confirmed, could signal trend reversal
Falling Wedge (Forming):
- The narrowing range between descending trendline and support suggests a falling wedge pattern
- Falling wedges are typically bullish reversal patterns
- Breakout above the trendline with volume could trigger significant upside
My Key Technical Observations:
- The stock has been in a sustained downtrend for approximately 18 months
- Recent price action shows signs of exhaustion at lower levels
- Trendline break with massive volume is a significant development
- The stock is oversold and due for a technical bounce
- Risk-reward ratio favors long positions from current levels with stop loss below ₹99
My Technical Outlook:
Bullish Case:
- Trendline breakout with exceptional volume
- Support holding at IPO base (₹118) and recent low (₹99.48)
- Potential reversal patterns forming
- Oversold conditions on longer timeframes
- Smart money accumulation evident from volume analysis
Bearish Case:
- Long-term downtrend still intact until sustained breakout
- Multiple resistance levels overhead
- Weak fundamental performance in recent quarters
- Sectoral headwinds persist
Sectoral and Fundamental Backdrop:
Company Overview:
NSE:ROLEXRINGS , headquartered in Rajkot, Gujarat, is among India's leading manufacturers of forged and machined bearing rings and automotive components in the private sector. The company boasts a forging capacity of 144,750 metric tons per annum (MTPA) and an annual machining capacity of 73 million pieces. It serves clients across India and 15 international markets spanning North America, Europe, and Africa.
Product Portfolio:
- Bearing Rings (approximately 45-47% of revenue): Ball bearing rings, cylindrical, tapered, and spherical types for automotive, railways, industrial, and wind turbine applications
- Automotive Components (approximately 53-55% of revenue): Transmission components (gear blanks, ring gears, sun and pinion, shafts), engine components (pulleys, cam lobes), chassis components (wheel hubs, Gen2 and Gen3 bearing components, output shafts, CVJ components), and exhaust system components
Sector Analysis: Auto Components Industry:
Industry Challenges (2025):
The auto components sector has faced significant headwinds through 2025, with demand moderation across passenger vehicles, commercial vehicles, and two-wheelers impacting component manufacturers. The sector is experiencing increased competitive intensity, with OEMs exerting pressure on suppliers to reduce costs while simultaneously demanding higher quality standards and faster delivery cycles.
Growth Drivers:
- Domestic automobile demand remains relatively robust
- Electric vehicle (EV) and hybrid segment growth (company derives 8% of FY25 revenue from this segment)
- China+1 strategy benefiting Indian manufacturers
- Localization push by global OEMs
Financial Performance Analysis:
Recent Performance (Q2 FY26):
Rolex Rings reported net sales of ₹271.38 crores in Q2 FY26, marking a 6.93% sequential decline from ₹291.58 crores in Q1 FY26 and a 9.62% year-on-year drop from ₹300.27 crores in Q2 FY25. Net profit declined 9.94% quarter-on-quarter to ₹44.34 crores from ₹49.16 crores in Q1 FY26.
Margin Pressure:
Operating margins (excluding other income) have declined from a peak of 22.89% in June 2024 to 20.21% in September 2025, a contraction of 268 basis points over five quarters. This margin compression reflects pricing pressures and unfavorable product mix shifts.
Profitability Metrics:
- PE Ratio: 19.97
- PB Ratio: 3.24
- ROE: 17.48% (latest quarter, down from historical average of 22.12%)
- ROCE: 26.44%
Key Fundamental Challenges:
US Tariff Impact:
While the company had previously guided for 14-16% top-line growth for FY26, management has now moderated this to "early teen growth" if US tariffs persist, with higher growth expected in FY27. The company notes that US customer-related volumes have slowed considerably until there is clarity on the final trade deal. However, there's a 25% US custom duty waiver in major portion of exports to US, effective from November 1, 2025.
Export-Domestic Mix:
- Exports: 51-52% of revenue
- Domestic: 48-49% of revenue
- Bearing rings export business facing subdued global demand, particularly in industrial segment
- Auto components export business showing resilience, especially in Europe and Mexico
Positive Developments:
Strong Order Book:
The company has Rs 1.75 billion of order inflows expected to flow from Q2FY26, which can be ramped up to Rs 2.5 billion in FY27. The management expects 15% blended growth for FY26 and 10% growth guidance for FY27.
Operational Excellence:
The significant EBITDA margin expansion in Q1FY26 to 26.5%, up from 21.9% in Q4FY25, demonstrates management's strong grip on cost control and operational efficiencies. The company has successfully commissioned a 9MW solar plant (expected to be operational by December 2025), adding to existing 17.08MW capacity, which aids margin improvement.
Balance Sheet Strength:
The company has transitioned to a net cash position from previous debt levels, demonstrating strong cash management. For FY26, management has guided a much lower capital expenditure of ₹30-35 crore, which can easily be funded by internal accruals.
Strategic Positioning:
Market Position:
Rolex Rings ranks top 5 amongst 130 active competitors in the forging and machining space. The company is benefiting from the China+1 theme, receiving improved traction from the US and Europe as an alternative to Chinese suppliers.
Customer Diversification:
The company is actively diversifying its customer base and expanding into value-added products for EVs/Hybrids which require complex machining and fetch approximately 200 basis points higher margins over standard offerings.
Strengths:
- Strong domestic market presence
- Diversified product portfolio across bearing rings and auto components
- Healthy order book visibility for FY26-27
- Improved operational efficiency and margin trajectory (when excluding tariff headwinds)
- Net cash position providing financial flexibility
- Competitive positioning in forging capacity
Risks:
- Export market volatility due to global trade tensions and tariffs
- Sustained margin pressure from OEM cost reduction demands
- Subdued growth in commercial vehicle and industrial segments
- High dependence on automotive sector cyclicality
- Revenue degrowth trend in recent quarters
Valuation Perspective:
At current levels around ₹111, the stock trades significantly below its historical highs and near book value. While near-term challenges persist, the long-term structural growth story of India's automotive sector, coupled with the company's strong market position and improving operational metrics, presents a compelling risk-reward opportunity for patient investors.
Management Outlook:
The company anticipates recovery in bearing rings business by Q3-Q4 FY26 and expects full recovery in export markets to take four to six quarters. The management remains confident about achieving EBITDA margins of 23.5-24% in FY26 and over 24% in FY27, supported by improved operational leverage, product mix enhancement, and benefits from renewable energy investments.
Full Coverage on my Newsletter this Week
Keep in the Watchlist and DOYR.
NO RECO. For Buy/Sell.
📌Thank you for exploring my idea! I hope you found it valuable.
🙏FOLLOW for more
👍BOOST if you found it useful.
✍️COMMENT below with your views.
Meanwhile, check out my other stock ideas on the right side until this trade is activated. I would love your feedback.
As per the Latest SEBI Mandate, this isn't a Trading/Investment RECOMMENDATION nor for Educational Purposes; it is just for Informational purposes only. The chart data used is 3 Months old, as Showing Live Chart Data is not allowed according to the New SEBI Mandate.
Disclaimer: "I am not a SEBI REGISTERED RESEARCH ANALYST AND INVESTMENT ADVISER."
This analysis is intended solely for informational purposes and should not be interpreted as financial advice. It is advisable to consult a qualified financial advisor or conduct thorough research before making investment decisions.
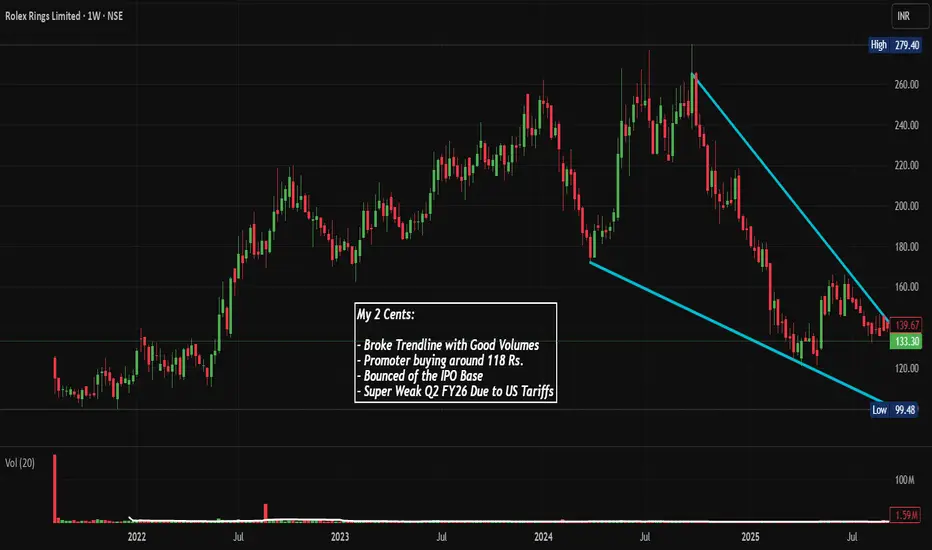
BSOFT: Trendline BO, Double Bottom Formation, Chart of the WeekIs NSE:BSOFT Technical Breakout Real? What the Charts Tell You About This Mid-Cap IT Giant's Next Move after Weaking Rupee and Strong Margins Recovery in Q2FY26. Let's Analyze in Chart of the Week.
As per the Latest SEBI Mandate, this isn't a Trading/Investment RECOMMENDATION nor for Educational Purposes; it is just for Informational purposes only. The chart data used is 3 Months old, as Showing Live Chart Data is not allowed according to the New SEBI Mandate.
Disclaimer: "I am not a SEBI REGISTERED RESEARCH ANALYST AND INVESTMENT ADVISER."
This analysis is intended solely for informational purposes and should not be interpreted as financial advice. It is advisable to consult a qualified financial advisor or conduct thorough research before making investment decisions.
Price Action Analysis:
Long-Term Trend Structure:
- The stock experienced a strong uptrend from early 2022 to peak levels around ₹861.85 (High) in early 2024, representing a massive rally from the ₹250-300 base
- Following the peak, Birlasoft entered a prolonged correction phase, declining from ₹861.85 to a low of ₹250.25, marking approximately 71% retracement from the top
- Currently trading at ₹432.75 as of December 6, 2025, showing a recent +13.82% bounce
- The stock has been consolidating in the ₹350-450 range for the past several months after bottoming out
Current Price Action Characteristics:
- Recent price action shows signs of accumulation near the ₹350-380 support zone
- The stock broke above a descending trendline (cyan line on the chart) which connected the highs from early 2024 through late 2025
- This trendline break suggests a potential shift in momentum from bearish to bullish
- The green horizontal box at the bottom (₹300-350 zone) appears to mark a strong demand zone where buyers stepped in aggressively
- Post-trendline breakout, the stock has shown resilience with higher lows being formed
Stage Analysis Interpretation:
- The stock broke the trendline after a Stage 4 breakdown
- Formed a Stage 1 type of double bottom base pattern
- Was in Stage 2 Uptrend between April 2023 and February 2024
- No Stage 3 distribution pattern was visible on top
- The presence of weak rupee and improving operating margins has added fundamental strength
Volume Spread Analysis:
Volume Distribution Patterns:
- The volume chart shows significant spikes during key price movements
- Major volume accumulation visible during the decline phase in late 2024 and early 2025, suggesting capitulation
- Recent volume (25.13M) is substantially higher than the average (7.84M), indicating increased participation
- Volume spikes coinciding with the recent rally from ₹350-380 levels suggest genuine buying interest
- The green volume bars in recent sessions indicate buying pressure supporting the upward move
Volume-Price Relationship:
- During the downtrend, volume increased on down days, confirming selling pressure
- At the bottom formation (₹300-350 zone), volume remained elevated but price held ground - classic accumulation behavior
- The breakout from the descending trendline came with above-average volume, validating the move
- Current volume levels suggest institutional interest is returning to the stock
Base Formation and Support Levels:
Base Structure:
- A clear double bottom pattern formed at approximately ₹350-380 levels
- The base formation period spans from mid-2025 to current levels
- This base represents a 5-7 month consolidation, allowing weak hands to exit and strong hands to accumulate
- The green box marked on the chart (₹300-350) represents the primary support zone
Key Support Levels:
- Immediate support: ₹380-400 (previous resistance turned support)
- Strong support: ₹350-365 (double bottom lows)
- Critical support: ₹300-320 (absolute base of consolidation)
- The 52-week low at ₹250.25 acts as a psychological support level
Support Significance:
- The ₹350-380 zone has been tested multiple times and held firm, indicating strong buying interest
- Volume accumulation in this zone suggests institutional accumulation
- Any pullback toward ₹380-400 would be a retest opportunity for the breakout
Resistance Levels:
Immediate Resistance Zones:
- First resistance: ₹450-460 (previous consolidation highs)
- Second resistance: ₹500-520 (psychological level and minor supply zone)
- Major resistance: ₹600-650 (significant supply zone from the downtrend)
- Ultimate resistance: ₹750-800 (prior distribution zone before major correction)
Resistance Analysis:
- The descending trendline, now broken, may act as dynamic support on pullbacks
- The ₹450 level represents a minor hurdle but has been approached multiple times recently
- Breaking above ₹500 would confirm the bullish structure and potentially trigger momentum buying
- The journey to ₹600+ would require sustained buying and improvement in business fundamentals
Technical Patterns:
- Double Bottom Pattern: Clearly visible at ₹350-380 levels with two distinct lows
- Descending Trendline Breakout: The cyan trendline connecting lower highs has been decisively broken
- Rounding Bottom Formation: The overall structure from the peak shows a gradual rounding bottom (Not a Textbook Kind)
- Higher Low Pattern: Recent price action shows formation of higher lows post-breakout (on Lower TF)
Pattern Implications:
- Double bottom patterns typically indicate trend reversal
- The trendline breakout adds conviction to the bullish thesis
- Continuation patterns forming above ₹400 would strengthen the uptrend structure
Risk Considerations:
- Failure to hold above the descending trendline (now support at ₹400-410) would negate the bullish setup
- A break below ₹380 would signal renewed weakness
- The stock must close above ₹450 on good volume to confirm the breakout
Sectoral Backdrop - Indian IT Services Industry:
Current Industry Landscape:
- The Indian IT sector is navigating a challenging demand environment with 77% of providers expecting higher business growth in FY26 compared to last year, driven by growing foundational digital scope, emerging markets, and strategic AI-led demand
- IT exports are expected to cross the $200 billion mark, growing 4.6% year-over-year to reach $224 billion in FY25
- The sector faces uncertainty due to global macroeconomic conditions, with clients delaying discretionary technology spending
- However, IT spending in India is expected to rise 11.1% year-on-year to $161.5 billion in 2025
Emerging Trends and Opportunities:
- AI and digital transformation continue to be major growth drivers across the industry
- Overall IT hiring grew 16% year-over-year in April 2025, driven by AI adoption, cloud modernization, and rapid expansion of Global Capability Centres
- Non-metro cities like Udaipur, Vizag, Coimbatore, and Nagpur are experiencing over 50% IT hiring growth
- Mid-tier IT companies have shown better agility in navigating uncertain macroeconomic conditions compared to larger counterparts
Sector Challenges:
- The sector faces its eighth consecutive quarter of single-digit revenue growth, with weak client spending and reduced digital transformation budgets as main culprits
- Rising H-1B visa fees and Trump tariffs are creating indirect headwinds for the industry
- Life sciences and manufacturing verticals are experiencing softness
- Margin pressures from rising wages, talent shortages, and shift to more onsite work models
Fundamental Backdrop:
Business Overview:
- Birlasoft Limited provides cloud, artificial intelligence (AI), and digital technologies, combining domain expertise with enterprise solutions across banking, financial services, insurance, life sciences, energy resources, utilities, and manufacturing verticals
- The company offers services in customer experience, data analytics, connected products, intelligent automation, blockchain, and generative AI
- In fiscal year 2025, the company achieved consolidated revenue of ₹53,752 million, with the Americas contributing 86.5% of total revenue
- Part of the CK Birla Group, bringing strong promoter backing and group pedigree
Recent Financial Performance:
- Q2 FY25 revenue was $163.3 million, showing 3.1% sequential growth in rupee terms and 2.6% in dollar terms, with year-over-year growth of 4.5%
- Q3 FY25 revenue reached ₹1,383.48 crore, up 0.9% year-over-year but down 1.29% quarter-over-quarter
- EBITDA margin dropped to 12.1% in Q2 FY25 from 14.7% in the previous quarter, partly due to pricing flexibility and increased on-site work
- Net profit was ₹116.10 crore in Q2 FY26, down 8.95% year-over-year but showing 9.09% sequential growth
Operational Highlights:
- The company delivered approximately $300 million in deal signings in the first half of FY25, though lower than the previous year
- Cash and bank balance stood at $221.8 million with operating cash flow of $12.9 million
- Days sales outstanding (DSO) at 58 days remains among the best in the industry
- Workforce strength of approximately 12,500+ professionals with attrition improving to around 11.8%
Key Challenges:
- Life sciences vertical has been underperforming and is expected to remain soft for a couple more quarters
- Manufacturing vertical, the company's largest, experienced project closures and ramp-downs
- Shift in revenue mix toward 51% onsite work has pressured margins
- Customer decision-making delays have affected deal flow and total contract value performance
Positive Catalysts:
- Three of four verticals (BFSI, Life Sciences & Services, Energy & Utilities) delivered sequential growth in Q2
- Management indicates improving pipeline with expectations of better deal flow in H2
- Recent AWS competency achievements in Manufacturing and Industrial Consulting enhance credibility
- CEO Angan Guha's reappointment for another two-year term provides leadership continuity
- Weak rupee environment provides tailwinds for export-oriented revenue
- Focus on improving operational efficiency and margin expansion through offshore shift
Valuation Context:
- Market capitalization stands at approximately ₹10,816 crore
- The stock has corrected significantly from highs, potentially offering better risk-reward at current levels
- P/E multiple compression during the correction phase may present opportunity if earnings stabilize
Overall Technical Assessment:
- The stock has completed a multi-month base formation and broken above a critical descending trendline
- Volume confirmation on the breakout adds credibility to the move
- The double bottom pattern at ₹350-380 provides a well-defined risk level for traders
- Risk-reward ratio favors bulls with clear support and resistance levels
Bull Case:
- A decisive close above ₹500 would open doors for ₹600+ levels
- Improving business fundamentals and sectoral recovery would support the technical breakout
Bear Case:
- Failure to hold the breakout level (₹400-410) would indicate a false breakout
- A breach below ₹380 would negate the bullish setup and potentially retest the ₹350 base
- Weak quarterly results or deteriorating sector conditions could trigger profit booking
My 2 Cents:
NSE:BSOFT presents an interesting technical setup after a prolonged correction. The completion of a double bottom base formation, coupled with a descending trendline breakout on good volume, suggests the worst may be behind for the stock. While fundamental challenges persist in the form of muted demand environment and margin pressures, the company's focus on operational efficiency, improving deal pipeline, and sector positioning in high-growth areas like AI and cloud provide reasons for optimism.
The technical structure suggests that patient accumulation in the current range with strict risk management could be rewarded if the company executes on its operational plans and the broader IT sector demand improves. However, investors should remain cognizant of the challenging macroeconomic backdrop and monitor quarterly results closely for signs of sustainable business improvement.
The confluence of technical breakout and improving operational metrics makes Birlasoft a stock worth watching for both tactical trades and strategic accumulation, provided risk management principles are strictly followed.
Full Coverage on my Newsletter this Week
Keep in the Watchlist and DOYR.
NO RECO. For Buy/Sell.
📌Thank you for exploring my idea! I hope you found it valuable.
🙏FOLLOW for more
👍BOOST if you found it useful.
✍️COMMENT below with your views.
Meanwhile, check out my other stock ideas on the right side until this trade is activated. I would love your feedback.
As per the Latest SEBI Mandate, this isn't a Trading/Investment RECOMMENDATION nor for Educational Purposes; it is just for Informational purposes only. The chart data used is 3 Months old, as Showing Live Chart Data is not allowed according to the New SEBI Mandate.
Disclaimer: "I am not a SEBI REGISTERED RESEARCH ANALYST AND INVESTMENT ADVISER."
This analysis is intended solely for informational purposes and should not be interpreted as financial advice. It is advisable to consult a qualified financial advisor or conduct thorough research before making investment decisions.
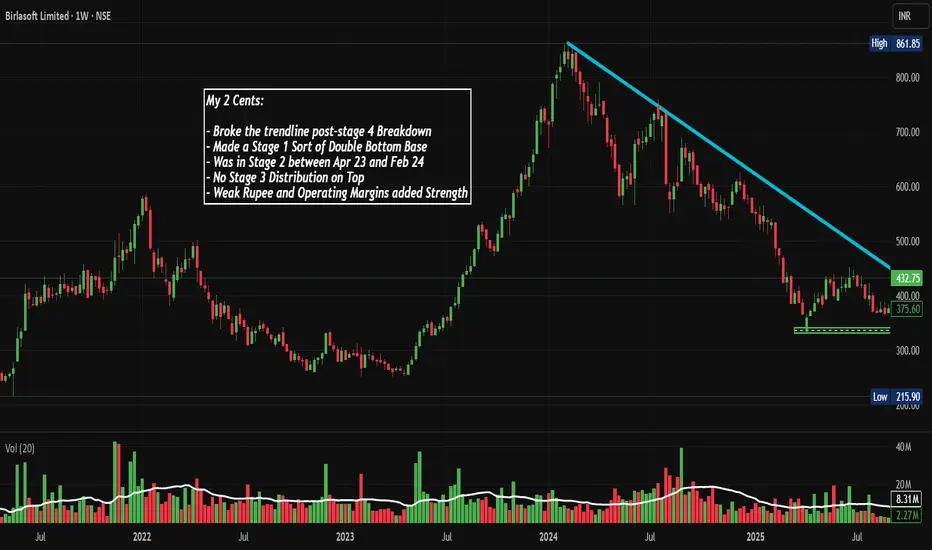
PGIL: Dual Flags and Asce. Triangle Breakout, Chart of the MonthFrom Dual Flags to Triangle Breakouts: How NSE:PGIL Spun a 10x Return Story While Tackling Global Tariff Headwinds and Posting Strong Q2 FY26 Numbers. Lets Analyse in Chart of the Month.
As per the Latest SEBI Mandate, this isn't a Trading/Investment RECOMMENDATION nor for Educational Purposes; it is just for Informational purposes only. The chart data used is 3 Months old, as Showing Live Chart Data is not allowed according to the New SEBI Mandate.
Disclaimer: "I am not a SEBI REGISTERED RESEARCH ANALYST AND INVESTMENT ADVISER."
This analysis is intended solely for informational purposes and should not be interpreted as financial advice. It is advisable to consult a qualified financial advisor or conduct thorough research before making investment decisions.
Price Action Analysis:
Long-Term Trend Structure (2022-2025):
- The stock has demonstrated a phenomenal structural uptrend from its base near Rs 142 in early 2022, currently trading at Rs 1,688.70 (as of Nov 29, 2025)
- This represents an impressive gain of approximately 1,090% from its low, showcasing one of the most powerful trends in the apparel sector
- The weekly chart shows a consistent pattern of higher highs and higher lows, indicating strong bullish conviction and accumulation throughout the multi-year uptrend
Base Formation & Consolidation Zones:
- Primary Base (2022-2023): Stock formed a strong accumulation base between Rs 142-200 for nearly 12 months, which provided the launching pad for the subsequent rally
- First Consolidation Zone (Mid-2024): After the initial rally to around Rs 800, the stock consolidated between Rs 600-800 for approximately 5-6 months, forming Flag Pattern 1
- Second Consolidation Zone (2025): Following the breakout above Rs 1,000, another consolidation formed between Rs 1,200-1,600, creating Flag Pattern 2
Key Technical Patterns Identified:
Ascending Triangle Breakout (Current):
- The most recent pattern visible on the weekly chart is a well-defined ascending triangle with a flat resistance at Rs 1,600 and rising support trendline
- The breakout occurred with substantial volume above Rs 1,600, confirming the pattern's validity
- The breakout candle shows strong momentum with a nearly 20% move to Rs 1,688.70
Dual Bull Flag Patterns:
- Flag 1 (Mid-2024): The first consolidation after the initial rally formed a classic bull flag, which broke out strongly with volumes
- Flag 2 (Early-Mid 2025): Second flag pattern formed after another leg up, again breaking out with conviction
- Both flags demonstrated textbook continuation patterns, indicating strong underlying trend
Higher Lows Pattern:
- Throughout the entire uptrend from 2022, the stock has maintained a pristine pattern of higher swing lows
- Each pullback has been bought aggressively, indicating strong institutional accumulation
- The ascending trendline connecting these lows (cyan line on chart) has acted as dynamic support multiple times
Current Price Action Characteristics:
- Stock closed at Rs 1,688.70 on Nov 29, 2025, down Rs 53.30 (-3.06%) but still near its 52-week high of Rs 1,993.30
- The recent correction from the high represents a healthy pullback of approximately 15%, which is normal after such a massive rally
- Price is currently testing the upper boundary of the ascending triangle, which could now act as support
- The stock has shown tendency to gap up on positive news, indicating strong institutional interest
Volume Spread Analysis:
Volume Characteristics During Key Phases:
Accumulation Phase (2022-Early 2023):
- Average volumes during base formation were around 100K-200K shares
- Volume picked up noticeably during breakout attempts, showing institutional interest
Breakout Phases:
- Flag 1 Breakout: Volume spiked to approximately 300K+ during the breakout
- Flag 2 Breakout: Even higher volume expansion to 400K+ confirmed the breakout
- Ascending Triangle Breakout: Massive volume spike to 870.68K (current volume), the highest seen on the chart
Volume-Price Relationship:
- Classic volume expansion on price advances and contraction during pullbacks, confirming healthy trend
- The recent volume spike of 870.68K represents approximately 4-5x the average daily volume, indicating strong institutional participation
- Volume spikes have consistently occurred at breakout points, validating the technical patterns
- Current volume profile suggests continued institutional accumulation at higher levels
Volume Analysis of Recent Rally:
- The breakout above Rs 1,600 came with exceptional volume (870.68K), suggesting conviction behind the move
- Even during minor pullbacks, volume has remained above average, indicating that dips are being bought
- The volume signature suggests this is not a retail-driven rally but has strong institutional backing
Key Support and Resistance Levels:
Historical Support Zones:
- Primary Base Support: Rs 142-200 (2022 lows) - This is the ultimate support if the entire uptrend were to reverse
- First Major Support: Rs 600-700 zone - This was the previous consolidation area and breakout base
- Second Major Support: Rs 1,000-1,200 - Previous resistance turned support after Flag 2 breakout
- Immediate Support: Rs 1,400-1,500 - Lower boundary of the ascending triangle and recent consolidation
Dynamic Support:
- Ascending Trendline Support (Cyan Line): Currently around Rs 1,200-1,300 level
- This trendline has been respected multiple times since 2022 and represents the spine of the uptrend
Resistance Levels:
- Immediate Resistance: Rs 1,700-1,750 - Recent high zone before pullback
- Major Resistance: Rs 1,993.30 - 52-week high and all-time high
- Psychological Resistance: Rs 2,000 - Round number resistance
Key Price Zones to Watch:
Critical Zone Rs 1,400-1,600:
- This is the most critical support zone as it represents the breakout level from the ascending triangle
- A sustained break below Rs 1,400 would negate the current bullish setup
- As long as the stock holds above Rs 1,500, the structure remains intact
Breakout Zone Rs 1,600-1,700:
- This was the apex of the ascending triangle
- Now acts as a pivot zone - support on the way up, resistance on any further dips
Technical Pattern Analysis:
Ascending Triangle Pattern (Most Recent):
Pattern Characteristics:
- Formed over 6-7 months from mid-2024 to late 2025
- Flat top at Rs 1,600 and ascending bottom trendline
- Minimum of 3 touches on the flat resistance and 2 touches on the ascending support
- Breakout confirmed with massive volume spike
Bull Flag Patterns:
Flag 1 (Mid-2024):
- Pole: Vertical rally from Rs 400 to Rs 800 (100% gain)
- Flag: Consolidation between Rs 600-800 for 4-5 months
- Breakout: Strong move above Rs 800 with volume
- Target achievement: Target of Rs 1,000+ was achieved
Flag 2 (Early 2025):
- Pole: Rally from Rs 800 to Rs 1,200 (50% gain)
- Flag: Tight consolidation between Rs 1,100-1,300
- Breakout: Decisive move above Rs 1,300
- Target achievement: Target of Rs 1,500-1,600 was achieved
Higher Lows Progression:
- Each swing low since 2022 has been progressively higher, indicating sustained demand
- The lows have occurred at: ~Rs 150 (2022), ~Rs 400 (2023), ~Rs 650 (2024), ~Rs 1,200 (2025)
- This creates a powerful ascending trendline that has defined the entire bull market
- The consistency of this pattern suggests strong hands are accumulating on every dip
Continuation Pattern Sequence:
- The chart displays a textbook example of a trending market with continuation patterns
- Pattern sequence: Base → Rally → Flag 1 → Rally → Flag 2 → Rally → Triangle → Breakout
- Each consolidation has been briefer than the previous one, indicating acceleration of the trend
- The pattern suggests the stock is in a mature but still healthy uptrend
Technical Indicators & Market Context:
Trend Strength Assessment:
- The multi-year trend structure is exceptionally strong with clean, well-defined patterns
- The stock has demonstrated the ability to digest gains through healthy consolidations rather than sharp corrections
- The ascending trendline has not been violated once in nearly 3 years, showing remarkable consistency
- Momentum appears to be building rather than waning, as evidenced by the most recent volume spike
Stage of Trend Analysis:
Based on the Stan Weinstein Stage Analysis:
- The stock appears to be in Stage 2 (Advancing Phase) of the market cycle
- It has completed approximately 3-4 years of Stage 2, which can last 5-7 years in strong bull markets
- The pattern of consolidation and continuation suggests the trend is mature but not exhausted
- No signs of Stage 3 (Top Formation) yet, as there are no lower highs or distribution patterns
Sectoral Backdrop:
Indian Textile & Apparel Industry Overview:
Market Size and Growth:
- The domestic textile and apparel market is valued at $225 billion in 2025 and is growing at 10-12% CAGR
- The Indian textile and apparel market reached $222.08 billion in 2024 and is expected to reach $646.96 billion with a CAGR of 11.98% during 2025-2033
- The textile industry employs over 45 million people and produces approximately 22,000 million pieces of garments annually
Export Strength:
- India's textile exports currently stand at $35.14 billion with a target of reaching $100 billion by 2030
- In FY26 (April-June 2025), total exports of textiles and apparels stood at $9.40 billion, with Ready Made Garments having the largest share at 45%
- India ranks among the top five global exporters in several textile categories
Government Support & Policy Framework:
Key Initiatives:
- The government launched the PM MITRA Park Scheme with an outlay of Rs 4,445 crore to create integrated textiles value chain from spinning to manufacturing at a single location
- Union Budget 2025-26 increased allocation to the Textile Ministry from Rs 4,417.03 crore in 2024-25 to Rs 5,272 crore, registering a 19% increase
- Production-Linked Incentive (PLI) Scheme for promoting MMF fabrics and technical textiles
- A five-year Cotton Mission launched with an allocation of Rs 600 crore aimed at revitalizing India's cotton sector
Infrastructure Development:
- Government plans to set up 12 new industrial parks and 5-6 mega textile parks
- 276 operational Special Economic Zones (SEZs) across various textile sectors as of March 2025
- Technology Upgradation Fund Scheme (TUFS) providing financial assistance for modernization
Industry Trends & Opportunities:
Technological Advancement:
- Manufacturers are turning to automation, AI and IoT-connected machinery, and digital fabric printing to increase production
- Digital textile printing is growing over 10% annually, driven by e-commerce and fast fashion
- Smart textiles and technical textiles emerging as high-growth segments
E-commerce Boom:
- The e-commerce industry in India is estimated to reach close to $160 billion in 2025, with apparel/textiles constituting a large part
- Online platforms have opened market access for traditional textile players and D2C brands
- E-commerce has backed unique segments like athleisure, fusion wear, and sustainable fashion
Sustainability Focus:
- Growing demand for eco-friendly and sustainable textiles
- Adoption of organic cotton, recycled materials, and eco-friendly manufacturing processes
- Consumers increasingly conscious of environmental impact of textile production
Global Supply Chain Dynamics:
China+1 Strategy:
- Buyers are seeking alternatives to China and Bangladesh through changes in global supply chains
- Trade agreements like India-UK FTA opening new opportunities
- India positioned to capture increased global apparel sourcing demand
Market Diversification:
- Reduced dependence on single markets
- Growing demand from US, UK, Europe, Japan, and Australia
- Expansion opportunities in emerging markets
Fundamental Backdrop:
Business Overview:
Core Business:
- Pearl Global Industries is engaged in manufacturing, sourcing, distribution, and export of ready-to-wear apparel through domestic and global facilities
- The company provides end-to-end supply chain solutions to brands across the globe
- Product range includes tops, shirts, dresses, sleepwear, hoodies, activewear, athleisure, children's wear, workwear, and denim apparels
Global Manufacturing Footprint:
- Geographical segments include Bangladesh, Hong Kong, India, Vietnam, and Others
- The company is one of India's largest listed garment exporters, manufacturing from multiple sourcing regions: South Asia (India, Bangladesh), South-East Asia (Vietnam, Indonesia) and Central America (Guatemala)
- 25 manufacturing units with total annual production capacity of 93.2 million pieces
Key Clientele:
- Global clientele includes Chicos, Kohls, Muji, Old Navy, Poligono, Primark, PVH, Ralph Lauren, Target and other marquee names
- Serving global brands such as Gap, Zara, Muji and Ralph Lauren
Recent Financial Performance (Q2 FY26):
Revenue Growth:
- In Q2 FY26, the company reported revenue of Rs 1,313 crore, up 9.2% YoY
- In H1 FY26, revenue reached Rs 2,541 crore, marking a 12.7% YoY growth
- Revenue growth driven by high value-added product sales in Vietnam and Indonesia
Profitability Metrics:
- Adjusted EBITDA (excluding ESOP expenses) stood at Rs 122 crore, a 23.6% YoY rise in Q2 FY26
- EBITDA margin increased by 108 bps to 9.3%
- Excluding tariff costs/losses at Guatemala and Bihar, the EBITDA margin was 10.1%
- PAT increased 29.4% YoY to Rs 72 crore in Q2 FY26
Half-Year Performance:
- Adjusted EBITDA rose 18.4% YoY to Rs 236 crore in H1 FY26
- Profit After Tax grew 17% YoY to Rs 138 crore in H1 FY26
Operational Highlights:
Production Volumes:
- The company shipped 19.9 million pieces in Q2 FY26, its highest-ever Q2 shipment volume, up from 19.3 million pieces in Q2 FY25
- Current capacity at 93.6 million pieces annually with plans to exceed 100 million pieces by mid-FY27
Financial Strength:
- Cash and bank balance (excluding cash earmarked for LC payments) stood at Rs 416 crore, with an additional Rs 128 crore in mutual funds, totaling Rs 544 crore as on September 30, 2025
- Networth as on September 30, 2025 stood at Rs 1,271 crore compared to Rs 1,146 crore as on March 31, 2025
- Working capital days at 33 days, indicating efficient operations
- ROCE improved by 375 bps to 29% in H1 FY26
Shareholder Returns:
- Board declared first interim dividend of Rs 6 per equity share with a face value of Rs 5 each for FY26, representing a 20% payout ratio
Strategic Initiatives & Growth Drivers:
Geographical Diversification:
- The US now contributes approximately 50% of group revenue, down from 86% in FY21, reflecting a successful geographical diversification strategy
- The company has ramped up investments in India and Bangladesh and is executing a Rs 250-crore capex plan
- Investing Rs 250 crore in capacity expansion and sustainability initiatives across India and Bangladesh
Capacity Expansion:
- Plans include addition of up to 6 million pieces in Bangladesh and 3 million pieces in India
- Targeting additional capacity of 5-6 million pieces to drive efficiency improvements
Sustainability Leadership:
- The adoption of eFlow Nanobubble technology in Bangladesh has enabled a 32% reduction in water use, a 9% decrease in power consumption, and a 20% improvement in production time efficiency
- Focus on eco-friendly manufacturing and sustainable practices
Challenges & Risk Factors:
US Tariff Impact:
- The company is navigating trade complexities, including 50% US tariff on India
- US customers are asking for a 14-15% discount to mitigate the 25% penalty tariff
- Management stated they negotiate based on services provided and for some large customers are not giving any discounts
Volume Growth Moderation:
- Volume growth was moderate at 3% for H1 FY26, compared to 30% last year, partly due to macroeconomic factors and tariff impacts
New Facility Ramp-up:
- Tariff costs and losses from new facilities in Guatemala and Bihar impacting margins
- These are expected to normalize as facilities reach full capacity
Management Outlook & Guidance:
Management Commentary:
- Management expects normalization in US tariff situation in coming quarters and remains confident in ability to adapt swiftly to changing requirements
- With diversified customer base across US, UK, Japan and Australia, and ongoing discussions on new FTAs, company remains well positioned to capture increased demand
Growth Strategy:
- The company aims to diversify market base and is targeting Rs 6,000 crores revenue by 2028
- Focus on markets like Australia, Japan, and Europe
- Continuing to push where sustainable opportunities are seen
Operational Excellence:
- Growth led by sustained momentum in Vietnam and Indonesia, which delivered double-digit volume expansion
- Multi-hub production capabilities balancing scale with agility
Institutional Interest:
- Institutional holdings stand at 20.52%, reflecting confidence from investors with substantial analytical resources
- Stake has seen a slight increase, suggesting favorable outlook on company's fundamentals
Competitive Positioning:
Industry Standing:
- One of India's largest listed garment exporters
- Return on Capital Employed (ROCE) of 15.87% in recent quarters, indicating effective utilization of capital
- Strong relationships with marquee global brands providing stability
Differentiators:
- Multi-country manufacturing model providing flexibility
- End-to-end supply chain solutions
- Focus on value-added products and higher realizations
- Strong emphasis on sustainability and innovation
My 2 Cents:
Overall Technical Assessment:
Trend Status: BULLISH
- All major trend indicators point to a sustained uptrend
- Higher highs and higher lows pattern intact
- Multiple continuation patterns successfully completed
- No signs of trend exhaustion or distribution
Pattern Reliability: HIGH
- Clean, textbook patterns with volume confirmation
- Each pattern target achieved before next formation
- Consistency in pattern execution over 3 years
Current Phase: POST-BREAKOUT CONSOLIDATION
- Stock has broken out from ascending triangle
- Currently consolidating gains near all-time highs
Risk Factors to Monitor:
Technical Risks:
- Break below Rs 1,400 would signal trend weakening
- Sustained trading below ascending trendline (Rs 1,200-1,300) would be concerning
- Formation of lower high below Rs 1,900 would indicate potential trend change
- Excessive volume on down days compared to up days
Fundamental Risks:
- Escalation of US-India tariff tensions
- Significant margin compression due to competitive pressures
- Loss of major clients or market share
- Adverse changes in global trade policies
- Sharp appreciation of Indian Rupee affecting export competitiveness
Sector Risks:
- Global economic slowdown reducing apparel demand
- Competition from Bangladesh, Vietnam intensifying
- Raw material cost inflation impacting margins
- Disruptions in global supply chains
Rationale:
- Strong technical structure with multiple confirmed patterns
- Robust fundamental performance with consistent growth
- Well-positioned to benefit from sector tailwinds
- Successful geographical diversification strategy
- Strong balance sheet and cash generation
Avoid:
- Panic selling on minor dips if fundamentals remain intact
- Over-leverage given the stock's volatility
- Ignoring stop losses in case of trend reversal
- Chasing the stock at all-time highs without confirmation
Full Coverage on my Newsletter this Week
Keep in the Watchlist and DOYR.
NO RECO. For Buy/Sell.
📌Thank you for exploring my idea! I hope you found it valuable.
🙏FOLLOW for more
👍BOOST if you found it useful.
✍️COMMENT below with your views.
Meanwhile, check out my other stock ideas on the right side until this trade is activated. I would love your feedback.
As per the Latest SEBI Mandate, this isn't a Trading/Investment RECOMMENDATION nor for Educational Purposes; it is just for Informational purposes only. The chart data used is 3 Months old, as Showing Live Chart Data is not allowed according to the New SEBI Mandate.
Disclaimer: "I am not a SEBI REGISTERED RESEARCH ANALYST AND INVESTMENT ADVISER."
This analysis is intended solely for informational purposes and should not be interpreted as financial advice. It is advisable to consult a qualified financial advisor or conduct thorough research before making investment decisions.
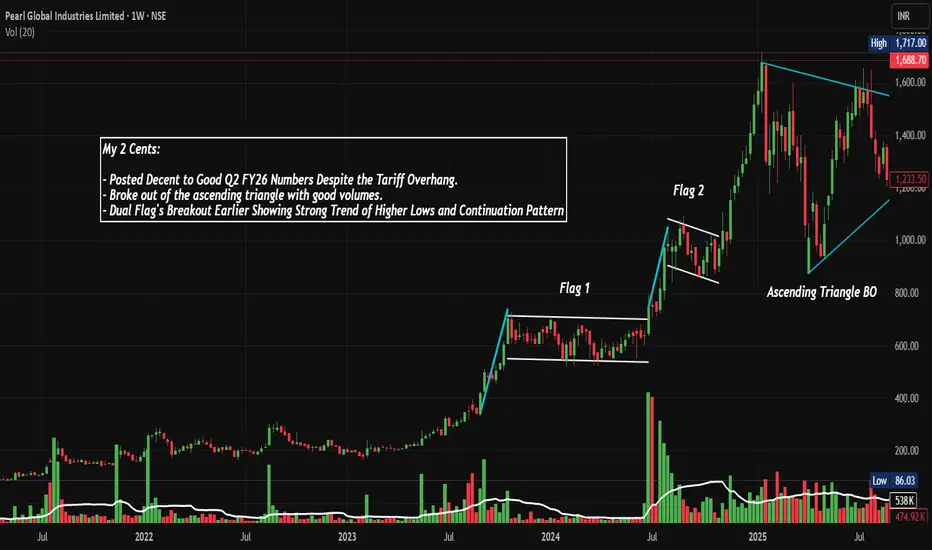
AVANTIFEED: Breaking out of Sym. Triangle, Chart of the WeekNSE:AVANTIFEED Breaking the Triangle: How Avanti Feeds is Positioned to Ride the Shrimp Export Wave Despite US Tariff Headwinds after Posting Strong Q2 FY26 Numbers. Lets Analyse in Chart of the Week.
As per the Latest SEBI Mandate, this isn't a Trading/Investment RECOMMENDATION nor for Educational Purposes; it is just for Informational purposes only. The chart data used is 3 Months old, as Showing Live Chart Data is not allowed according to the New SEBI Mandate.
Disclaimer: "I am not a SEBI REGISTERED RESEARCH ANALYST AND INVESTMENT ADVISER."
This analysis is intended solely for informational purposes and should not be interpreted as financial advice. It is advisable to consult a qualified financial advisor or conduct thorough research before making investment decisions.
Price Action Analysis:
Historical Price Journey:
- 2021-2022: Strong rally from 360 levels to 750 zone
- 2023: Consolidation and correction to 350-400 range
- 2024: Strong recovery rally pushing to new all-time highs near 964.20
- 2025: Symmetrical triangle consolidation followed by recent breakout
Current Price Behavior:
- Recent breakout candle shows strong buying with minimal upper wick
- Trading at 861.20 with +14.51% gain indicates momentum strength
- Price approaching previous resistance zones that could act as supply
Volume Spread Analysis:
Volume Characteristics:
- Recent breakout accompanied by 9x surge in volumes (19.86M vs average)
- Volume expansion during rally phases from 2023-2024 shows institutional accumulation
- Volume spikes at key support levels during consolidation indicate buying interest
- Current volume profile suggests smart money participation
Volume-Price Correlation:
- Strong positive correlation during uptrends (2023-2024 rally)
- Declining volume during consolidation phase typical of healthy correction
- Recent volume breakout confirms bullish sentiment reversal
Symmetrical Triangle Formation (2024-2025):
- The stock has been consolidating in a clear symmetrical triangle pattern since reaching its 52 Week high of 964.20 in early 2025
- Lower highs connecting from 964.20 level and higher lows forming from 630.00 support zone
- Triangle apex converging near current price levels, indicating an imminent breakout
- Pattern duration: approximately 12 months, suggesting significance of upcoming move
- Recent price action shows a breakout attempt with strong volume support
Broke Symmetrical Triangle with Strong Volumes:
- Current price at 861.20 (as of November 21, 2025) shows +14.51% gain with volume surge to 3.9M shares
- Volume expansion at 19.86M significantly exceeds average, validating breakout
- The breakout has occurred with conviction, supported by high trading activity
Key Technical Levels:
Support Zones:
- Primary Support: 680.00 - 700.00 (recent consolidation base)
- Secondary Support: 630.00 (lower triangle trendline)
- Critical Support: 570.00 (psychological and structural level)
- Ultimate Support: 470.00-510.00 (2024 demand zone)
Resistance Levels:
- Immediate Resistance: 860.00 (swing high zone)
- Major Resistance: 920.00 - 964.20 (all-time high region)
- If ATH breaks, next targets: 1,000.00 and 1,100.00
Base Formation:
- A strong base has been established between 630.00 to 760.00 through 2025
- Multiple retests of lower support levels throughout the year have strengthened the base
- Base duration of 10-12 months provides solid foundation for next leg up
Trend Analysis:
Long-term Trend (Weekly/Monthly):
- Primary uptrend intact despite year-long consolidation
- Price remains well above rising 200-week moving average
- Higher lows pattern from 2022 onwards indicates bullish structure
Medium-term Trend (Daily):
- Breaking out of consolidation range with strong momentum
- Upper triangle trendline resistance conquered
- Price action suggesting potential trend reversal from sideways to bullish
Short-term Momentum:
- Sharp upward move with strong candles indicating buying pressure
- Current momentum favors bulls with potential for continuation
Fundamental & Sectoral Backdrop:
Company Overview & Business Segments:
Core Business Operations:
- India's leading shrimp feed manufacturer with integrated operations
- Two primary divisions: Shrimp Feed Division and Shrimp Processing & Export Division
- Market capitalization: Rs 9,633 crores (approximately $1.15 billion)
- Strategic partnership with Thai Union Group (Thailand) - minority stake holder
Production Capacity & Scale:
- Annual shrimp feed manufacturing capacity: 775,000 metric tons (largest in India)
- Shrimp processing capacity: Producing 28,000 metric tons annually
- Multiple manufacturing facilities across coastal states
- Hatchery division with capacity of 600 million post-larvae
Recent Financial Performance:
Q2 FY26 Results (Quarter Ended September 2025):
- Consolidated Net Profit: Rs 153.29 crores (up 34.88% YoY, down 14.02% QoQ)
- Net Sales: Rs 1,609.69 crores (up 18.79% YoY, flat 0.21% QoQ)
- Operating Performance shows mixed signals with YoY growth but QoQ softness
- EPS: Rs 11.25 (vs Rs 8.34 in Q2 FY25)
H1 FY26 Performance (Six Months Ended September 2025):
- Total Income: Rs 3,316.11 crores (up 13.11% YoY)
- Net Profit: Rs 331.57 crores (up 37.09% YoY)
- EPS: Rs 24.34 (vs Rs 17.75 in H1 FY25)
- Strong first-half performance despite challenging conditions
Segment Performance Highlights:
- Shrimp Feed Division: Facing margin pressure from rising raw material costs (fishmeal, soybean meal)
- Shrimp Processing Division: 62% YoY growth in gross income for Q2 FY26, driven by diversification and favorable forex rates
- Profit Before Tax (PBT): Rs 227 crores in Q2, down 8.83% QoQ indicating margin compression
Key Financial Metrics & Valuation:
Profitability Ratios:
- Return on Equity (ROE): 18.88% - well above industry average
- Return on Capital Employed (ROCE): 65.44% - exceptional capital efficiency
- Operating Margin: Declining by 126 basis points QoQ in Q2 FY26
- Net Profit Margin: 10.5% (Q2 FY26)
Balance Sheet Strength:
- Debt-to-Equity Ratio: Negative -0.69 (debt-free, net cash position)
- Fortress balance sheet with zero debt burden
- Strong working capital position despite rising debtor turnover pressures
Valuation Metrics:
- Current P/E Ratio: 19x
- Price-to-Book Value: 3.90x (reasonable given high ROE)
- Dividend Yield: 1.05%
- Latest Dividend: Rs 9.00 per share (August 2025), payout ratio of 23.19%
Quality Indicators:
- Consistent dividend payer with conservative payout ratios
- High ROCE indicates superior capital allocation
- Zero leverage provides financial flexibility and risk cushion
Sectoral Landscape - Indian Aquaculture & Shrimp Industry:
Market Size & Growth Trajectory:
- Indian Shrimp Market: Valued at $9.2 billion in 2024, projected to reach $22.7 billion by 2033 (CAGR: 10.1%)
- Indian Shrimp Feed Market: $2.0 billion in 2024, expected to grow to $7.4 billion by 2033 (CAGR: 15.7%)
- India Aquafeed Market: $3.51 billion in 2024, projected at $6.40 billion by 2032 (CAGR: 7.8%)
- India ranks as second-largest shrimp producer and exporter globally after Ecuador
Production & Export Statistics:
- FY24 Seafood Exports: Rs 60,523.89 crores (1.78 million metric tons), up 2.67% in volume
- Frozen shrimp accounts for 66.12% of export earnings and 40.19% of export volume
- India shipped seafood worth approximately $7.4 billion last fiscal year
- Production volumes show resilience despite global headwinds
Key Export Markets (Traditional):
- United States: Largest market, historically accounting for 40-50% of exports
- China: Second-largest market with 451,000 MT ($1.38 billion)
- Japan: Third major destination
- Other significant markets: Vietnam, Thailand, EU (Belgium, Spain), Canada, UAE, Italy
Domestic Market Dynamics:
- 72.1% of Indian population (967 million individuals) include fish in their diet
- Growing domestic consumption driven by health awareness and rising incomes
- Shift toward value-added products (ready-to-cook, processed seafood)
Major Industry Challenges & Headwinds:
US Tariff Crisis:
- August 27, 2025: US imposed 50% reciprocal tariff on Indian shrimp imports (25% base + 25% penalty)
- Combined with existing duties: Anti-dumping (3.96%), Countervailing duty (5.77%)
- Total effective duty burden: 58.26% on Indian shrimp exports to US
- August 2025 impact: Indian shrimp exports to US collapsed 43% YoY to 16,495 MT
- Total Indian export volumes fell 9% YoY in August 2025
Cost Pressures:
- Rising raw material costs for feed production (fishmeal, soybean meal)
- Increasing labor and energy costs impacting margins
- Competition from Ecuador in US market, especially in headless shell-on segment
- Global oversupply situation causing price depression
Disease & Environmental Risks:
- Disease outbreaks remain persistent risk in aquaculture
- Climate change and water quality challenges
- Regulatory compliance and sustainability certification requirements
Emerging Opportunities & Positive Catalysts:
Posted Strong Q2FY26 Numbers Despite US Tariff:
- Despite 50% US tariff headwinds, company posted 34.88% YoY profit growth
- Revenue growth of 18.79% YoY demonstrates resilience
- Shrimp processing division grew 62% YoY, offsetting feed segment pressures
- Management successfully diversifying away from US market dependence
China Seafood Export Ban Can Benefit Indian Exporters:
- China banned all Japanese seafood imports (November 2025) amid diplomatic tensions
- This creates substantial market opportunity for Indian seafood exporters
- Indian companies can fill supply gap in massive Chinese market
- China already importing 12,190 MT from India in August 2025, up 33% YoY
- Market diversification reducing US dependency from 48% toward 30-35%
Government Support & Policy Initiatives:
- Union Budget 2025: Proposed 5% Basic Customs Duty on key feed production inputs (down from higher rates)
- Rs 4.5 lakh crore support package for export sectors including seafood
- Pradhan Mantri Matsya Sampada Yojana (PMMSY): Rs 2,352 crores allocated (56% increase)
- Department of Fisheries budget: Rs 2,616.44 crores (54% increase YoY)
- Government targeting $14 billion+ seafood exports by 2025
- Fishery Infrastructure Development Fund (FIDF) for modernization
Market Diversification Strategy:
- Companies actively expanding presence in EU, Middle East, Southeast Asia, Japan, South Korea
- Vietnam, Thailand, Canada becoming key alternative markets
- Development of value-added products commanding higher margins
- China emerging as third-largest market for Indian shrimp after US and Europe
Technology & Innovation Adoption:
- Advanced breeding techniques producing disease-resistant varieties
- Biofloc technology and Recirculating Aquaculture Systems (RAS) improving efficiency
- Precision feeding technologies enhancing feed conversion ratios
- Integration of probiotics and functional ingredients in feed formulations
- Cold chain infrastructure growing 15-30% annually
Product Portfolio Expansion:
- Avanti Feeds launched new pet food products receiving positive market acceptance
- Shift toward value-added products: cooked, breaded, marinated offerings
- Value-added exports up 27% year-to-date despite overall volume pressure
- Premium products targeting European and Asian markets
Structural Competitive Advantages:
- Zero-debt balance sheet provides flexibility during market disruptions
- Highest feed manufacturing capacity (775,000 MT) among Indian players
- Integrated operations from hatchery to processing create vertical synergies
- Strong R&D capabilities and partnerships (Thai Union Group)
- Established distribution networks and brand recognition
Ecuador Supply Disruptions:
- Ecuador facing energy rationing issues disrupting shrimp production
- May redirect global buyers toward Indian suppliers
- Potential to strengthen pricing power and market share gains
- Ecuador's challenges provide tactical advantage for Indian exporters
Sustainability Certifications & Premium Markets:
- Growing demand for certified sustainable seafood (BAP, ASC standards)
- Indian producers investing in traceability and quality systems
- Access to premium European markets requiring strict compliance
- Competitive advantage in environmentally-conscious consumer segments
Competitive Positioning:
Market Leadership:
- Avanti Feeds ranked #1 in Indian shrimp sector by production and revenue
- Feed manufacturing: 775,000 MT capacity (largest)
- Shrimp production: 28,000 MT annually
- Revenue: EUR 615 million (Rs 5,500+ crores) for FY 2022-23
Key Competitors:
- Devi Sea Foods: #2 ranked, EUR 391 million revenue, 52,000 MT shrimp production, 300,000 MT feed capacity
- Waterbase Limited: Major player with diversified operations
- Coastal Corporation: Expanding China presence, up 5% recently on China opportunity
- Apex Frozen Foods: Strong Q2 with positive earnings surprise
Industry Consolidation Trends:
- Top 19 players dominating production and processing
- Increasing entry of multinational companies through JVs
- Consolidation driven by scale requirements and technology investments
Risk Factors & Concerns:
Short-term Challenges:
- US tariff situation remains fluid; potential for escalation to full 50% or negotiation down to 15%
- Sequential margin compression (Q2 vs Q1) indicates near-term profitability pressure
- Raw material cost inflation continuing into FY26
- Working capital pressures with rising debtor turnover ratio
Medium-term Uncertainties:
- Global shrimp prices at lowest inflation-adjusted levels since 2020
- Industry growth stagnation: India's peak exports in 2021 (704,160 MT) not yet regained
- Competitive intensity from Ecuador, Vietnam, Thailand, Indonesia
- EU and other markets may also impose trade restrictions
Operational Risks:
- Disease outbreaks can rapidly impact production
- Water quality and environmental compliance requirements
- Climate-related risks (extreme weather, temperature variations)
- Forex volatility impacting export realizations
Strategic Concerns:
- Slower than expected market diversification progress
- Dependence on commodity shrimp prices
- Shift to Black Tiger (Monodon) from Vannamei faces adoption challenges
- Pet food venture in highly competitive market against established players like Mars
Bull Case Scenario:
Technical Setup:
- Clean breakout from year-long symmetrical triangle with high volume
- If momentum sustains, targets of 860, 920, and new highs above 1,000 are achievable
- Strong base formation provides downside support
Fundamental Strengths:
- China-Japan seafood ban creates immediate export opportunity
- Government support package and duty cuts improve cost structure
- Debt-free balance sheet provides safety margin
- Exceptional ROCE (65.44%) and ROE (18.88%) demonstrate operational excellence
- Valuation attractive at 16.26x P/E with 9.7% discount to industry
Growth Drivers:
- Shrimp feed market growing at 15.7% CAGR through 2033
- Market diversification reducing US exposure from 48% to 30-35%
- Value-added product strategy improving margins
- Capacity leadership position (775,000 MT feed) creates moat
Bear Case Scenario:
Technical Risks:
- Failure to hold above 700 support could trigger return to triangle
- Overhead resistance at 860-920 zone may cap upside
- Volume sustainability crucial; fading volumes could signal false breakout
Fundamental Concerns:
- Sequential profit decline (Q2 vs Q1) signals margin pressure
- US tariffs may worsen if no trade deal materialized
- Global shrimp prices at multi-year lows (inflation-adjusted)
- Raw material cost inflation squeezing feed margins
- Industry growth stagnation since 2021 peak
Structural Headwinds:
- Mature business with 5-year sales CAGR of only 7.5%
- Intense competition from Ecuador in key US market
- Working capital pressures building (deteriorating debtor turnover)
Key Monitorables:
Quarterly Metrics:
- Feed sales volumes and pricing trends
- Shrimp processing margins and export realizations
- Geographic revenue mix (US vs other markets)
- Raw material cost trends (fishmeal, soybean meal)
Market Developments:
- Progress on US-India trade negotiations (tariff reduction to 15%?)
- China market penetration success metrics
- Ecuador supply situation and competitive dynamics
- Government policy implementation and subsidy flows
Technical Levels:
- Sustenance above 700 crucial for bullish structure
- Volume patterns on approach to 860-920 resistance
- Any breakdown below 630 would be major warning sign
My 2 Cents:
The technical breakout from the symmetrical triangle, combined with the China-Japan seafood ban opportunity, creates an interesting risk-reward setup. The company has demonstrated resilience by posting strong YoY numbers despite the US tariff shock. However, the sequential margin compression and global shrimp price weakness remain concerns.
The debt-free balance sheet and exceptional capital efficiency metrics (65% ROCE) provide a strong safety cushion. Market diversification efforts are progressing, though slower than ideal. The 15.7% CAGR expected in the shrimp feed market through 2033 provides secular tailwinds.
From a technical perspective, the stock needs to sustain above 700 and break through 860 with volume to confirm the bullish breakout. The year-long consolidation provides a solid base, but overhead supply at 860-920 could test conviction.
So Avanti Feeds presents a compelling case of a fundamentally strong company navigating through short-term headwinds while benefiting from emerging opportunities. The technical breakout aligns with positive fundamental catalysts (China ban on Japan, government support), though execution challenges and margin pressures remain. The company's market leadership, zero-debt status, and superior returns metrics make it a quality play on India's growing aquaculture story.
Investors should monitor the sustainability of the technical breakout, progress on market diversification, and margin trajectory in coming quarters. The current setup offers an asymmetric opportunity with defined risk.
Full Coverage on my Newsletter this Week
Keep in the Watchlist and DOYR.
NO RECO. For Buy/Sell.
📌Thank you for exploring my idea! I hope you found it valuable.
🙏FOLLOW for more
👍BOOST if you found it useful.
✍️COMMENT below with your views.
Meanwhile, check out my other stock ideas on the right side until this trade is activated. I would love your feedback.
As per the Latest SEBI Mandate, this isn't a Trading/Investment RECOMMENDATION nor for Educational Purposes; it is just for Informational purposes only. The chart data used is 3 Months old, as Showing Live Chart Data is not allowed according to the New SEBI Mandate.
Disclaimer: "I am not a SEBI REGISTERED RESEARCH ANALYST AND INVESTMENT ADVISER."
This analysis is intended solely for informational purposes and should not be interpreted as financial advice. It is advisable to consult a qualified financial advisor or conduct thorough research before making investment decisions.
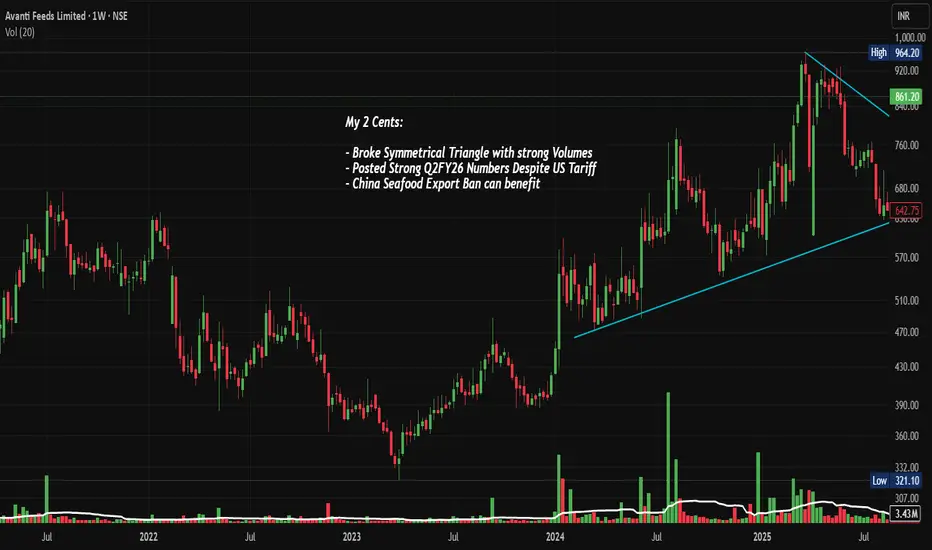
INDIGOPNTS: Trendline Breakout Post Q2FY26, Chart of the WeekWhy NSE:INDIGOPNTS Could Be Your Next Multi-Bagger: Breaking Out After a Brutal 60% Correction Post Good Q2 FY26 Numbers: Let's Analyze in Chart of The Week
As per the Latest SEBI Mandate, this isn't a Trading/Investment RECOMMENDATION nor for Educational Purposes; it is just for Informational purposes only. The chart data used is 3 Months old, as Showing Live Chart Data is not allowed according to the New SEBI Mandate.
Disclaimer: "I am not a SEBI REGISTERED RESEARCH ANALYST AND INVESTMENT ADVISER."
This analysis is intended solely for informational purposes and should not be interpreted as financial advice. It is advisable to consult a qualified financial advisor or conduct thorough research before making investment decisions.
Price Action Analysis:
Historical Price Movement:
- The stock experienced a steep downtrend from its all-time high of approximately ₹2,695 in early 2022, declining over 60% to a low of ₹910 by mid-2024
- A prolonged bear market spanning nearly two years created a massive consolidation zone between ₹1,000 and ₹1,600 during 2023-2024
- Recent price action shows a strong bullish candle in November 2024, breaking above the downward trendline with significant momentum
- The current price of ₹1,298.80 represents a sharp recovery from the lows, gaining approximately ₹294.70, or 29.35%, in the recent move
Trendline Analysis:
- A clear falling trendline (marked in cyan on the chart) connected the lower highs from the 2022 peak through mid-2024
- This trendline acted as dynamic resistance, rejecting multiple rally attempts throughout 2023 and early 2024
- The recent breakout above this multi-year trendline occurred with strong price and volume confirmation, suggesting a potential trend reversal
- The breakout candle shows conviction with a decisive close above the trendline resistance
Price Structure:
- The stock formed a descending triangle pattern from 2022 to 2024, with lower highs and relatively flat lows around ₹900-₹1,000
- Post-Q2FY26 results (released in early November 2024), the stock has shown explosive upside momentum
- The recent surge created a bullish engulfing pattern on the weekly timeframe, signaling strong buyer interest
Volume Spread Analysis:
Volume Trends:
- Volume during the downtrend was relatively subdued, indicating lack of aggressive selling pressure
- The recent breakout candle shows significantly elevated volume at 7.67 million shares, representing 587.73 thousand volume units
- This volume spike confirms genuine buying interest and institutional participation in the breakout
- Volume expansion during the rally validates the authenticity of the price move
Volume-Price Relationship:
- The correlation between rising prices and expanding volume suggests healthy accumulation
- Previous attempts to break the trendline failed due to insufficient volume support
- Current volume levels are approximately 3-4x the average, indicating strong conviction among market participants
Key Technical Levels:
Support Levels:
- Primary Support (S1): ₹1,200—This represents the previous resistance zone that should now act as support
- Secondary Support (S2): ₹1,100 - The breakout point from the falling trendline
- Major Support (S3): ₹1,000-₹1,006 - Strong psychological level and previous consolidation base
- Ultimate Support (S4): ₹910 - The 52-week low acts as the ultimate floor
Resistance Levels:
- Immediate Resistance (R1): ₹1,400 - Near-term psychological barrier
- Intermediate Resistance (R2): ₹1,600 - Previous consolidation zone highs from 2023-2024
- Major Resistance (R3): ₹1,800 - Key supply zone from the downtrend phase
- Long-term Resistance (R4): ₹2,200-₹2,400 - Retracement levels toward the all-time high
Base Formation:
- A solid base has been established between ₹900 and ₹900-₹1,100 over an extended 18-month period
- This accumulation zone represents significant institutional buying at lower levels
- The base demonstrates strong hands holding the stock, reducing downside volatility
- Multiple tests of the ₹900-₹1,000 zone without breaking down confirms strong demand
Technical Patterns:
Reversal Patterns:
- A falling wedge/descending triangle pattern formed from 2022 to 2024, which is typically a bullish reversal pattern
- The pattern shows lower highs with relatively consistent lows, indicating selling exhaustion
- A breakout from this multi-year pattern suggests a major trend change is underway
Candlestick Patterns:
- The recent weekly candle shows strong bullish characteristics with a large body and minimal upper shadow
- The candle closed near its high, indicating buyer dominance throughout the period
- Previous candles show a transition from consolidation to expansion phase
Fundamental Backdrop:
Company Overview:
- Indigo Paints is India's fourth-largest decorative paints company with strong brand recognition
- The company operates three manufacturing facilities located in Jodhpur, Kochi, and Pudukkottai
- Headquartered in Pune, Maharashtra, the company was founded in 2000 and listed on stock exchanges in 2021
- Known for innovative product launches and being first-to-market with several differentiated paint solutions
Recent Financial Performance:
- Q2FY26 revenue grew 3.45% year-on-year to ₹298 Cr., though net income grew 5.85% to ₹26 Cr, due to competitive pressures
- Gross margins expanded to 45.1% from 44.1% in the previous year, driven by softening raw material costs and premium product focus
- EBITDA margin improved to 15.3% from 14.8%, reflecting operational efficiency gains
- The company has expanded its dealer network to over 18,900 active dealers and more than 11,650 tinting machines
Growth Catalysts:
- Management expects double-digit volume growth by Q4FY25, supported by strong leading indicators like dealer fund inflows and painter token scanning
- Extended monsoon impacted August sales, but July and September showed robust growth momentum
- The company is focusing on premium product mix to defend margins against aggressive competition from new entrants
- Expansion into project sales and construction chemicals segments provides new revenue streams
Sectoral Outlook:
Indian Paint Industry Overview:
- The Indian paints and coatings market is estimated at USD 10.46 billion in 2025 and expected to reach USD 16.38 billion by 2030, growing at 9.38% CAGR
- Architectural applications account for 77.56% of market demand in 2024, driven by India's construction boom
- The decorative segment accounts for nearly 75% of total demand, with 80% coming from repainting activity
- Repainting cycles have shortened from 7-8 years to just 4-5 years, accelerating demand growth
Competitive Landscape:
- New players like Birla Opus, JSW Paints, and Pidilite have entered with aggressive strategies and significant capital expenditure
- Birla Opus alone plans to increase industry capacity by 40% over the next three years, aiming to become the second-largest manufacturer by 2025
- Revenue growth slowed to 4% in FY24 after 14-15% CAGR between FY19 and FY23 due to price cuts and competitive pressures
- Despite margin pressure, established players like Indigo maintain advantage through distribution networks and brand loyalty
Industry Drivers:
- Residential unit sales surged 30% year-on-year to 474,000 units in 2024, supported by PM Awas Yojana affordable housing scheme
- The government plans to construct 30 million affordable houses over the next five years through PM Awas Yojana
- Rising disposable incomes, urbanization, and lifestyle changes are compressing repaint intervals in major cities
- Infrastructure projects under Bharatmala and Sagarmala are driving demand for industrial and protective coatings
Bull Case:
- A technical breakout from multi-year falling trendline with strong volume confirmation suggests major trend reversal
- Established player with differentiated product portfolio and strong gross margins outperforming peers
- Sector tailwinds from government infrastructure push and housing demand provide multi-year growth runway
- Valuation correction of 60% from peak creates attractive entry point for long-term wealth creation
- Management's focus on premium products and margin expansion positions company well against competition
Bear Case:
- Intense competition from well-capitalized new entrants (JSW, Birla Opus) could pressure market share
- Slower-than-expected volume growth in Q2FY26 raises concerns about demand momentum
- Margins vulnerable to aggressive pricing by competitors offering trade discounts
- An elongated monsoon and macroeconomic uncertainties could impact near-term performance
- Stock has rallied sharply in short period, creating potential for profit-booking
Key Monitoring Points:
- Track quarterly volume growth trajectory to confirm management's guidance of double-digit growth by Q4
- Monitor gross margin trends to ensure premium strategy is working despite competitive intensity
- Watch dealer expansion metrics and market share data versus new entrants
- Observe raw material price trends, particularly crude-linked derivatives impacting costs
- Follow infrastructure spending and housing sales data as leading indicators for industry demand
My 2 Cents:
- The stock has decisively broken out from a multi-Week falling trendline resistance with exceptional volume support
- Multiple technical factors align favorably: pattern breakout, volume confirmation, base formation, and momentum shift
- Risk-reward ratio remains attractive even after the recent rally, particularly on any pullback to ₹1,200 levels
- The base formation between ₹900 and ₹900-₹1,100 provides strong downside support for long-term holders
- While near-term earnings growth is muted due to competition, the long-term sector outlook remains robust
- The company's focus on operational efficiency and margin expansion is yielding results despite challenges
NSE:INDIGOPNTS presents a compelling asymmetric risk-reward opportunity where the technical setup, fundamental improvement trajectory, and sectoral tailwinds are aligning after a prolonged correction. The breakout from a multi-year base with strong volume support provides a high-conviction entry point for wealth creation over the next 12-24 months.
Full Coverage on my Newsletter this Week
Keep in the Watchlist and DOYR.
NO RECO. For Buy/Sell.
📌Thank you for exploring my idea! I hope you found it valuable.
🙏FOLLOW for more
👍BOOST if you found it useful.
✍️COMMENT below with your views.
Meanwhile, check out my other stock ideas on the right side until this trade is activated. I would love your feedback.
As per the Latest SEBI Mandate, this isn't a Trading/Investment RECOMMENDATION nor for Educational Purposes; it is just for Informational purposes only. The chart data used is 3 Months old, as Showing Live Chart Data is not allowed according to the New SEBI Mandate.
Disclaimer: "I am not a SEBI REGISTERED RESEARCH ANALYST AND INVESTMENT ADVISER."
This analysis is intended solely for informational purposes and should not be interpreted as financial advice. It is advisable to consult a qualified financial advisor or conduct thorough research before making investment decisions.
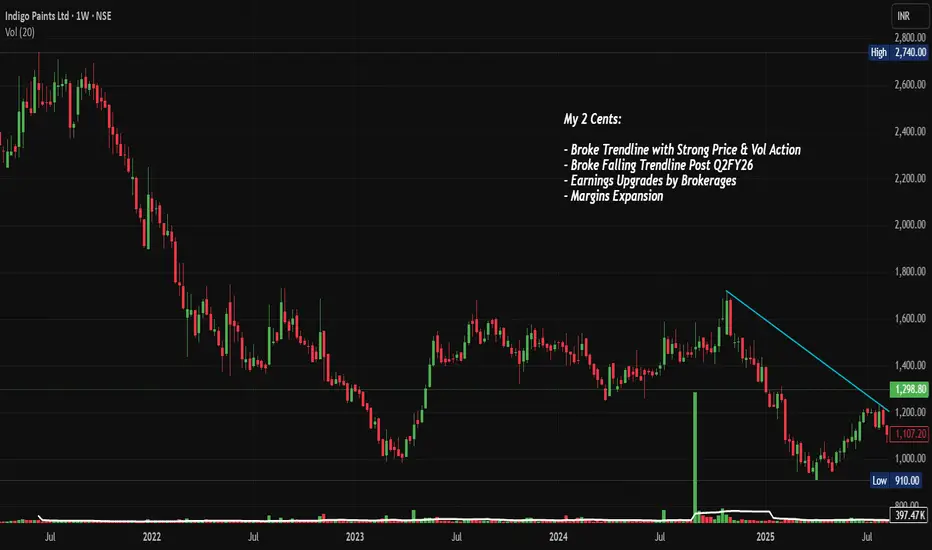
CCL: Post Q2FY26 Broke Flag Pattern on Weekly, Chart of the WeekThis Coffee Stock Just Broke Out With 80% Volume Surge - Should You Track CCL Products Above ₹1000? Post Strong Q2 FY26 Numbers, Let's Analyze in our Chart of the week below.
As per the Latest SEBI Mandate, this isn't a Trading/Investment RECOMMENDATION nor for Educational Purposes; it is just for Informational purposes only. The chart data used is 3 Months old, as Showing Live Chart Data is not allowed according to the New SEBI Mandate.
Disclaimer: "I am not a SEBI REGISTERED RESEARCH ANALYST AND INVESTMENT ADVISER."
This analysis is intended solely for informational purposes and should not be interpreted as financial advice. It is advisable to consult a qualified financial advisor or conduct thorough research before making investment decisions.
Price Action Analysis - Multi-Timeframe Perspective:
Long-Term Price Structure (2022-2025):
Phase 1: The Accumulation Zone (2022):
Base Building Period: January 2022 to July 2022
Price Range: ₹350-500 zone
Character: Sideways consolidation with multiple retests of ₹400 level
Volume Profile: Declining volume suggesting washing out of weak hands
Market Psychology: Post-pandemic recovery phase with sector uncertainty
Key Observation: Formation of a strong demand zone between ₹380-420 that acted as launchpad
Phase 2: The Initial Markup (Late 2022 - Mid 2023):
Duration: August 2022 to June 2023
Price Movement: ₹450 to ₹700 (55% rally)
Character: Steady, systematic rise with higher highs and higher lows
Pullback Behavior: Shallow retracements of 8-12%, indicating strong underlying demand
Volume Pattern: Gradual volume expansion on up-moves, contraction on pullbacks
Breakout Moment: Cleared ₹600 psychological barrier in April 2023 with authority
Key Observation: Classic stage 2 uptrend with disciplined profit-taking zones
Phase 3: The Distribution and Correction (Mid 2023 - Early 2024):
Duration: July 2023 to March 2024
Peak Price: ₹720-730 zone
Correction Depth: Fell to ₹550 (24% decline)
Character: Sharp vertical rise followed by sideways-to-down correction
Volume Profile: High volume selling near peaks, panic selling at lows
Market Context: Broader market correction, FMCG sector underperformance
Key Observation: The stock failed to sustain momentum above ₹700, creating a resistance zone
Phase 4: The Recovery and Retest (Q2-Q3 2024):
Duration: April 2024 to September 2024
Price Movement: ₹550 to ₹900 (64% recovery rally)
Character: V-shaped recovery with strong momentum
Resistance Encounter: Multiple attempts to cross ₹800-850 zone failed
Volume Profile: Increasing volume on rallies but selling pressure near ₹800
Key Observation: Stock was building energy for next major move, testing resolve of bulls
Phase 5: The Consolidation (Q4 2024 - October 2025):
Duration: October 2024 to October 2025
Price Range: ₹750-900 (tight 20% range)
Character: Sideways consolidation forming a rectangular base/flag pattern
Lower Boundary: ₹750-780 (tested multiple times, held strongly)
Upper Boundary: ₹880-900 (consistent resistance)
Duration: Nearly 12 months of consolidation
Volume Profile: Compression throughout consolidation with periodic spikes
Key Observation: Longer the base, higher the potential breakout - this extended consolidation is bullish
Current Price Action (November 2025):
The Breakout Session (November 6-7, 2025):
Previous Close: ₹867.60
Opening: Gap-up opening (likely around ₹950-970 zone based on chart)
Intraday High: ₹1,034.50
Intraday Low: ₹910 (estimated from chart wicks)
Closing: ₹1,025.15
Day's Gain: ₹165.40 (+19.24%)
Trading Range: ₹124.50 (12% intraday volatility)
Breakout Candle Characteristics:
Candle Type: Large bullish marubozu-style candle (minimal wicks)
Body-to-Wick Ratio: Approximately 85:15 (highly bullish)
Upper Shadow: Very small (₹9.35), indicating no significant selling pressure at highs
Lower Shadow: Minimal, showing buyers were in complete control from open
Closing Strength: Closed near day's high (99.1% of high), demonstrating conviction
Gap Behavior: No attempt to fill the opening gap throughout the session
Price Action Interpretation:
The stock has broken through a consolidation zone with explosive momentum
Previous resistance at ₹900 was obliterated, not just crossed
The lack of upper wick suggests no supply even at elevated prices
Price discovery mode is active - buyers willing to chase at any price
The closing near highs indicates strong hands holding positions overnight
The stock has entered uncharted territory, creating new all-time highs
Price Action Quality Assessment:
Breakout Authenticity Score: 9/10
Gap-up opening: +2 points (shows conviction)
High volume: +2 points (validates breakout)
Close near high: +2 points (bullish control)
Minimal retracement: +1 point (strong hands)
Breaking all-time high: +2 points (new territory)
What Makes This Breakout Special?
It's not just breaking ₹900 resistance - it's jumping 15% above it
The consolidation was long (time creates energy)
Multiple failed attempts at ₹800-900 in past means trapped shorts
The volume explosion (112x average) shows institutional involvement
Closing near day's high indicates no distribution at top
Volume Spread Analysis - The Institutional Footprint:
Volume Quality Indicators:
Indicator 1: Volume Price Trend (VPT)
Status: Sharply positive
Interpretation: Volume flowing into rising prices (bullish confirmation)
Historical Context: Highest VPT reading since 2023 peak
Indicator 2: On-Balance Volume (OBV)
Movement: Massive upward spike
Previous OBV: Sideways for 12 months
Current OBV: Breaking out to new highs
Interpretation: Accumulation confirmed, distribution phase over
Indicator 3: Volume-Weighted Average Price (VWAP)
Intraday VWAP: Estimated around ₹980-1,000
Price vs VWAP: Closed 2.5-4.5% above VWAP
Interpretation: Late buyers chasing, but sustainable given context
Indicator 4: Accumulation/Distribution Line
Trend: Sharply higher
Reading: Strong accumulation
Historical Context: Confirms institutional buying after 12-month consolidation
Volume Characteristics Breakdown:
What the Volume is Telling Us?
Institutional Participation Evidence
Retail traders cannot generate 1.72M share volume alone
Block deals likely executed (need to check bulk/block deal data)
Systematic buying throughout session suggests algos/institutions
No single spike and fade pattern - sustained buying
Average trade size likely higher than typical (sign of institutional activity)
Short Covering Component
Previous resistance at ₹900 trapped many short sellers
Volume spike partially driven by forced short covering
Estimated short covering contribution: 20-30% of total volume
Remaining 70-80%: Fresh long positions and institutional buying
Market Maker Activity
Wide bid-ask spread likely during initial surge
Liquidity providers would have facilitated large orders
Options market likely saw heavy call buying (increases delta hedging volume)
Delivery percentage will confirm genuine buying (expect 60-70%+)
Volume Comparison with Historical Breakouts
Previous Breakout Attempts (Failed)
August 2024 attempt at ₹880: 0.8M shares (failed, price rejected)
October 2024 attempt at ₹900: 1.0M shares (failed, closed below)
March 2025 attempt at ₹870: 0.6M shares (failed, weak volume)
Current Breakout (Successful)
November 2025: 1.72M shares (72% higher than previous best attempt)
Success Factors: Volume 2-3x higher than failed attempts + fundamental catalyst
Historical Successful Breakouts for Comparison
June 2023 breakout at ₹600: 1.2M shares (led to ₹700, 17% rally)
Current volume is 43% higher than that successful breakout
Expectation: Similar or larger percentage move
Volume Red Flags and Cautions
What to Watch For?
If volume drops below 0.5M shares in next 3-5 sessions: Concerning (shows lack of follow-through)
If price retraces 50%+ on volume higher than breakout: Major warning (distribution)
If next up-day has volume less than today: Momentum weakening
If stock gaps down on high volume: Breakout failure scenario
Positive Confirmations Needed:
Next 3 days should have volume above 0.4-0.6M shares (sustained interest)
Any pullback should be on volume below 0.8M shares (healthy profit-taking)
Weekly close above ₹950 on cumulative volume of 3-4M shares (confirms breakout)
Volume-Based Risk Assessment
Risk Level: Moderate-to-High
High volume can sometimes indicate exhaustion (climactic buying)
However, context matters: breakout after 12-month base is different from parabolic move
The consolidation duration justifies the volume explosion
Risk is elevated for chasing here, but pullbacks offer lower-risk entries
Volume-Validated Support Levels:
₹950-980: Light volume zone (may not hold on first test)
₹900-920: High volume breakout zone (should provide strong support)
₹850-880: High volume consolidation zone (major support)
Volume Action Quality Score: 8.5/10
Scoring Breakdown:
Volume Expansion: 10/10 (112x is exceptional)
Volume-Price Relationship: 9/10 (perfectly correlated)
Distribution Pattern: 8/10 (well distributed, not spike-and-fade)
Historical Context: 9/10 (highest in 6+ months)
Follow-Through Potential: 7/10 (need confirmation in coming days)
Institutional Footprint: 9/10 (clear signs of smart money)
Why Not 10/10?
Extremely high volume can sometimes be exhaustion
Need 2-3 days confirmation for perfect score
Lack of multi-day volume buildup (came suddenly)
Could use a consolidation period to absorb supply
Technical Pattern Recognition
Base Formation (Q2FY26 Flag Pattern):
- Pattern Type: Strong Q2FY26 Flag Pattern on Weekly Timeframe
- Base Duration: Approximately 12 weeks (August 2025 - November 2025)
- Base Range: ₹780 - ₹900
- Consolidation Quality: Tight consolidation with reduced volatility
- Volume During Base: Steady contraction followed by explosive expansion
Breakout Characteristics:
- Breakout Level: ₹900 (previous resistance converted to support)
- Breakout Style: Gap-up opening with strong follow-through
- Volume Confirmation: Exceptional - 1.72M shares with unprecedented institutional buying
- Price Action: Strong bullish candle with minimal upper wick
- Breakout Validity: Confirmed by both price and volume action
Multi-Year Context:
- Long-Term Uptrend: Intact since 2022 lows (₹300-350 zone)
- Previous Major Resistance: ₹800 (tested multiple times in 2024-2025)
- Current Status: Breaking into all-time high territory with conviction
Support and Resistance Levels:
Key Support Zones:
- Immediate Support (S1): ₹900-920 (previous resistance, now support)
- Critical Support (S2): ₹850-870 (base bottom / 20-week moving average)
- Major Support (S3): ₹780-800 (psychological level and prior consolidation)
- Last Line of Defense (S4): ₹650-700 (major demand zone from mid-2025)
Resistance Levels:
- Immediate Resistance (R1): ₹1,050-1,080 (psychological round number and profit booking zone)
- Next Resistance (R2): ₹1,150-1,200 (measured move projection from flag pattern)
- Extended Resistance (R3): ₹1,250-1,300 (Fibonacci extension levels)
- Long-Term Resistance (R4): ₹1,400+
Risk Factors to Monitor:
Technical Risks:
- Failure to sustain above ₹900 would negate the breakout
- High volatility expected in near term given sharp rally
- Overbought conditions on daily timeframe
- Potential gap-fill scenario back to ₹900-920 zone
Market Risks:
- General market correction could impact momentum
- Profit booking in mid-cap/small-cap segment
- FII selling pressure in Indian markets
- Sector rotation away from FMCG stocks
Fundamental and Sectoral Backdrop:
Company Overview:
- Company: CCL Products (India) Limited
- Industry: Tea & Coffee (FMCG Sector)
- Market Cap: ₹13,689 Crores (Mid-cap)
- Business: World's largest private label instant coffee manufacturer
- Global Presence: Exports to 100+ countries with operations in India, Vietnam, and Switzerland
Recent Financial Performance (Q2 FY26):
Revenue Metrics:
- Q2 Revenue: ₹1,127 Crores (52.6% YoY growth)
- Q1 Revenue: ₹1,056 Crores (37% YoY growth)
- First-ever quarter with ₹1,000+ Crore turnover
- Quarterly revenue growth: 6.7% QoQ
Profitability Metrics:
- Q2 Net Profit: Up 36.4% YoY (beat estimates by 26.4%)
- Q2 EBITDA: ₹197.13 Crores (23.9% YoY growth)
- EBITDA Margin: 18% (slight compression due to input costs)
- Guidance: 15-20% EBITDA growth maintained
Key Performance Indicators:
- Volume Growth: 9-10% YoY (maintaining 10-20% guidance)
- Capacity Utilization: 60% (significant room for expansion)
- Domestic Branded Business: ₹150 Crores (strong growth trajectory)
- ROE: 17% | ROCE: 13.1% | Debt-to-Equity: 0.78
Balance Sheet Strength:
- Net Debt: ₹1,671 Crores (down from ₹1,812 Crores)
- Debt Reduction Target: ₹1,350 Crores by December 2025
- Further Target: ₹1,200 Crores by March 2026
- Strong focus on deleveraging while maintaining growth
Valuation Parameters:
- Current P/E Ratio: 40.5x (premium to industry median of 37.56x)
- P/B Ratio: 6.56x (significant premium to peers' 1.55x median)
Sectoral Dynamics:
Coffee Industry Tailwinds:
- Global coffee prices surged 80% in 2024 (benefiting margins with cost-plus model)
- India's instant coffee market growing rapidly with urbanization
- Rising coffee culture in India, especially among youth
- Export opportunities expanding (India coffee exports crossed $1 billion)
Company-Specific Strengths:
- World's largest private label instant coffee manufacturer
- Advanced R&D with 900+ coffee blends customized for global markets
- Manufacturing capacity: 60,000 MTPA (Spray Dried) + 11,000 MTPA (Freeze Dried)
- Third-largest coffee brand in India (B2C segment)
- Strong B2B relationships with major global brands
Growth Drivers:
- Branded business expansion (Continental, Percol, Rocket Fuel brands)
- Increased inquiries from US customers due to Brazil tariff changes
- Capacity expansion with significant headroom (40% unutilized)
- International market penetration (UK acquisition, targeting Indian diaspora)
- Diversification into premium products (Freeze Dried Coffee, premixes)
Challenges and Headwinds:
Input Cost Pressure:
- Green coffee prices remain volatile despite recent 20-30% correction
- High GST rate of 18% on coffee impacting domestic demand
- Interest and depreciation costs rising with capacity expansion
Demand Concerns:
- Urban FMCG consumption showing signs of slowdown
- Rural demand growth remains sluggish
- Competition from organized café chains for out-of-home consumption
Policy and Regulatory:
- Company seeking tax benefits and GST rate reduction to boost consumption
- Need for supportive policies for sustainable coffee cultivation
- Currency fluctuation risks in exports
Management and Corporate Governance:
- Promoter Holding: 46.11% (strong skin in the game)
- FII Holding: 10.52% (increased institutional interest)
- DII Holding: 21.83% (domestic institutional confidence)
- Chairman: C. Rajendra Prasad (Founder with 35+ years coffee industry experience)
- CEO: Praveen Jaipuriar (driving branded business expansion)
- MD: Challa Srishant (focusing on innovation and market expansion)
Strategic Initiatives:
- Debt reduction plan to improve financial flexibility
- Brand development focusing on region-specific products
- International expansion in B2C segment (UK, targeting US market)
- Sustainability initiatives across operations
- Product diversification (recently launched iced tea range)
Competitive Position:
- Market leader in private label instant coffee globally
- Key competitor: Tata Coffee
- Competitive advantages: Scale, R&D capabilities, global distribution, cost-plus pricing model
- Differentiation: Ability to create customized blends for diverse global palates
Why This Makes Sense?
Technical Factors:
- Clean breakout from multi-month consolidation with exceptional volume
- Trading above all major moving averages with strong momentum
- Prior resistance at ₹800-900 now acting as robust support
- Volume profile suggests institutional accumulation
Fundamental Factors:
- Strong revenue growth (37-52% YoY) with consistent quarterly performance
- Improving profitability with EBITDA growth of 23-24% YoY
- Proactive debt reduction improving balance sheet strength
- Global market leader position with significant competitive moats
Sectoral Factors:
- Coffee consumption growing in India with changing lifestyle preferences
- Export opportunities expanding with global supply chain shifts
- Company well-positioned to capture both B2B and B2C growth
- Capacity headroom provides growth visibility
What to Track?
Immediate Action Items:
- Monitor price behavior at current levels (₹1,000-1,050)
- Wait and Look for consolidation/pullback
- Set price alerts at key levels: ₹950, ₹900, ₹870
- Review quarterly results and management commentary
Ongoing Monitoring:
- Track weekly closes - should remain above ₹900
- Monitor volume patterns - sustained above-average volume bullish
- Watch for management updates on debt reduction progress
- Keep eye on green coffee prices and margin trends
- Assess broader market sentiment and FMCG sector performance
Review Triggers:
- Quarterly earnings announcements (next due February 2026)
- Any major change in promoter/institutional holdings
- Significant deviation from volume guidance (10-20%)
- Breach of critical support at ₹850
My 2 Cents:
The stock presents a compelling opportunity based on:
- Strong technical breakout with exceptional volume confirmation
- Robust fundamental performance with 37-52% revenue growth
- Industry leadership position as world's largest private label coffee manufacturer
- Improving balance sheet with proactive debt reduction
- Analysis Valid Until: Next quarterly results or significant technical breakdown below ₹870
Full Coverage on my Newsletter this Week
Keep in the Watchlist and DOYR.
NO RECO. For Buy/Sell.
📌Thank you for exploring my idea! I hope you found it valuable.
🙏FOLLOW for more
👍BOOST if you found it useful.
✍️COMMENT below with your views.
Meanwhile, check out my other stock ideas on the right side until this trade is activated. I would love your feedback.
As per the Latest SEBI Mandate, this isn't a Trading/Investment RECOMMENDATION nor for Educational Purposes; it is just for Informational purposes only. The chart data used is 3 Months old, as Showing Live Chart Data is not allowed according to the New SEBI Mandate.
Disclaimer: "I am not a SEBI REGISTERED RESEARCH ANALYST AND INVESTMENT ADVISER."
This analysis is intended solely for informational purposes and should not be interpreted as financial advice. It is advisable to consult a qualified financial advisor or conduct thorough research before making investment decisions.
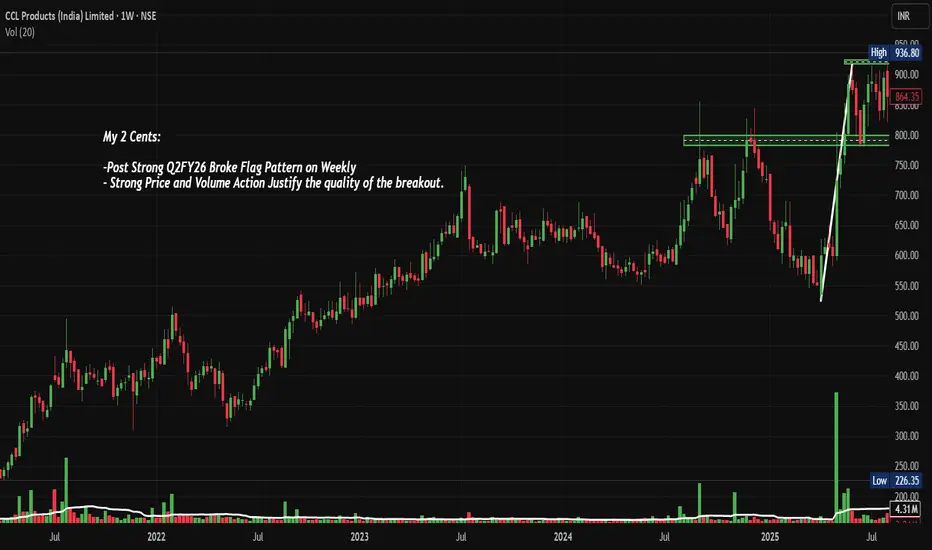
LTF Breaking Out of Consolidation and ascending triangleNSE:LTF : Breaking Out of Consolidation and ascending triangle with heavy volumes today - Is This the Next Big NBFC Move?
Price Action Analysis:
• Base Formation: Clear sideways movement between ₹160-172 levels
• Breakout Confirmation: Recent breach above ₹172 resistance with volume expansion
• Trendline Break: White descending trendline from December highs decisively broken
• Market Structure: Shift from the consolidation phase to the potential trend resumption
• Time Frame: A six-month base provides a strong foundation for sustained movement
Volume Analysis:
• Current Volume: 5.57M against 20-day average of 15.94M
• Volume Pattern: Accumulation visible during the base formation period
• Support Tests: Volume spikes coinciding with successful ₹160-164 support tests
• Breakout Volume: Adequate but not exceptional - requires monitoring for follow-through
• Distribution Signs: No significant selling pressure visible during consolidation
Key Support & Resistance Levels:
Support Levels:
• Immediate Support: ₹172 (new floor post-breakout)
• Secondary Support: ₹168 (previous resistance turned support)
• Major Support: ₹160-164 (primary consolidation base)
• Critical Support: ₹155 (breakdown level)
Resistance Levels:
• Immediate Resistance: ₹190-195 (measured move target)
• Next Resistance: ₹205-210 (psychological and technical zone)
• Long-term Target: ₹220-225 (extension target)
Trade Setup:
Entry Strategy:
• Aggressive Entry: Current levels ₹183-184 for momentum traders
• Conservative Entry: ₹175-177 on pullback to breakout zone
• DCA Approach: Scale in between ₹175-185 levels
Exit Strategy:
• Target 1: ₹192 (measured move from rectangle pattern)
• Target 2: ₹205-210 (next significant resistance)
• Target 3: ₹220+ (extension target for long-term holders)
Stop Loss:
• Closing Basis: Below ₹170
• Intraday Basis: Below ₹168
• Risk Percentage: 7-8% from current levels
Position Sizing & Risk Management:
Position Sizing:
• Conservative: 1% portfolio risk
• Moderate: 1.5% portfolio risk
• Aggressive: 2% portfolio risk (maximum recommended)
Risk Management:
• Stop Loss Discipline: Strict adherence to ₹170 closing stop
• Position Scaling: Reduce position if breaks ₹175 intraday
• Profit Booking: Book 30% at ₹192, 40% at ₹205
• Trailing Stop: Implement above ₹195 levels
Sectoral Backdrop:
NBFC Sector Positives:
• Credit Growth: NBFC credit growth outpacing bank credit
• Market Share: Gaining share in retail and SME segments
• Asset Quality: Improving collection efficiency post-COVID
• Regulatory Support: Favourable policy environment
Sector Trends:
• Digital Lending: Increased adoption of technology platforms
• Rural Focus: Growing emphasis on semi-urban and rural markets
• Partnership Models: Collaborations with fintech companies
Fundamental Backdrop:
Company Strengths:
• Group Support: Strong L&T Group parentage and backing
• Diversified Portfolio: Exposure across infrastructure and retail segments
• Quality Borrowers: Access to L&T Group ecosystem clients
• Management Quality: Experienced leadership team
Recent Developments:
• Asset Quality: Improving NPA ratios
• Profitability: Better margins and ROE metrics
• Growth Strategy: Focus on profitable growth segments
Risk Factors:
Technical Risks:
• False Breakout: Possibility of returning to the consolidation range
• Volume Confirmation: Need for sustained volume support
• Market Correlation: High beta to financial sector performance
Fundamental Risks:
• Interest Rate Risk: Rising rates impacting lending margins
• Credit Quality: Potential stress in the retail lending portfolio
• Economic Slowdown: Impact on borrower repayment capacity
• Regulatory Changes: Policy shifts affecting NBFC operations
Market Risks:
• Sector Rotation: Money moving away from financial stocks
• Liquidity Concerns: Tightening of wholesale funding markets
• Competition: Increased competition from banks and fintech
My Take:
The technical setup suggests accumulation phase completion with potential for a significant move higher. Follow the Strict Trade Plan as Explained Above.
Keep in the Watchlist.
NO RECO. For Buy/Sell.
📌Thank you for exploring my idea! I hope you found it valuable.
🙏FOLLOW for more
👍BOOST if you found it useful.
✍️COMMENT below with your views.
Meanwhile, check out my other stock ideas on the right side until this trade is activated. I would love your feedback.
Disclaimer: "I am not a SEBI REGISTERED RESEARCH ANALYST AND INVESTMENT ADVISER."
This analysis is intended solely for informational and educational purposes and should not be interpreted as financial advice. It is advisable to consult a qualified financial advisor or conduct thorough research before making investment decisions.
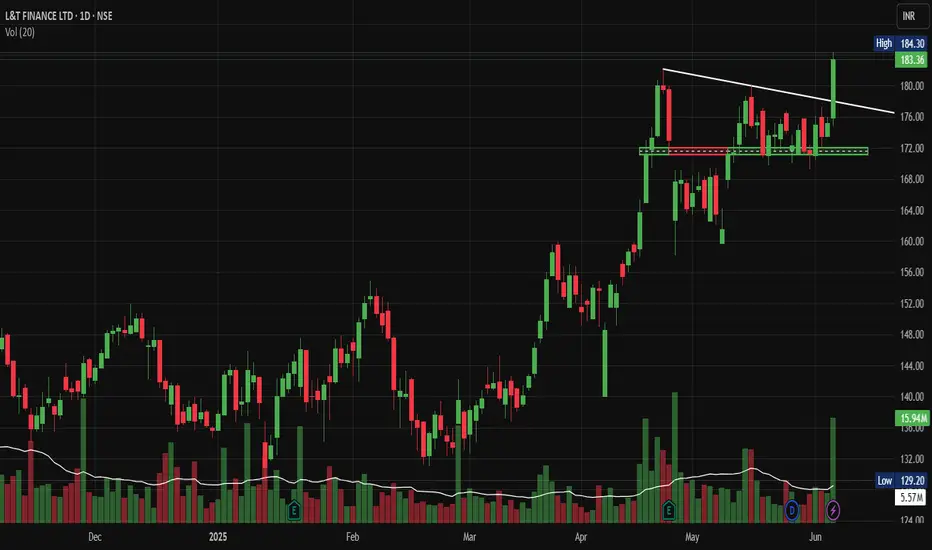
ChennaiPetro: Wedge & Trendline BO with 61.8%, Chart of the WeekNSE:CHENNPETRO Explosive Breakout: Why This Refinery Stock Could Rally Another 30% After Its Q2 Turnaround. This PSU Refinery Stock Broke Through ₹979 Levels - Here's What Traders Need to Know About the Next Move. Let's Analyse in our Chart of the Week Below.
As per the Latest SEBI Mandate, this isn't a Trading/Investment RECOMMENDATION nor for Educational Purposes; it is just for Informational purposes only. The chart data used is 3 Months old, as Showing Live Chart Data is not allowed according to the New SEBI Mandate.
Disclaimer: "I am not a SEBI REGISTERED RESEARCH ANALYST AND INVESTMENT ADVISER."
This analysis is intended solely for informational purposes and should not be interpreted as financial advice. It is advisable to consult a qualified financial advisor or conduct thorough research before making investment decisions.
Price Action Analysis:
Trend Structure and Momentum:
- The stock experienced a prolonged uptrend from March 2023 to July 2024, rallying from base levels around ₹433 to a peak of ₹1,275, representing approximately 195% appreciation
- Post the July 2024 peak, the stock entered a corrective phase characterised by lower highs and consolidation
- Recent price action shows a breakout above the descending cyan trendline that had been capping rallies since mid-2024
- Current price of ₹979.35 (as of October 31, 2025) represents a 26.80% gain, indicating strong buying momentum
- The stock is trading above all key Fibonacci retracement levels, having reclaimed the 61.8% level at approximately ₹953
Candlestick Patterns and Formations:
- The most recent candle shows a strong bullish close with a substantial body, indicating conviction in the upward move
- The chart displays a rising wedge/descending channel pattern that was broken decisively in recent sessions
- Prior consolidation between ₹700-₹850 formed a re-accumulation base, which has now been breached to the upside
- The breakout candle demonstrates strong price and volume expansion, a classic sign of institutional participation
Volume Spread Analysis:
Volume Characteristics:
- Recent volume surge to 90.39 million shares significantly exceeds the average volume of 13.46 million, representing approximately 6.7x normal trading activity
- The volume spike coincides with the price breakout, validating the move as genuine rather than a false breakout
- Historical volume analysis shows similar spikes during major trend reversals, particularly during the March 2023 base breakout
- Volume expansion without corresponding price weakness suggests strong demand absorption at current levels
Volume-Price Relationship:
- The volume profile indicates heavy accumulation in the ₹700-₹800 zone, which now serves as a critical support cluster
- Recent sessions show sustained above-average volume, suggesting institutional interest rather than retail speculation
- The volume pattern aligns with a classic "breakout with expansion" scenario, increasing the probability of trend continuation
Support and Resistance Levels:
Key Support Zones:
- Primary Support (S1): ₹854 - This represents the 0.5 Fibonacci retracement level and previous consolidation high
- Secondary Support (S2): ₹754 - The 0.382 Fibonacci level and recent breakout point from the descending trendline
- Critical Support (S3): ₹631 - The 0.236 Fibonacci level and long-term base support at ₹433-₹450 zone
- The grey trendline originating from the 2024 lows provides dynamic support, currently positioned around ₹720
Key Resistance Zones:
- Immediate Resistance (R1): ₹1,094 - The 0.786 Fibonacci retracement level
- Major Resistance (R2): ₹1,275 - The all-time high achieved in July 2024 and psychological resistance
- Extended Resistance (R3): ₹1,400-₹1,500 - Projected based on measured move from the consolidation range
Technical Patterns and Indicators:
Chart Patterns:
- Descending Channel Breakout: The stock has successfully breached the cyan-colored descending trendline that acted as resistance since July 2024
- Rising Wedge Resolution: The consolidation pattern between August and October 2025 has resolved to the upside
- Base-on-Base Formation: The ₹433 level established in early 2024 served as the foundation for the subsequent rally, demonstrating strong long-term base support
- Cup and Handle (Potential): If the stock consolidates between ₹950-₹1,050 and then breaks out, it could form a cup and handle pattern projecting toward ₹1,400+
Fibonacci Analysis:
- The 61.8% Fibonacci retracement at ₹953 has been convincingly reclaimed, suggesting the corrective phase may be complete
- Golden ratio support held perfectly during the September-October consolidation
- The next Fibonacci target at 0.786 (₹1,094) represents the immediate upside objective
- Fibonacci extension levels project Upmove at ₹1,350 (1.272 extension) and ₹1,500 (1.618 extension) if the rally extends
Risk Factors and Invalidation Levels:
- A close below ₹920 would signal a potential false breakout
- Sustained trading below ₹850 would invalidate the bullish setup and suggest resumption of the downtrend
- Weekly close below the broken trendline (currently around ₹940) would be a bearish reversal signal
- Failure to maintain above 61.8% Fibonacci retracement could trigger another corrective leg
Fundamental and Sectoral Backdrop:
Company Fundamentals:
- Chennai Petroleum Corporation (CPCL) reported Q2 FY26 revenue of ₹16,327 crore with profit after tax of ₹719 crore
- The company achieved a crude throughput of 3.013 million metric tonnes (MMT) with a Gross Refining Margin (GRM) of $9.04 per barrel in Q2 FY26
- However, Q1 FY26 saw challenges with a net loss of ₹40 crore compared to a profit of ₹357 crore in Q1 FY25, primarily due to inventory losses and lower GRM of $3.22 per barrel
- For H1 FY26, CPCL recorded net profit of ₹689.68 crore versus a net loss of ₹294.45 crore in H1 FY25, with average GRM at $6.17 per barrel
- The company achieved a record crude throughput of 11.642 MMT with 111% capacity utilisation
Business Operations and Product Portfolio:
- CPCL is engaged in refining crude oil to produce various petroleum products, including LPG, Motor Spirit, Kerosene, Aviation Turbine Fuel, High Speed Diesel, Naphtha, Fuel Oil, and Bitumen
- The company also produces speciality products like Paraffin Wax, Mineral Turpentine Oil, Hexane, and Petrochemical feedstocks
- Most fuel products are marketed by the parent company, Indian Oil Corporation (IOC), while CPCL directly markets speciality products
- In 2024, CPCL commissioned new infrastructure, including Pharma Grade Hexane production and Sustainable Aviation Fuel
Financial Metrics and Valuation:
- Market capitalisation stands at approximately ₹14,584 crore, with the company maintaining a healthy dividend payout of 35%
- CPCL has demonstrated strong return on equity with a 3-year ROE of 31% and has reduced debt levels
- Current price-to-earnings and other valuation metrics suggest the stock is reasonably valued considering sectoral challenges
Sector Outlook and Industry Trends:
- India's refining capacity increased to 258.1 MMTPA as of FY25, with domestic consumption at 239.2 MMTPA
- India is expected to drive global oil demand growth, with consumption projected at 5.74 million barrels per day in 2025 and 5.99 million bpd in 2026
- The country plans to expand refining capacity to 309.5 MMTPA by 2028
- Refinery output has been strong, with manufacturing IIP for refined petroleum products rising 4.24% in June 2025, driven by auto-fuel demand growth of 7.9% year-on-year
- However, refining margins are expected to fall below mid-cycle levels in FY25, indicating potential profitability challenges
Opportunities and Challenges:
Opportunities:
- Downstream activities driven by refinery-petrochemical integration are projected to post the highest 5.2% CAGR through 2030
- Growing domestic demand for petroleum products with urbanisation and economic growth
- Government initiatives supporting energy infrastructure development
- Indian refiners have benefited from processing discounted Russian crude, generating significant margins
Challenges:
- Net profit declined for the last two quarters, with an average decrease of 108.5% per quarter, and revenue fell 14.1% per quarter
- Volatile crude oil prices and fluctuating gross refining margins
- India's domestic crude oil production has fallen 26.3% and natural gas by 24.1% during FY12-FY25, leading to increased import dependency
- Environmental regulations and pressure to transition toward cleaner energy
- Institutional investment in CPCL decreased by 37.83% over the past 30 days
Competitive Position:
- CPCL is a subsidiary of Indian Oil Corporation, providing strategic advantages in product marketing and distribution
- The company competes with major refiners, including Reliance Industries, Bharat Petroleum, Hindustan Petroleum, and Mangalore Refinery
- CPCL's core vision is to be the most admired Indian energy company, creating value through world-class performance and ethical governance
- The company's location in South India provides strategic advantages for serving the region's growing energy needs
Fundamental Risks:
- The stock trades at reasonable valuations with potential upside to fair value estimates around ₹1,050
- Strong Q2 performance suggests earnings momentum is improving after a weak Q1
- Sectoral tailwinds from growing domestic demand support medium-term prospects
- Key risks include GRM volatility, crude price fluctuations, and regulatory changes
My 2 Cents:
- CPCL presents a compelling technical setup following the breakout from a multi-month consolidation pattern
- The combination of volume expansion, Fibonacci support, and trendline breach suggests potential for further upside
- Risk management is critical given sectoral volatility; strict adherence to stop losses is recommended
Full Coverage on my Newsletter this Week
Keep in the Watchlist and DOYR.
NO RECO. For Buy/Sell.
📌Thank you for exploring my idea! I hope you found it valuable.
🙏FOLLOW for more
👍BOOST if you found it useful.
✍️COMMENT below with your views.
Meanwhile, check out my other stock ideas on the right side until this trade is activated. I would love your feedback.
As per the Latest SEBI Mandate, this isn't a Trading/Investment RECOMMENDATION nor for Educational Purposes; it is just for Informational purposes only. The chart data used is 3 Months old, as Showing Live Chart Data is not allowed according to the New SEBI Mandate.
Disclaimer: "I am not a SEBI REGISTERED RESEARCH ANALYST AND INVESTMENT ADVISER."
This analysis is intended solely for informational purposes and should not be interpreted as financial advice. It is advisable to consult a qualified financial advisor or conduct thorough research before making investment decisions.
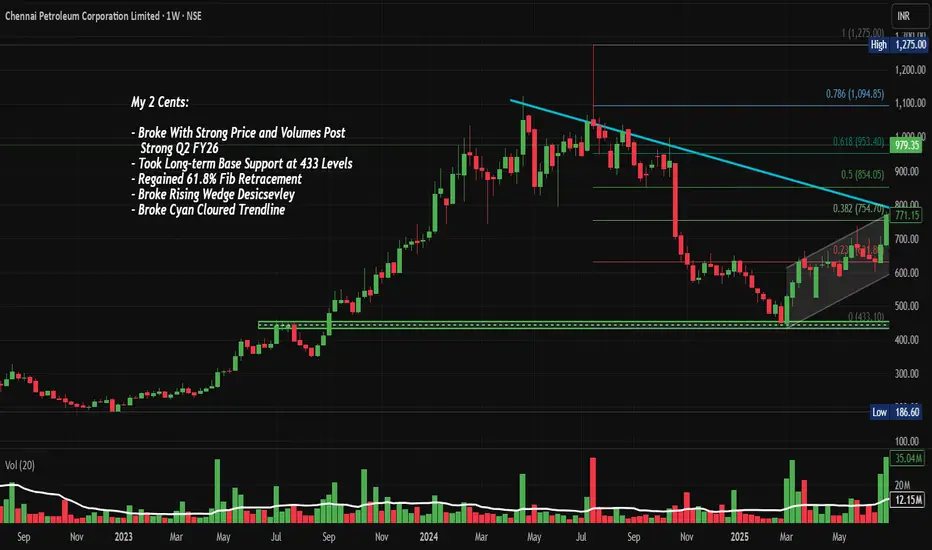
Inox Wind cmp 154.08 by Daily Chart viewInox Wind cmp 154.08 by Daily Chart view
- Support Zone 136 to 146 Price Band
- Resistance Zone 165 to 176 Price Band
- Volumes in good sync with avg traded quantity
- Falling Resistance Trendline Breakout seems sustained
- VCP pattern seems in making process by technical chart setup
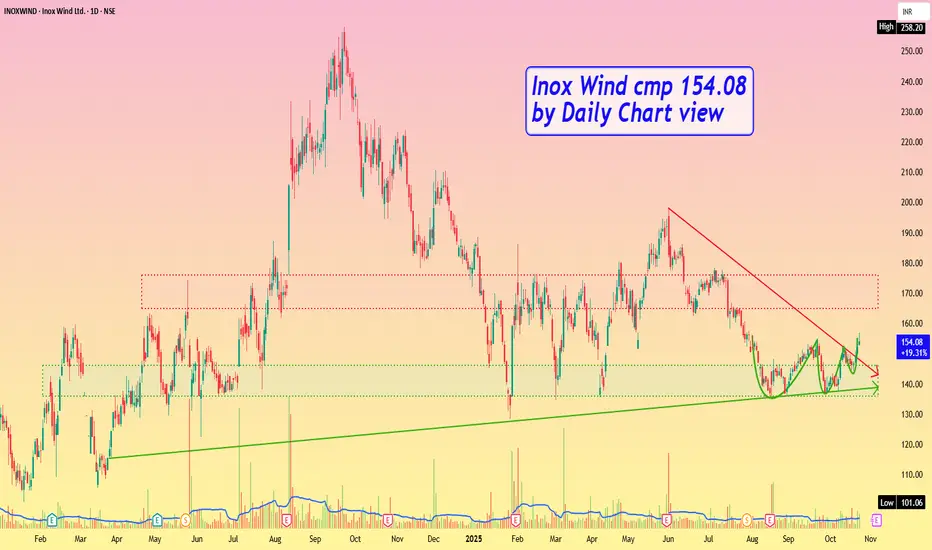
DCBBANK: Strong Q2 FY26 Numbers, Triangle BO, Chart of the MonthNSE:DCBBANK This Banking Stock Just Broke Out After a Year of Consolidation - Is a 30% Rally Coming? Posted Strong Q2 FY26 Numbers, Let's Analyse in the Chart of the Month.
As per the Latest SEBI Mandate, this isn't a Trading/Investment RECOMMENDATION nor for Educational Purposes; it is just for Informational purposes only. The chart data used is 3 Months old, as Showing Live Chart Data is not allowed according to the New SEBI Mandate.
Disclaimer: "I am not a SEBI REGISTERED RESEARCH ANALYST AND INVESTMENT ADVISER."
This analysis is intended solely for informational purposes and should not be interpreted as financial advice. It is advisable to consult a qualified financial advisor or conduct thorough research before making investment decisions.
Price Action Analysis:
Overall Trend Structure:
- The stock demonstrates a year consolidation pattern from 2024 to mid-2025, creating a strong base for accumulation
- Post-Q2 FY26 results, DCB Bank has broken out decisively from a symmetrical triangle pattern that formed during the consolidation phase
- The current price of ₹157.67 represents a significant move above the resistance zone of ₹150, which acted as a ceiling multiple times since early 2024
- A notable ascending trendline (marked in cyan) has been providing dynamic support from early 2024, suggesting sustained buying interest
Recent Price Movement:
- The stock witnessed a dramatic 23% surge in just two trading sessions (October 21-22, 2025) following the Q2 FY26 earnings release
- Current price of ₹157.67 is approaching the 52-week high of ₹163.70, demonstrating strong upward momentum
- The breakout candle shows strong conviction with increased volume participation, validating the move
- Price has successfully reclaimed and is sustaining above the critical ₹150 psychological and technical resistance level
- The stock is still 38% below its all-time high of ₹244.65, providing substantial room for upside potential
Historical Context:
- From 2021 lows around ₹70, the stock rallied to ₹150 levels by mid-2022
- A prolonged correction and consolidation phase lasted from mid-2022 through early 2024
- Multiple attempts to break the ₹150 resistance were rejected during 2024, creating a strong supply zone
- The recent breakout in October 2025 marks the first successful breach of this multi-year resistance with volume confirmation
Volume Action Analysis:
Volume Characteristics:
- Current daily volume stands at 98.79 million shares against an average of 11.07 million shares, representing an 8x surge
- Volume spike coincides perfectly with the breakout above ₹150 resistance, confirming institutional participation
- Consistent volume bars during the consolidation phase suggest steady accumulation by long-term investors
- Volume at key support levels during corrections has been relatively lower, indicating a lack of panic selling
- The volume profile shows the heaviest concentration between the ₹120-130 range, which now acts as a strong demand zone
Volume-Price Relationship:
- Breakout above resistance, accompanied by massive volume expansion, validates the bullish move
- Volume on up days significantly exceeds volume on down days during the recent rally, showing strong buying pressure
- Green volume bars dominating red volume bars in the recent price action indicate bullish accumulation
- Volume during the triangle formation was progressively declining, which is characteristic of a valid continuation pattern
- Post-breakout volume sustaining above average levels suggests continuation rather than exhaustion
Support and Resistance Levels:
Key Resistance Zones:
- Immediate Resistance (R1): ₹163.70 (52-week high and recent high)
- Medium-term Resistance (R2): ₹175-180 (Fibonacci extension level and psychological resistance)
- Major Resistance (R3): ₹200 (round number psychological barrier)
- Long-term Resistance (R4): ₹244.65 (all-time high)
Key Support Zones:
- Immediate Support (S1): ₹150 (previous resistance turned support, breakout level)
- Strong Support (S2): ₹138-140 (50% retracement of recent rally and pivot level marked on chart)
- Major Support (S3): ₹125 (ascending trendline support and breakout point from triangle)
- Critical Support (S4): ₹110-115 (bottom of recent consolidation range)
Support Strength Assessment:
- The ₹150 level has now transformed from a stubborn resistance to a new support base
- The ascending trendline from 2024 lows provides dynamic support that has been tested multiple times successfully
- The ₹125-130 zone represents a confluence of horizontal support, trendline support, and a high-volume node
- Gap support around ₹147 from the recent breakout provides a short-term cushion against minor corrections
Base Formation and Accumulation:
Base Characteristics:
- A well-defined multi-year base formation spanning approximately 2.5 years (mid-2022 to October 2025)
- The base exhibits characteristics of a symmetrical triangle consolidation pattern
- Lower highs and higher lows converging towards the apex created compression, leading to the explosive breakout
- This extended consolidation period allowed for the distribution of weak hands and accumulation by strong hands
- The base depth of approximately 35-40% from top to bottom indicates significant energy buildup
Accumulation Evidence:
- Declining volume during consolidation, followed by expansion on breakout, is a textbook accumulation pattern
- Multiple false breakouts were absorbed without panic selling, indicating patient accumulation
- Price holding above ascending trendline throughout 2024-2025 shows consistent buying support
- The rounding bottom formation visible from mid-2024 through September 2025 is a bullish accumulation pattern
- Improved fundamentals during the consolidation period attracted smart money accumulation
Technical Patterns:
Symmetrical Triangle Pattern:
- A clear symmetrical triangle pattern formed from June 2024 through October 2025
- The pattern shows converging trendlines with at least 4-5 touch points on each side
- Breakout occurred near the apex with strong volume, which is the ideal scenario for this pattern
- The pattern duration of approximately 16 months makes it a highly reliable formation
Ascending Triangle Elements:
- An ascending triangle component is visible in the chart with a flat top resistance at ₹150
- Rising lows forming the ascending trendline show progressive buying interest
- This bullish continuation pattern typically resolves to the upside, which has now been confirmed
- The pattern suggests strong demand overwhelming supply at higher levels
Breakout Pattern Validation:
- The breakout above ₹150 was accompanied by a large bullish engulfing candle
- Gap-up opening on breakout day shows urgency and conviction among buyers
- No immediate throwback to retest breakout level indicates strength
- The breakout occurred with 8x normal volume, validating the move
- Price sustaining above the breakout level for multiple sessions confirms pattern validity
Sectoral Backdrop - Private Banking Industry:
Sector Overview and Trends:
- The Indian banking sector has shown resilience with credit growth in the range of 15-17% year-on-year
- Private sector banks are gaining market share from PSU banks due to superior asset quality and technology adoption
- Small and mid-sized private banks like DCB Bank are carving niches in specific lending segments
- Net Interest Margins (NIMs) are stabilising after compression in 2023-2024, providing earnings visibility
- Asset quality metrics across the banking sector have improved, with Gross NPA levels at multi-year lows
Sector Valuations and Outlook:
- Banking sector trading at reasonable valuations with an average P/B ratio of 2-3x for private banks
- Small-cap private banks trading at a significant discount to large private banks, offering a value opportunity
- Sector outlook remains positive, driven by India's GDP growth trajectory of 6-7%
- Expected rate stability from the RBI in 2025 will help banks maintain margins
- Increasing digital adoption and financial inclusion are driving deposit and loan growth
Competitive Landscape:
- DCB Bank competes with peers like RBL Bank, South Indian Bank, Karur Vysya Bank, and CSB Bank
- Focus areas include retail lending, MSME lending, and specialised products like gold loans
- Technology adoption and digital banking are becoming key differentiators in the competitive landscape
- Consolidation trend in small banks may create M&A opportunities for well-positioned players
- Customer acquisition cost is declining with digital channels gaining prominence
Fundamental Backdrop:
Recent Financial Performance:
- Q2 FY26 results showed a robust 16.2% YoY growth in net profit to ₹184 crore
- Net Interest Income (NII) grew 17% YoY to ₹596 crore, indicating healthy core business growth
- Advances increased by 19% YoY, demonstrating strong loan book expansion
- Total operating income rose 16.22% to ₹1,822.75 crore in Q2 FY26
- Return on Assets (ROA) at 0.85% and Return on Equity (ROE) at 11.4% showing steady improvement
Asset Quality Metrics
- Gross NPA ratio improved to 2.91% as of September 30, 2025, down from 3.29% YoY
- Net NPA ratio at healthy 1.21%, indicating strong recovery and collection mechanisms
- Slippages are moderating sequentially, suggesting improved underwriting standards
- Provision coverage ratio remains adequate, providing a buffer against potential stress
- Management expects credit cost to remain below 45 basis points for the full year, indicating confidence in asset quality
Capital and Liquidity Position:
- Capital Adequacy Ratio (CAR) at strong 16.41% (Tier I: 13.97%, Tier II: 2.44%) as per Basel III norms
- Well-capitalised to support planned 20%+ loan growth without dilution
- CASA ratio at 23.52% as of September 2025, though lower than the desired 25%+
- Cost of deposits declining, helping NIM expansion despite a competitive deposit environment
- Liquidity coverage ratio and statutory ratios comfortably above regulatory requirements
Strategic Initiatives and Growth Drivers:
- Increased focus on gold loans and co-lending partnerships, driving fee income
- Emphasis on employee productivity and technology adoption, reducing Cost to Average Assets
- Digital transformation is improving customer experience and operational efficiency
- Targeting ROA of 1% and ROE of 14-15% by FY27 as per management guidance
- Niche focus areas like school finance, retail microfinance, and supply chain finance, providing growth levers
Valuation Metrics:
- Trading at P/E ratio of 7.30-7.58x, significantly below sector average of 15-20x
- Price to Book Value of 0.85x, below 1x, suggesting undervaluation
- PEG ratio of 0.51 indicates the stock is undervalued relative to the growth rate
- Dividend yield of 0.81-0.87% with a consistent dividend payout history
- Market capitalisation of approximately ₹5,065 crore classifies it as a small-cap bank
- Attractive valuation multiple offers significant re-rating potential as performance improves
Management and Governance:
- Leadership under MD & CEO Praveen Kutty is showing strong execution capabilities
- Management has consistently delivered on stated guidance parameters
- Board composition includes experienced banking professionals and independent directors
- No major governance concerns or regulatory issues flagged
- Transparent communication with stakeholders through regular investor calls and updates
Key Risks to Monitor:
- Small-cap bank status means higher vulnerability to market sentiment and liquidity shocks
- CASA ratio below peers indicates higher cost of funds and margin pressure risk
- Geographic concentration in certain states may lead to regional economic exposure
- Competition from larger banks and fintech players in key product segments
- Regulatory changes impacting small banks could affect operations
- Slower-than-expected economic growth could impact loan demand and asset quality
Technical Sentiment:
- Technical indicators, including MACD and Bollinger Bands, show bullish signals across timeframes
- Golden cross formation (50-day MA crossing above 200-day MA) has bullish implications
- Momentum indicators suggest the stock remains in a bullish zone with room to run
- Pattern completion targets align with brokerage fundamental price targets around ₹175-200
- Short-term overbought conditions may lead to consolidation, but don't negate the bullish thesis
Trade Monitoring and Review Framework:
Daily Monitoring Checklist:
- Check price action relative to key support and resistance levels identified
- Monitor volume patterns - declining volume on pullbacks is healthy, rising volume on breakdowns is concerning
- Track broader market indices (Nifty, Bank Nifty) for sector correlation
- Review any news flow specific to DCB Bank or the banking sector
- Ensure stop loss orders are active and properly placed in the system
Weekly Review Points:
- Assess whether the stock is respecting the ascending trendline support
- Compare DCB Bank's performance relative to the Bank Nifty index and peer banks
- Review any changes in FII/DII holdings or institutional activity
- Check for any upgrades/downgrades from research analysts
- Evaluate whether to book partial profits or adjust stop losses based on price movement
Quarterly Assessment:
- Deep dive into quarterly results when announced against expectations
- Review management commentary and guidance for any changes in outlook
- Assess asset quality trends, NIM trajectory, and expense management
- Compare performance metrics with peer group banks
- Re-evaluate position size and allocation based on updated fundamentals
Red Flags to Watch:
- Any close below the ascending trendline support on high volume
- Significant deterioration in asset quality (GNPAs rising above 3.5%)
- Margin compression beyond 10 basis points in a quarter
- Negative management commentary or guidance revision downwards
- Broader banking sector entering correction phase with systematic risks emerging
My 2 Cents:
- DCB Bank presents a compelling risk-reward opportunity at current levels following a clean technical breakout
- Multi-year base formation and pattern completion project has significant upside potential
- Strong fundamentals with improving profitability, asset quality, and capital ratios support the technical picture
- Attractive valuations at 0.85x P/B and 7.5x P/E provide substantial margin of safety
- Positive sectoral tailwinds and company-specific growth initiatives enhance medium-term outlook
Full Coverage on my Newsletter this Week
Keep in the Watchlist and DOYR.
NO RECO. For Buy/Sell.
📌Thank you for exploring my idea! I hope you found it valuable.
🙏FOLLOW for more
👍BOOST if you found it useful.
✍️COMMENT below with your views.
Meanwhile, check out my other stock ideas on the right side until this trade is activated. I would love your feedback.
As per the Latest SEBI Mandate, this isn't a Trading/Investment RECOMMENDATION nor for Educational Purposes; it is just for Informational purposes only. The chart data used is 3 Months old, as Showing Live Chart Data is not allowed according to the New SEBI Mandate.
Disclaimer: "I am not a SEBI REGISTERED RESEARCH ANALYST AND INVESTMENT ADVISER."
This analysis is intended solely for informational purposes and should not be interpreted as financial advice. It is advisable to consult a qualified financial advisor or conduct thorough research before making investment decisions.
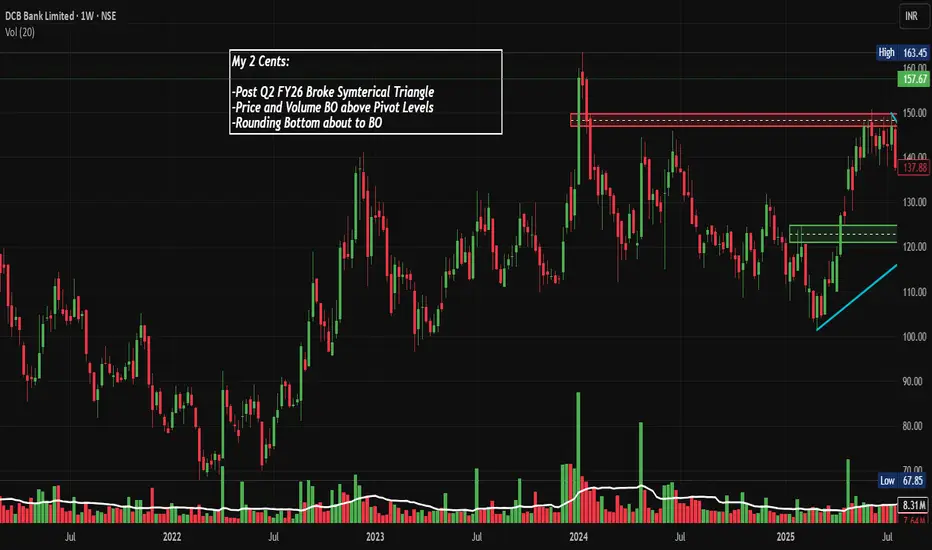
Ujjivan Small Finance cmp 50.24 by Weekly Chart view since listeUjjivan Small Finance cmp 50.24 by Weekly Chart view since listed
- Support Zone 41.25 to 45.75 Price Band
- Resistance Zone 52.25 to 56.25 Price Band
- Bullish Cup & Handle formed by Resistance Zone neckline
- Volumes spiking intermittently by a close sync with avg traded qty
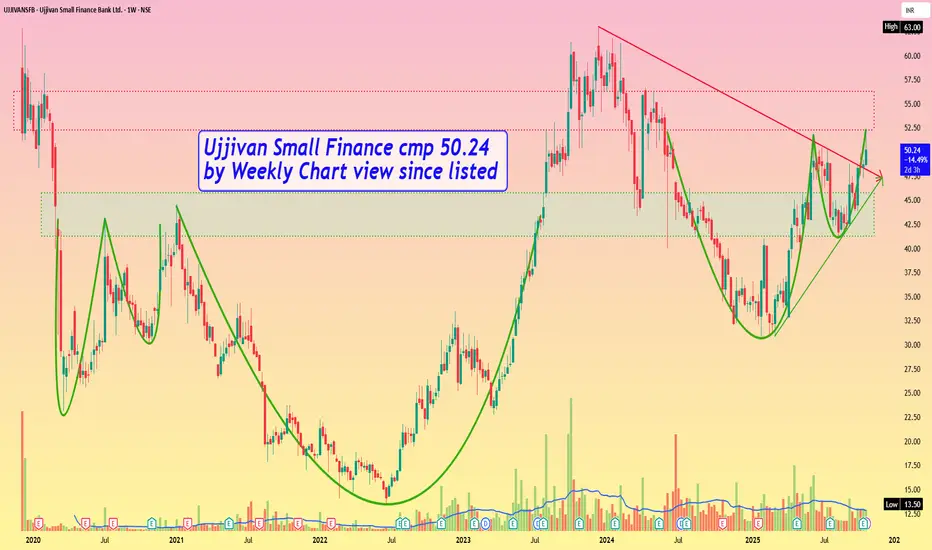
Trading Volume Spiking: Understanding Market Dynamics1. Causes of Trading Volume Spikes
Trading volume spikes are generally triggered by market-moving events, investor psychology, or technical market dynamics. These causes can be grouped into several categories:
a) Fundamental News Events
Fundamental news is one of the primary reasons for sudden spikes in trading volume. Market participants react to new information about a company, industry, or economy, leading to increased buying and selling activity. Key examples include:
Earnings Reports: When a publicly traded company releases quarterly or annual earnings, deviations from market expectations can trigger heavy trading. A strong earnings beat may cause buying volume to surge, while disappointing earnings can provoke panic selling.
Corporate Announcements: Mergers, acquisitions, dividends, or stock splits can trigger spikes as traders adjust positions based on anticipated impacts.
Economic Data Releases: Broader economic indicators such as unemployment rates, GDP growth, or inflation numbers can impact trading volume across sectors.
Policy Changes: Central bank rate announcements, government regulations, or geopolitical developments can also induce sudden spikes.
b) Technical Triggers
Many traders rely on technical analysis, using charts, indicators, and historical price patterns to make decisions. Certain price movements or indicator signals often trigger high-volume trades:
Breakouts and Breakdowns: When the price breaks through significant resistance or support levels, it often triggers a rush of orders from both retail and institutional traders.
Moving Averages and Indicators: Crossing key technical levels, such as the 50-day or 200-day moving average, can prompt automated or algorithmic trading to enter or exit positions.
Volume Confirmation Signals: Traders often look for volume spikes as confirmation of trend strength. A price move accompanied by unusually high volume is considered more reliable.
c) Market Sentiment and Psychology
Human behavior plays a large role in volume spikes. Fear, greed, and herd behavior can amplify trading activity:
Panic Selling or Buying Frenzy: Market participants may act collectively during periods of fear or exuberance, creating sudden surges in volume.
Speculation and Rumors: Even unverified news or market rumors can prompt significant spikes, as traders try to capitalize on potential opportunities.
d) Algorithmic and High-Frequency Trading
Modern markets are heavily influenced by algorithmic trading, which can amplify volume spikes. High-frequency trading (HFT) algorithms react in milliseconds to market signals, leading to bursts of buying or selling activity that may not reflect fundamental changes.
2. Interpreting Trading Volume Spikes
Volume spikes are not merely numerical anomalies; they carry deep implications for market participants. Understanding what a volume spike signifies is crucial for strategy development.
a) Confirmation of Price Movement
A spike in volume often confirms the strength of a price movement. For example:
A price surge with high volume indicates strong buying interest, suggesting the uptrend may continue.
Conversely, a price drop with high volume reflects strong selling pressure and can indicate a genuine downtrend.
Without significant volume, price movements may lack conviction and can be more prone to reversals.
b) Potential Trend Reversals
While high volume can confirm trends, extreme spikes can sometimes indicate trend exhaustion:
A rapid surge in volume after a prolonged price move may suggest that the market is overextended.
In some cases, this leads to a reversal, as traders take profits and new participants step in to bet against the trend.
c) Liquidity Insights
Volume spikes provide insight into market liquidity:
Higher volume generally improves liquidity, allowing larger trades to execute without significant price slippage.
Low volume during a spike, however, may indicate market thinness and volatility, making it riskier to trade large positions.
d) Institutional Activity
Unusually high volume often reflects institutional participation, such as hedge funds, mutual funds, or pension funds entering or exiting positions. These large trades can significantly influence price levels, especially in less liquid stocks.
3. Strategies for Traders During Volume Spikes
Traders and investors can use volume spikes strategically. Here are key approaches:
a) Momentum Trading
Momentum traders thrive on high-volume moves. A sudden increase in volume coupled with a breakout or breakdown can signal a strong directional trade opportunity. Traders often enter in the direction of the volume surge, expecting follow-through.
b) Volume-Based Confirmation
Technical analysts often use volume spikes as confirmation tools. For example:
Breakout Confirmation: A breakout above resistance accompanied by higher-than-average volume is more likely to sustain.
Trend Validation: Sustained trends confirmed by rising volume tend to be stronger and more reliable.
c) Contrarian Approach
Contrarian traders may interpret extreme volume spikes as signals of market exhaustion. After intense buying or selling, the market may be ripe for a pullback. This approach requires careful risk management.
d) Risk Management Adjustments
Volume spikes often coincide with higher volatility. Traders should adjust stop-loss levels, position sizes, and entry points to accommodate rapid price swings. Ignoring volume-related risk can result in significant losses.
4. Tools and Indicators for Monitoring Volume Spikes
Modern trading platforms provide a range of volume indicators to detect spikes and guide decisions:
Volume Bars: Basic histogram bars show volume per period and highlight anomalies relative to average volume.
On-Balance Volume (OBV): OBV measures cumulative buying and selling pressure, helping identify accumulation or distribution trends.
Volume Moving Averages: Traders often compare current volume against a 10-day or 20-day average to spot unusual spikes.
Volume-Price Trend (VPT): VPT combines volume and price changes to assess whether volume supports the direction of the trend.
These tools help traders distinguish between meaningful volume spikes and random market noise.
5. Case Studies of Trading Volume Spikes
Historical examples illustrate the significance of volume spikes:
Tech Stocks during Earnings Season: Companies like Apple or Microsoft often experience 3–5x average daily volume on earnings days, reflecting investor reaction to profits, guidance, or product announcements.
Market Crashes: During the 2020 COVID-19 market crash, trading volumes surged as investors panicked, providing liquidity but also amplifying volatility.
Cryptocurrency Market Events: Cryptocurrencies like Bitcoin often experience volume spikes during regulatory news or large institutional trades, resulting in rapid price swings.
6. Potential Pitfalls and Misinterpretations
While volume spikes are useful, traders must avoid over-reliance:
False Signals: Not all spikes indicate a trend continuation; some are caused by short-term speculative activity.
Thin Markets: Volume spikes in low-liquidity markets can exaggerate price moves and mislead traders.
Algorithmic Distortions: HFT can generate temporary spikes without any fundamental significance.
Proper analysis requires combining volume with other indicators such as price action, moving averages, and market news.
7. Conclusion
A trading volume spike is a key market signal reflecting a surge in trading activity, often triggered by fundamental events, technical movements, market sentiment, or institutional participation. For traders, volume spikes provide vital insights into the strength, liquidity, and sustainability of price movements. High volume confirms trends, signals potential reversals, and highlights institutional activity. However, spikes also bring risks due to higher volatility and potential market noise.
By integrating volume analysis into trading strategies, using technical indicators, and monitoring market news, traders can make more informed, strategic decisions. Whether you are a momentum trader, contrarian investor, or risk-conscious portfolio manager, understanding volume spikes is essential for navigating modern financial markets effectively.
Vardhman Special Steels cmp 296.45 by Daily Chart viewVardhman Special Steels cmp 296.45 by Daily Chart view
- Support Zone 273 to 286 Price Band
- Resistance Zone 308 to 322 Price Band
- Falling Resistance Trendline Breakout well sustained
- Rising Support Trendline well respected by continued uptrend
- Support Zone tested, broken, retested by fresh breakout probability
- Volume surging intermittently over past few days, in close sync with avg traded quantity
- Considerate Head & Shoulders with multiple Rounding Bottoms formed around Support Zone neckline
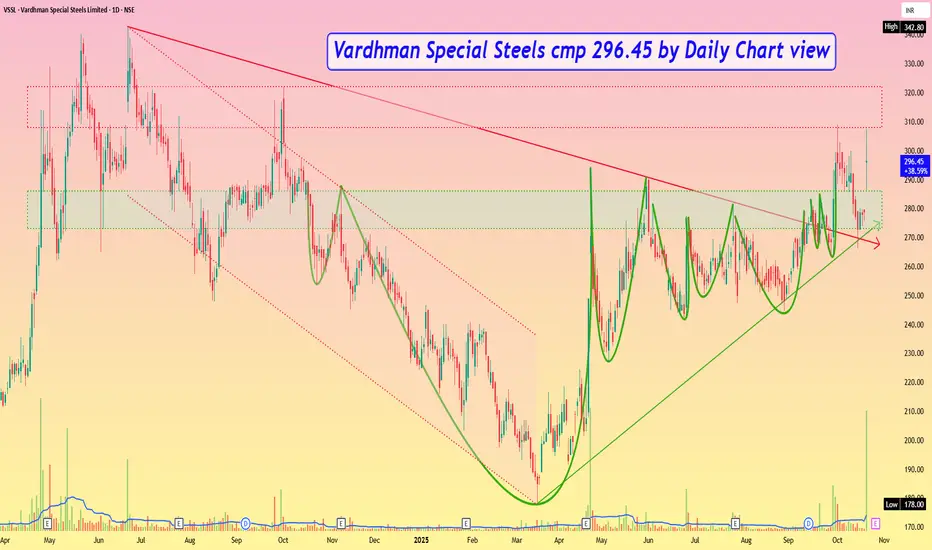
GMBREW: Broke Out Post Q2 FY26 with 10x Vol, Chart of the WeekA Small-Cap Brewery Stock NSE:GMBREW Broke Out With 10x Volume and Posted 61% Profit Growth in Q2 FY26. Let's Analyse in the "Chart of the Week"
As per the Latest SEBI Mandate, this isn't a Trading/Investment RECOMMENDATION nor for Educational Purposes; it is just for Informational purposes only. The chart data used is 3 Months old, as Showing Live Chart Data is not allowed according to the New SEBI Mandate.
Disclaimer: "I am not a SEBI REGISTERED RESEARCH ANALYST AND INVESTMENT ADVISER."
This analysis is intended solely for informational purposes and should not be interpreted as financial advice. It is advisable to consult a qualified financial advisor or conduct thorough research before making investment decisions.
Price Action Analysis:
Trend Structure:
- The stock has been trading in a well-defined ascending triangle pattern from March 2023 to September 2025
- Lower trendline support starts around 500 levels and has been holding consistently
- Upper resistance formed a symmetrical descending trendline from the August 2024 peak near 1,049
- The consolidation phase between 650-750 lasted approximately 12-14 months, indicating strong accumulation
Recent Breakout Dynamics:
- On October 9, 2025, the stock witnessed a powerful breakout above the descending resistance trendline
- The breakout candle closed at 894.45, representing a gain of 22% in a Week
- Price crossed above the Volume Weighted Average Price (VWAP) with conviction
- The breakout occurred exactly at the apex of the symmetrical triangle, a textbook technical setup
Base Formation:
- A solid base was formed between 650-750 levels from June 2024 to September 2025
- This 15-month consolidation created a strong platform for the next leg up
- The base shows higher lows, indicating persistent buying interest
- Multiple tests of the 700 level without breaking down confirmed strong institutional support
Volume Spread Analysis:
Volume Surge Characteristics:
- The breakout day witnessed volume of 11.88 million shares, representing approximately 10x the average Weekly volume
- Prior peak volume was recorded in July 2024 at around 11 million shares during a similar rally
- The volume spike confirms genuine institutional participation rather than retail speculation
- Volume during the consolidation phase remained subdued, typical of healthy base-building
Volume-Price Correlation:
- The recent volume expansion coincided with the Q2 FY25 earnings announcement
- Volume preceded the price breakout, suggesting informed accumulation
- Absence of distribution volume during the decline from 1,049 to 650 indicates strong hands holding positions
Support and Resistance Levels:
Key Support Zones:
- Immediate support: 850-860 (breakout point and previous resistance turned support)
- Secondary support: 780-800 (VWAP zone)
- Major support: 700-720 (top of the consolidation base)
- Critical support: 650 (lower boundary of the triangle pattern)
Key Resistance Levels:
- Immediate resistance: 900-920 (psychological level and minor supply zone)
- Major resistance: 1,000-1,049 (previous 52-week high from August 2024)
- Extended resistance: 1,150-1,200 (measured move from triangle breakout)
- Long-term resistance: 1,300-1,350 (Fibonacci extension based on prior rally)
Technical Pattern Recognition:
Symmetrical Triangle Breakout:
- The pattern took 18 months to form, indicating a significant accumulation phase
- Pattern reliability is high, given the strong volume confirmation
- The apex breakout timing increases the probability of follow-through momentum
Volume Price Analysis (VPA):
- The breakout exhibits classic VPA characteristics: rising prices on expanding volume
- No signs of climactic selling during the base formation
- Professional money accumulation is evident from the volume footprint
- Current setup suggests continuation rather than exhaustion
Sectoral Backdrop and Industry Analysis:
Indian Alcohol Sector Overview:
- The Indian alcohol market is estimated at USD 60.11 billion in 2025 and expected to reach USD 101.10 billion by 2032, exhibiting a CAGR of 7.7%
- India's growing middle class is becoming more affluent, driving increased alcohol consumption as disposable incomes rise
- India's total alcoholic beverage sector is the world's third largest, with yearly sales of $44 billion
- In India, beverage alcohol volumes rose 4% in the first half of 2024, driven by strong demand for premium-plus spirits
Growth Drivers:
- Premiumization trend as consumers upgrade to higher-quality spirits and beer
- Expanding retail distribution channels, including modern trade and e-commerce
- Rising disposable incomes and urbanization are creating a larger addressable market
- Changing social attitudes toward moderate alcohol consumption, especially among younger demographics
- Tourism and hospitality sector recovery post-pandemic, boosting on-premise consumption
Sector Risks and Challenges:
- Heavy regulatory environment with varying state-level policies on alcohol sales
- High taxation is impacting margins and affordability
- Licensing complexities and distribution restrictions in certain states
- Raw material price volatility affecting input costs
- Social stigma and health concerns are potentially limiting market expansion
Fundamental Analysis:
Recent Financial Performance:
- In Q2 FY26, net profit rose 61% year-on-year, with revenue growing 20% to ₹718 crore, while EBITDA margin expanded to 6.25% from 4.62%
- For H1 FY26, total revenue reached ₹1,356 crore, marking 13% growth, with net profit rising 30% to ₹61 crore
- Margins saw healthy growth at 24.9% compared to 18.9% last year
- The strong Q2 results were the primary catalyst for the recent breakout
Company Fundamentals:
- Market capitalization stands at approximately 2,042 crore with annual revenue of 679 crore and profit of 143 crore
- Promoter holding is strong at 74.4%, indicating management confidence
- The company has delivered moderate sales growth of 6.32% over the past five years
- GM Breweries operates with no debt and demonstrates good profit growth
Valuation Metrics:
- As of October 9, 2025, GM Breweries is trading at a discount of 16% based on median intrinsic value estimates
- The stock trades in the small-cap segment with relatively lower liquidity compared to large-cap peers
- Recent earnings surprise has likely re-rated the stock, but valuation remains reasonable relative to growth
- P/E multiple expansion likely as margins improve and profitability accelerates
Competitive Positioning:
- Compared to industry leaders, GM Breweries lacks strong brand value and has limited market coverage
- The company operates primarily in select states, providing regional focus but limiting nationwide presence
- Opportunity exists to expand distribution footprint and invest in brand building
- Focus on operational efficiency and margin expansion differentiates from competitors
Bull Case Arguments:
- Strong earnings momentum with 61% profit growth, indicating operational leverage
- Technical breakout from 18-month base supported by exceptional volume confirms institutional interest
- Favourable industry tailwinds with 7.7% sector CAGR supporting long-term growth
- Debt-free balance sheet provides financial flexibility for expansion
- High promoter holding at 74.4% aligns management interests with shareholders
- Current valuation at 16% discount to intrinsic value offers a margin of safety
Bear Case Considerations:
- Limited brand recognition compared to established industry players
- Restricted geographic presence limits growth potential
- Heavy regulatory oversight and taxation pose ongoing challenges
- Small-cap liquidity concerns may lead to higher volatility
- Dependence on discretionary consumer spending makes business cyclical
- Historical revenue growth of 6.32% over five years is modest
Monitoring and Review Parameters:
Key Metrics to Track:
- Quarterly revenue and profit growth rates versus expectations
- Margin expansion, sustainability and operating leverage
- Volume growth in key markets and product categories
- Market share gains or losses relative to competitors
- Any changes in promoter holding or institutional ownership patterns
Technical Review Points:
- Weekly closing price relative to the breakout level of 850
- Volume sustainability above 3-4 million shares daily average
- Formation of higher highs and higher lows to confirm an uptrend
- Any breakdown below 780 would invalidate the bullish thesis
- RSI and momentum indicators for early signs of exhaustion
Risk Triggers:
- Fundamental: Any quarterly earnings miss or margin compression
- Technical: Weekly close below 780 or breach of major support zones
- Sectoral: Adverse regulatory changes or significant tax increases
- Market: Broader market correction below key support levels affecting risk appetite
- Time-based: If the stock underperforms the sector or broader market for two consecutive quarters
Full Coverage on my Newsletter this Week
Keep in the Watchlist and DOYR.
NO RECO. For Buy/Sell.
📌Thank you for exploring my idea! I hope you found it valuable.
🙏FOLLOW for more
👍BOOST if you found it useful.
✍️COMMENT below with your views.
Meanwhile, check out my other stock ideas on the right side until this trade is activated. I would love your feedback.
As per the Latest SEBI Mandate, this isn't a Trading/Investment RECOMMENDATION nor for Educational Purposes; it is just for Informational purposes only. The chart data used is 3 Months old, as Showing Live Chart Data is not allowed according to the New SEBI Mandate.
Disclaimer: "I am not a SEBI REGISTERED RESEARCH ANALYST AND INVESTMENT ADVISER."
This analysis is intended solely for informational purposes and should not be interpreted as financial advice. It is advisable to consult a qualified financial advisor or conduct thorough research before making investment decisions.
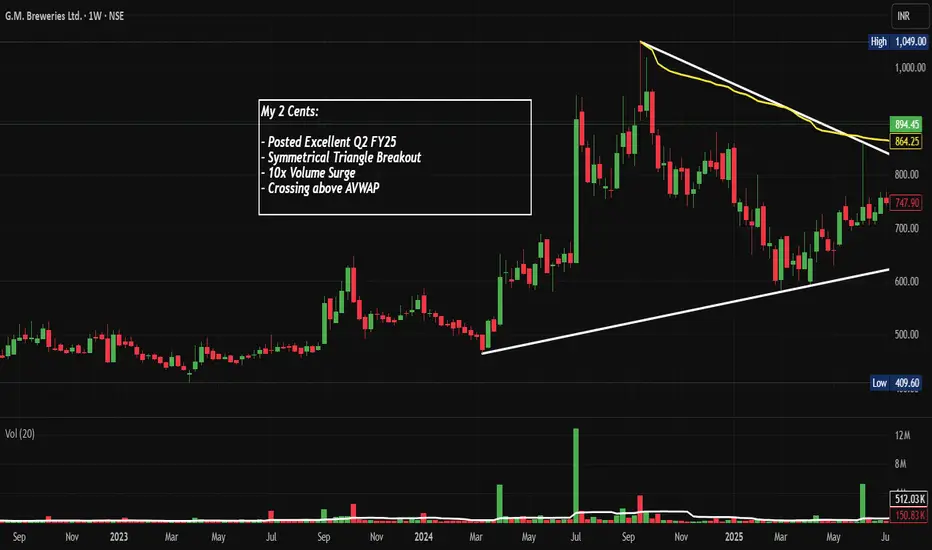
IZMO: From ₹6 to ₹671 - What's Next? Chart of the MonthNSE:IZMO Why This ₹671 Unknown Indian AI Factory Stock Could Be the Next Multibagger in 2025? Let's analyze in the "Chart of the Month"
As per the Latest SEBI Mandate, this isn't a Trading/Investment RECOMMENDATION nor for Educational Purposes; it is just for Informational purposes only. The chart data used is 3 Months old, as Showing Live Chart Data is not allowed according to the New SEBI Mandate.
Disclaimer: "I am not a SEBI REGISTERED RESEARCH ANALYST AND INVESTMENT ADVISER."
This analysis is intended solely for informational purposes and should not be interpreted as financial advice. It is advisable to consult a qualified financial advisor or conduct thorough research before making investment decisions.
Price Action:
- Current Price: ₹671.35 (as of Aug 31, 2025)
- 52-Week Range: ₹230.00 - ₹738.40
- Stock has demonstrated exceptional momentum with 11,000%+ returns since COVID lows
- Currently trading near all-time highs with strong volume confirmation
Volume Spread Analysis:
- Volume spike evident during recent breakout phases
- 13.5M volume this month, showing active institutional participation
- Volume pattern confirms genuine breakout above resistance zones
- Higher volume on up days indicates accumulation by smart money
Key Technical Levels:
Support Levels:
- Primary Support: ₹633.85 (previous resistance turned support)
- Secondary Support: ₹580-590 zone (trend line confluence)
- Critical Support: ₹520-540 (major demand zone)
Resistance Levels:
- Immediate Resistance: ₹738.40 (all-time high)
- Secondary Resistance: ₹800-850 (psychological levels)
- Extended Target: ₹950-1000 (measured move projection)
Base Formation:
- Multi-year base formation from 2020-2022 (₹20-80 range)
- Clean breakout above ₹100 marked the beginning of the current uptrend
- Stage 2 markup phase with consistently higher highs and higher lows
Technical Patterns Identified:
- Cup and Handle pattern completed on a monthly timeframe
- Ascending triangle breakout above ₹600
- Bull flag consolidation pattern near current levels
- Rising wedge formation within broader uptrend (caution signal)
Sectoral and Fundamental Backdrop:
Company Overview:
- NSE:IZMO is a global leader in automotive interactive marketing solutions, providing hi-tech automotive e-retailing solutions across North America, Europe, and Asia
- Founded by Dinanath Soni and Sanjay Vedprakash Soni in 1995, headquartered in Bangalore
Recent Catalysts:
- The company recently launched its Automotive AI Factory, a breakthrough innovation hub to accelerate AI adoption across the automotive industry
- The AI Factory can deliver enterprise-grade AI capabilities at 70-80% lower cost than Western markets
- The hub will deliver customized AI models that optimize pricing and operations while enhancing customer engagement
Financial Metrics:
- Market Cap: ₹1,000 Crores (up 64.5% in 1 year)
- Revenue: ₹234 Crores, Profit: ₹49 Crores
- Trading at 2.78 times book value and 19.6x P/E
- Promoter holding: 34.95%
Sectoral Trends:
- The automotive industry is increasingly adopting AI-driven solutions
- Digital transformation in automotive retail is accelerating post-COVID
- Growing demand for interactive marketing solutions globally
- India emerging as a cost-effective hub for AI and tech services
Key Risks:
- Recent Q1FY26 results showed a -5.52% QoQ revenue decline and -12.9% QoQ net profit decrease
- Concentration risk in the automotive sector
- Currency fluctuation risk due to international operations
Bullish Factors:
- Revolutionary AI Factory launch provides new growth avenue
- Strong technical breakout with volume confirmation
- Global leadership position in niche automotive marketing space
- Cost advantage in AI solutions delivery
- Multi-year base breakout suggesting sustainable uptrend
Risk Factors:
- Recent quarterly performance decline
- Elevated valuation levels
- Potential for profit-taking near all-time highs
- Sector-specific risks and economic sensitivity
Full Coverage on my Newsletter this Week
Keep in the Watchlist and DOYR.
NO RECO. For Buy/Sell.
📌Thank you for exploring my idea! I hope you found it valuable.
🙏FOLLOW for more
👍BOOST if you found it useful.
✍️COMMENT below with your views.
Meanwhile, check out my other stock ideas on the right side until this trade is activated. I would love your feedback.
As per the Latest SEBI Mandate, this isn't a Trading/Investment RECOMMENDATION nor for Educational Purposes, it is just for Informational purposes only. The chart data used is 3 Months old, as Showing Live Chart Data is not allowed according to the New SEBI Mandate.
Disclaimer: "I am not a SEBI REGISTERED RESEARCH ANALYST AND INVESTMENT ADVISER."
This analysis is intended solely for informational purposes and should not be interpreted as financial advice. It is advisable to consult a qualified financial advisor or conduct thorough research before making investment decisions.