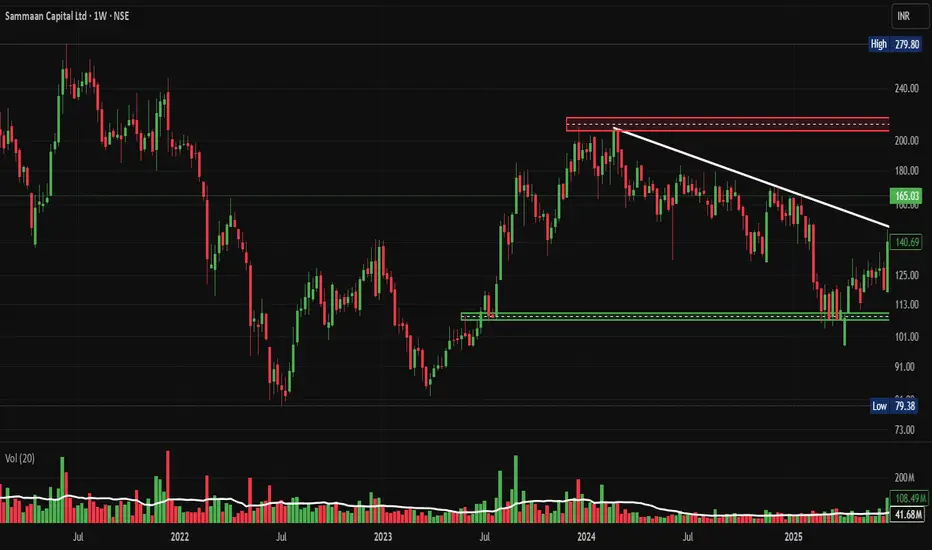
SAMMAAN Capital: Trendline Breakout, Chart of the weekFrom Housing Finance Giant to NBFC Phoenix: Why NSE:SAMMAANCAP Breakout Could Signal a Multi-Bagger Opportunity. Let's Analyse in the Chart of the Week.
As per the Latest SEBI Mandate, this isn't a Trading/Investment RECOMMENDATION nor for Educational Purposes; it is just for Informational purposes only. The chart data used is 3 Months old, as Showing Live Chart Data is not allowed according to the New SEBI Mandate.
Disclaimer: "I am not a SEBI REGISTERED RESEARCH ANALYST AND INVESTMENT ADVISER."
This analysis is intended solely for informational purposes and should not be interpreted as financial advice. It is advisable to consult a qualified financial advisor or conduct thorough research before making investment decisions.
Price Action Analysis:
Overall Trend Structure:
- The stock has been in a prolonged downtrend from its recent high of ₹260 in early 2022
- A major capitulation event occurred in July 2024, creating a panic low at ₹79.38
- Since the July 2024 low, the stock has formed a clear accumulation phase with higher lows
- Recent price action shows a strong breakout from a descending trendline that acted as resistance since early 2024
- Current price at ₹165.03 represents a 107% rally from the lows, indicating strong momentum recovery
Candlestick Patterns & Momentum:
- The most recent weekly candle shows a massive bullish engulfing pattern with a substantial body, suggesting strong buying conviction
- Price has cleared multiple resistance zones with authority, indicating institutional accumulation
- The breakout candle shows no upper wick, demonstrating aggressive buying and a lack of selling pressure at higher levels
- Consecutive green candles in recent weeks suggest sustained buying interest
- The price action exhibits characteristics of a potential trend reversal from bear to bull phase
Moving Averages & Dynamic Support:
- Price has reclaimed all major short-term moving averages
- The stock is now trading above its 50-week moving average
- A golden cross formation appears imminent as shorter-term MAs cross above longer-term MAs
- Previous resistance zones are now expected to act as support on pullbacks
Volume Spread Analysis:
Volume Profile:
- Massive volume spike on the latest breakout candle (462.74M vs average 86.92M) - approximately 5.3x the average volume
- This represents the highest volume since early 2022, indicating significant institutional participation
- Volume during the accumulation phase (July 2024 - September 2025) was relatively subdued, typical of smart money accumulation
- Previous high-volume events coincided with panic selling in 2022 and mid-2024
- Current volume expansion during upward movement is a classic sign of breakout validity
Volume-Price Correlation:
- The price-to-volume ratio shows a healthy correlation during the recent rally
- Higher volume on up days compared to down days indicates bullish sentiment
- The massive volume breakout suggests this move has strong institutional backing
- No signs of distribution (high volume on down days) at current levels
Volume Analysis Inference:
- The 5x volume expansion confirms a genuine breakout rather than a false move
- Smart money appears to be entering positions aggressively
- Retail participation is likely to increase given the media coverage and the F&O ban lifting
- Volume profile supports continuation of the uptrend in the near-term
Key Support & Resistance Levels:
Major Resistance Zones:
- R1 (Immediate): ₹175-180 - Minor psychological resistance
- R2 (Near-term): ₹200-220 - Previous consolidation zone and descending trendline confluence
- R3 (Major): ₹240-260 - Recent high zone with significant supply potential
- R4 (Psychological): ₹300 - Round number psychological barrier
Major Support Zones:
- S1 (Immediate): ₹150-155 - Recent breakout level, now acting as support
- S2 (Strong): ₹135-140 - Multiple touch points and previous resistance turned support
- S3 (Critical): ₹113-120 - Horizontal support zone with high volume node
- S4 (Ultimate): ₹100-105 - Major accumulation zone and swing low area
Key Price Levels to Watch:
- Breakdown level to watch: ₹145 (invalidation of bullish setup)
- Pivotal zone: ₹135-140 (must hold for bullish continuation)
- Stop-loss zone for longs: Below ₹130
Base Formation & Pattern Recognition:
Primary Base Structure:
- The base shows characteristics of a "Stage 1" accumulation base as per the Weinstein methodology
Secondary Patterns Identified:
- Descending Channel: From January 2024 to September 2025, the stock traded within a falling channel
- Breakout Pattern: Recent weekly candle broke above the descending trendline resistance with authority
- Double Bottom: A smaller double bottom formation exists at the ₹100-105 level (June-July 2025)
- Higher Low Sequence: Since the July 2024 bottom, the stock has made consistent higher lows - ₹79, ₹100, ₹130, ₹135
Pattern Implications:
- The quality of base formation (15 months) indicates strong institutional accumulation
Technical Indicators Assessment:
Trend Indicators:
- Price trading above descending trendline for the first time in 18 months
- Structure shifted from lower highs/lower lows to higher highs/higher lows
- Breakout above multi-month resistance confirms trend reversal
- Weekly timeframe showing a clear momentum shift
Volatility Indicators:
- Recent expansion in price range indicates increasing volatility
- Volatility expansion during upward movement is a bullish characteristic
- ATR (Average True Range) is likely expanding, providing better trading opportunities
Diversification Rules:
- Maximum NBFC/Financial sector exposure: 15-20% of portfolio
- Since Sammaan Capital is an NBFC, ensure other NBFC holdings don't exceed the sector limit
- Correlation check: Avoid overweight in stocks moving in tandem
- Rebalance if a single position grows beyond 10% due to appreciation
Risk Management Framework:
Technical Risk Factors:
- Breakout failure risk: 30% probability of pullback to ₹140-150
- False breakout risk: Volume sustenance needed for confirmation
- Resistance rejection risk: ₹220 zone has strong supply potential
- Trend reversal risk: Any weekly close below ₹130 invalidates the bullish thesis
- Volatility risk: NBFC stocks prone to sudden regulatory/news-driven moves
Risk Mitigation Strategies:
- Never invest more than planned position size, even if the setup looks perfect
- Use limit orders instead of market orders to avoid slippage
- Don't average down if SL is hit - accept loss and re-evaluate
- Keep a 30% cash reserve for better entry opportunities
- Use trailing stops religiously once in profit
- Maintain a trading journal to track decisions and learn from mistakes
Portfolio Risk Constraints:
- Maximum drawdown tolerance: 20% on this position
- Overall portfolio heat: Not more than 4-5% at risk across all open positions
- Correlation check: If market corrects 5%, financial stocks may correct 7-8%
- Sector concentration: Limit NBFC exposure even if multiple opportunities arise
- Black swan provision: Always keep an emergency exit plan
Risk Monitoring Checklist:
- Daily: Check if price respects support zones
- Weekly: Review volume patterns and trend integrity
- Monthly: Reassess fundamental drivers and news flow
- Quarterly: Deep-dive into earnings, asset quality, regulatory changes
- Event-driven: Monitor RBI policies, interest rate decisions, sector news
Exit Risk Management:
- Never hold through a major support breakdown, hoping for recovery
- If SL hit, stay away for 2-3 weeks before re-entry consideration
- Avoid revenge trading after the stop-loss trigger
- Book partial profits at predetermined levels - don't get greedy
- If the target is achieved faster than expected, evaluate for signs of exhaustion
Sectoral Analysis - NBFC & Housing Finance:
NBFC Sector Overview:
- NSE:SAMMAANCAP is a mortgage-focused non-banking financial company (NBFC) regulated by the Reserve Bank of India (RBI) and rated 'AA' by CRISIL and ICRA
- The NBFC sector has witnessed consolidation over the past 3 years post-COVID disruptions
- The regulatory framework has tightened with the RBI implementing scale-based regulations
- A favourable policy environment exists with a stable macroeconomic backdrop
- Housing finance remains a priority sector with government's push for affordable housing
Current Sector Dynamics:
- Interest rate cycle appears to be stabilising after aggressive hikes in 2022-2023
- Credit growth in retail segments (housing, LAP) remains robust at 15-18% YoY
- Asset quality concerns have moderated across the NBFC sector
- Competition is intensifying with banks offering competitive home loan rates
- Digital transformation and fintech partnerships reshaping distribution
Sector Growth Drivers:
- India's housing demand remains strong, driven by urbanization and nuclear families
- Under-penetrated mortgage market compared to developed economies (10% vs 50-70% mortgage-to-GDP)
- Government schemes like PMAY (Pradhan Mantri Awas Yojana) support affordable housing
- The Loan Against Property (LAP) segment is growing as businesses seek growth capital
- Co-lending arrangements between NBFCs and banks gaining traction
Sector Headwinds:
- Asset-liability management challenges for smaller NBFCs
- Rising cost of funds impacting margins
- Regulatory compliance costs are increasing
- Competition from banks with lower cost of funds
- Economic slowdown risks impacting borrower repayment capacity
Regulatory Environment:
- RBI's scale-based regulation framework implemented in October 2022
- Enhanced monitoring of large NBFCs (asset size >₹10,000 crore)
- Stricter provisioning and capital adequacy norms
- Focus on corporate governance and risk management frameworks
- Recent F&O ban lifting indicates regulatory confidence restoration
Fundamental Analysis:
Business Model & Operations:
- Incorporated in 2005, registered and regulated by the National Housing Bank (NHB), engaged in providing home loans, loans against property, corporate mortgage loans, lease rental discounting, and residential construction finance
- The company has adopted an asset-light business model with a differentiated origination strategy and proven co-lending execution across affordable housing and MSME segments
- Operates with co-lending partnerships - had 10 bank partnerships as of September 2024, with plans to increase to 12 by March 2025
- Product portfolio: Home Loans, Loan Against Property (LAP), Construction Finance, Lease Rental Discounting
Financial Performance Analysis
- Market capitalization: ₹13,670 crore; Revenue: ₹8,947 crore; Current year profit: -₹1,800 crore
- The company has delivered poor sales growth of -8% over the past five years
- Q1 FY26: Reported profit of ₹334 crore on total income of ₹2,400 crore; For FY25, posted loss of -₹1,807 crore on total income of ₹8,676 crore
- Recent profitability turnaround visible in quarterly results suggests business stabilization
- The company has a low interest coverage ratio, indicating higher financial leverage
Recent Corporate Developments:
- Abu Dhabi's IHC (International Holding Company) approved preferential allotment to buy 43.5% stake for ₹8,850 crore through Avenir Investment RSC Ltd, paving the way for IHC to assume promoter status
- This massive foreign investment indicates strong confidence in turnaround story
- Company rebranded from Indiabulls Housing Finance to Sammaan Capital to shed legacy issues
- Credit ratings upgraded by S&P and Moody's changed outlook to 'positive' from 'stable'; retained AA/Stable rating from CRISIL and ICRA
- F&O ban recently lifted, signalling renewed market confidence
Asset Quality & Risk Metrics:
- Assets Under Management of ₹12,777 crore as of September 2024
- Shift towards an asset-light model, reducing balance sheet risk
- Co-lending partnerships diversify risk and improve capital efficiency
- Need to monitor gross NPA and net NPA trends in upcoming quarters
- Provisioning coverage ratio and capital adequacy ratio are key metrics to watch
Valuation Metrics:
- PE ratio currently at 0, indicating the company was loss-making in the recent period
- Market cap growth of 3.48% the last 1 year - recent rally not fully reflected in this data
- Price-to-Book ratio likely attractive given low valuation during the distress period
- Current valuation at ₹165 offers asymmetric risk-reward if turnaround sustains
- Comparable NBFCs trading at 1.5-3x book value; Sammaan could rerate as profitability improves
Management & Corporate Governance:
- Company underwent significant management changes post-rebranding
- Abu Dhabi's IHC taking promoter status brings international credibility
- Focus on transparent reporting and governance improvements post legacy issues
- Strategic shift to asset-light model shows adaptive management
Competitive Position & Market Share:
- Competes with players like HDFC Ltd, LIC Housing Finance, PNB Housing, and Bajaj Housing Finance
- Differentiated strategy focusing on emerging geographies and affordable housing segment
- Co-lending model provides a competitive advantage in a capital-constrained environment
- Brand recall is still building after rebranding from Indiabulls
Key Strengths:
- Strong rating from CRISIL and ICRA (AA/Stable) indicates a robust credit profile
- ₹8,850 crore investment by Abu Dhabi's IHC validates business potential
- Asset-light model reduces capital requirements and improves ROE potential
- Regulatory compliance and risk management frameworks strengthened
- Experienced in affordable housing and MSME lending segments
Key Concerns & Risks:
- Historical loss of ₹1,800 crore in FY25 raises sustainability questions
- Poor revenue growth of -8.08% over 5 years indicates business challenges
- A low interest coverage ratio suggests vulnerability to interest rate volatility
- Ongoing investigations related to past operations remain overhang
- Execution risk in scaling up co-lending partnerships
- Asset quality deterioration risk if economic conditions weaken
Integrated Technical-Fundamental Outlook:
Confluence Factors Supporting Bullish Thesis:
- Technical breakout coinciding with fundamental catalysts (IHC investment, F&O ban lifting)
- Volume expansion confirming institutional interest aligning with ₹8,850 crore IHC investment
- 15-month base formation suggesting strong accumulation by informed investors
- Credit rating upgrades provide fundamental validation to the technical setup
- Quarterly profitability turnaround supporting higher valuation rerating
Scenario Analysis:
Bull Case Scenario
- IHC investment successfully closes and brings operational improvements
- Asset quality remains stable, and profitability is sustained in the upcoming quarters
- Co-lending partnerships expand as planned, driving AUM growth
Base Case Scenario
- Business stabilises with moderate growth in AUM and profitability
- Volatility remains elevated due to sector and stock-specific news
Bear Case Scenario
- Asset quality deterioration or operational challenges emerge
- IHC deal gets delayed or faces regulatory hurdles
- Technical breakdown below ₹145 leads to retest of ₹120-130 zone
- Macro headwinds (RBI policy tightening, economic slowdown) impact the sector
- Exit recommended if the weekly close is below ₹130
Critical Events to Monitor:
Next 3 Months:
- Completion of IHC preferential allotment and fund infusion
- Q2 FY26 earnings (October/November 2025) - profitability sustainability check
- Any regulatory updates or clarifications on past investigations
- Technical retest of ₹150-155 support zone and price reaction
Next 6 Months:
- Q3 FY26 earnings showing consistent profitability
- Expansion of co-lending partnerships (target 12 banks)
- AUM growth trajectory and disbursement trends
- NPA trends and provisioning coverage
- Technical breakout above ₹220 resistance
Next 12 Months:
- Full-year FY26 results demonstrating turnaround completion
- Market share gains in affordable housing and LAP segments
- ROE and ROA improvement trends
- PE multiple rerating towards industry average
Recommended Action Plan:
- Allocate 4-6% of portfolio with strict stop-loss discipline
- Book partial profits
- Trail remaining position
- Monitor quarterly results and credit metrics religiously
- Re-evaluate thesis if any fundamental red flag emerges
My 2 Cents:
The chart presents a textbook example of a turnaround setup with a well-defined 15-month base formation, decisive breakout on exceptional volume (5.3x average), and a clear risk-reward structure. The combination of descending channel breakout and momentum shift from lower lows to higher highs creates a compelling technical narrative.
NSE:SAMMAANCAP represents a high-risk, high-reward turnaround play backed by credible fundamental catalysts. The ₹8,850 crore investment by Abu Dhabi's IHC provides a strong validation of intrinsic value. The transition to an asset-light model, credit rating upgrades, and return to quarterly profitability suggest the worst may be behind. However, the legacy of past losses, low interest coverage, and ongoing investigations warrants cautious optimism and strict risk management.
Full Coverage on my Newsletter this Week
Keep in the Watchlist and DOYR.
NO RECO. For Buy/Sell.
📌Thank you for exploring my idea! I hope you found it valuable.
🙏FOLLOW for more
👍BOOST if you found it useful.
✍️COMMENT below with your views.
Meanwhile, check out my other stock ideas on the right side until this trade is activated. I would love your feedback.
As per the Latest SEBI Mandate, this isn't a Trading/Investment RECOMMENDATION nor for Educational Purposes; it is just for Informational purposes only. The chart data used is 3 Months old, as Showing Live Chart Data is not allowed according to the New SEBI Mandate.
Disclaimer: "I am not a SEBI REGISTERED RESEARCH ANALYST AND INVESTMENT ADVISER."
This analysis is intended solely for informational purposes and should not be interpreted as financial advice. It is advisable to consult a qualified financial advisor or conduct thorough research before making investment decisions.
Volumespreadanalysis
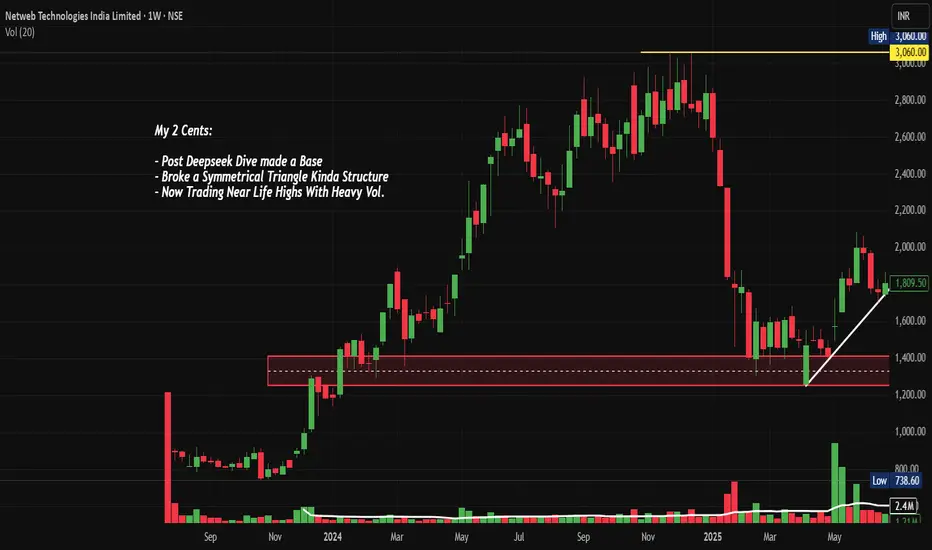
NETWEB: AI Infrastructure Goldmine ? Chart of the MonthNSE:NETWEB MarchingTowards 4,000: Is This the AI Infrastructure Goldmine You've Been Waiting For? Let's analyze in the "Chart of the Month".
As per the Latest SEBI Mandate, this isn't a Trading/Investment RECOMMENDATION nor for Educational Purposes; it is just for Informational purposes only. The chart data used is 3 Months old, as Showing Live Chart Data is not allowed according to the New SEBI Mandate.
Disclaimer: "I am not a SEBI REGISTERED RESEARCH ANALYST AND INVESTMENT ADVISER."
This analysis is intended solely for informational purposes and should not be interpreted as financial advice. It is advisable to consult a qualified financial advisor or conduct thorough research before making investment decisions.
Price Action Analysis:
- Current Price: ₹3,695.40
- 52-Week Range: ₹738.60 - ₹3,745.00
- Recent Performance: +64% gain in a Month with strong momentum
- Price structure shows consistently higher highs and higher lows pattern
- Stock has demonstrated remarkable resilience with a 380% rally from its 52-week low
Volume Spread Analysis:
- Volume surge visible during recent breakout phases
- High volume of 24.25M shares traded, indicating institutional participation
- Volume expansion coinciding with price breakouts confirms genuine buying interest
- Strong volume accumulation during consolidation phases suggests smart money positioning
Chart Patterns Identified:
- Symmetrical Triangle Breakout: Successfully broken above the triangle pattern
- Ascending Triangle: Multiple resistance tests followed by decisive breakout
- Flag and Pennant Patterns: Short-term consolidation after sharp moves
Key Technical Levels:
Support Levels:
- Immediate Support: ₹3,200 (recent consolidation zone)
- Strong Support: ₹2,800 (previous resistance turned support)
- Major Support: ₹2,400 (trendline support and psychological level)
- Critical Support: ₹2,000 (long-term ascending trendline)
Resistance Levels:
- Immediate Resistance: ₹3,745 (52-week high)
- Next Resistance: ₹4,000 (psychological round number)
- Extended Resistance: ₹4,400 (measured move projection)
- Long-term Resistance: ₹5,000
Base Formation:
- Primary Base: ₹1,200-₹1,600 range (established during deep consolidation)
- Secondary Base: ₹2,400-₹2,800 range (recent re-accumulation zone)
- The stock has clearly established a strong foundation above the ₹2,400 levels
Technical Indicators Assessment:
Momentum Indicators:
- RSI is in overbought territory but showing positive divergence
- MACD showing bullish crossover with expanding histogram
- Stochastic indicates strong upward momentum
- ADX suggesting strong trending behaviour
Moving Averages:
- Price trading well above all major moving averages
- 20 EMA, 50 EMA, and 200 EMA in perfect bullish alignment
- Strong uptrend confirmed by ascending moving averages
- No signs of trend reversal in the near term
Sectoral and Fundamental Backdrop:
AI Infrastructure Sector Outlook:
- India's IndiaAI Mission with ₹10,372 crore budget creating massive opportunities
- Government's push for sovereign AI infrastructure benefiting domestic players
- Global demand for AI computing infrastructure is experiencing exponential growth
- Limited domestic competition in the high-end computing solutions space
Company-Specific Fundamentals:
- Netweb's supercomputers have appeared 15 times across three entries in the global Top 500 supercomputers ranking
- The company is almost debt-free with a market cap of ₹20,936 crore
- Recent order wins worth ₹1,734 crore for IndiaAI Mission and ₹450 crore additional order
- Order pipeline of ₹4,142.1 crore as of June 2025, excluding new mandates
Key Growth Catalysts:
- Delivery of servers built on NVIDIA's Blackwell Architecture for India's Sovereign AI System
- Expanding presence in high-performance computing and AI systems
- Strong relationships with global technology partners
- Beneficiary of the government's Digital India and AI initiatives
Financial Performance Metrics:
- Strong revenue visibility from a large order book
- Improving profit margins due to premium product offerings
- Healthy cash flows supporting future expansion
- Zero debt structure providing financial flexibility
Strategic Outlook:
- Expect continued momentum driven by the AI infrastructure theme
- News-driven volatility possible around order execution updates
- Sector rotation into a technology infrastructure play is expected
- Quarterly results will be the key catalyst for sustained momentum
- India's AI infrastructure buildout is a multi-year opportunity
- The company is well-positioned to capture significant market share
Risk Factors to Monitor:
Technical Risks:
- Overbought conditions may lead to profit-taking
- High volatility expected given the stock's momentum
- Any break below ₹3,000 would signal trend weakness
Fundamental Risks:
- Execution risk on large government orders
- Competition from global players in AI infrastructure
- Technology disruption risks in a rapidly evolving sector
- Dependence on government spending cycles
Market Risks:
- Overall market correction could impact high-beta stocks
- Sector rotation away from technology themes
- Global supply chain disruptions affecting component availability
My 2 Cents:
NSE:NETWEB presents a compelling technical setup with strong fundamental support from India's push for AI infrastructure. The stock's breakout from multiple chart patterns, combined with substantial order wins and sector tailwinds, creates an attractive risk-reward proposition. However, position sizing and disciplined risk management remain crucial given the stock's high volatility and premium valuation.
Full Coverage on my Newsletter this Week
Keep in the Watchlist and DOYR.
NO RECO. For Buy/Sell.
📌Thank you for exploring my idea! I hope you found it valuable.
🙏FOLLOW for more
👍BOOST if you found it useful.
✍️COMMENT below with your views.
Meanwhile, check out my other stock ideas on the right side until this trade is activated. I would love your feedback.
As per the Latest SEBI Mandate, this isn't a Trading/Investment RECOMMENDATION nor for Educational Purposes; it is just for Informational purposes only. The chart data used is 3 Months old, as Showing Live Chart Data is not allowed according to the New SEBI Mandate.
Disclaimer: "I am not a SEBI REGISTERED RESEARCH ANALYST AND INVESTMENT ADVISER."
This analysis is intended solely for informational purposes and should not be interpreted as financial advice. It is advisable to consult a qualified financial advisor or conduct thorough research before making investment decisions.
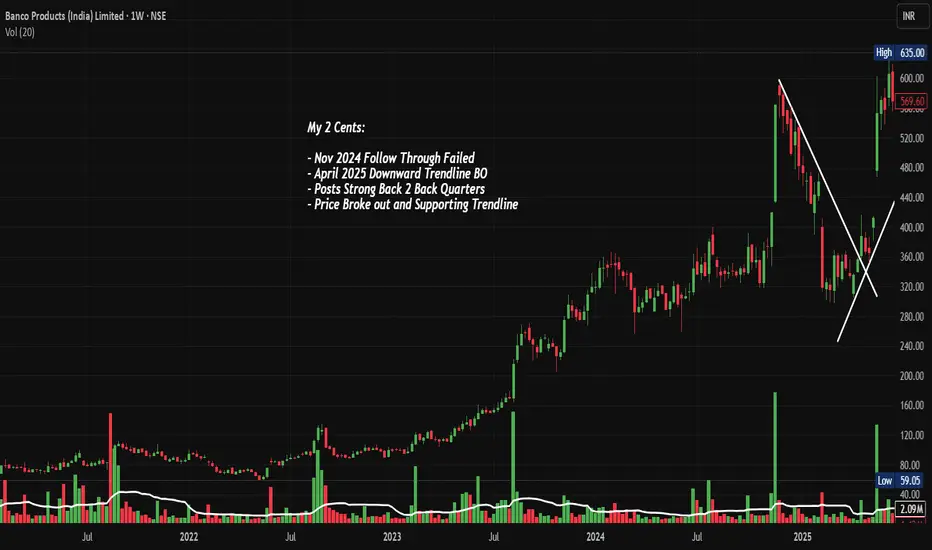
BANCOINDIA: BO after Consolidation, Chart of the WeekBanco Products Broke Out From a Consolidation, Continuing Its Massive Bull Run. Let's analyse in "Chart of the Week"
As per the Latest SEBI Mandate, this isn't a Trading/Investment RECOMMENDATION nor for Educational Purposes; it is just for Informational purposes only. The chart data used is 3 Months old, as Showing Live Chart Data is not allowed according to the New SEBI Mandate.
Disclaimer: "I am not a SEBI REGISTERED RESEARCH ANALYST AND INVESTMENT ADVISER."
This analysis is intended solely for informational purposes and should not be interpreted as financial advice. It is advisable to consult a qualified financial advisor or conduct thorough research before making investment decisions.
Price Action Analysis:
- Banco Products has completed a consolidation phase
- The stock has demonstrated exceptional momentum with a breakout above the ₹400 levels in April 2024
- Current trading price of ₹835.60 represents a gain of over 100% from the breakout point
- Price action shows strong institutional accumulation with increasing volumes during upward moves
Volume Spread Analysis
- Volume spikes are clearly visible during key breakout moments, particularly in Q2 2024
- The highest volume bars (green) coincide with price advances, indicating genuine buying interest
- Recent volume of 36.75M shares traded shows sustained institutional participation
- Volume patterns suggest smart money accumulation rather than retail speculation
Key Technical Levels:
Base Formation:
- Multi-year base formed between ₹100-400 levels from 2022 to early 2024
- This represents a classic cup and handle pattern on the weekly timeframe
- The base provided strong support and allowed for institutional accumulation
- Depth of base (approximately 18 months) suggests a strong foundation for future moves
Support Levels:
- Primary Support: ₹650-680 (previous resistance turned support)
- Secondary Support: ₹550-580 (50% retracement of recent rally)
- Major Support: ₹400-420 (breakout zone)
- Ultimate Support: ₹300 (top of multi-year base)
Resistance Levels:
- Immediate Resistance: ₹850-870 (current highs)
- Next Resistance: ₹950-1000 (psychological round number)
- Extended Resistance: ₹1200-1250 (measured move from base)
Position Sizing:
- Allocate a maximum of 3-5% of the portfolio to a single stock
- Use the pyramiding approach: 50% on initial entry, 25% on confirmation, 25% on extension
- Risk per trade should not exceed 2% of total capital
Risk Management Rules:
- Honour stop-losses strictly without emotional interference
- Book partial profits at predetermined levels
- Reduce position size if the stock shows signs of distribution
- Monitor sector rotation and overall market conditions
Sectoral and Fundamental Backdrop:
Auto Components Sector Overview:
- India's auto component industry is driving macroeconomic growth, with the market estimated to grow by USD 259.03 billion from 2025 to 2029 at a CAGR of 37%
- The auto components sector achieved 32.8% growth in FY24, with optimism for continued strong performance
- Export revenues could soar to $100 billion by 2030 from $21 billion in 2024, at a 30% CAGR
Fundamental Strengths of Banco Products:
- Market Cap of ₹11,952 crores with revenue of ₹3,379 crores and profit of ₹433 crores
- Leading manufacturer and exporter of automotive and industrial gaskets, heat shields, and sealing solutions since 1961
- Promoter holding at 67.88% shows strong management confidence
Growth Catalysts:
- Expanding electric vehicle segment creating new opportunities
- Sector attracted ₹2,45,771 crore FDI between April 2000 and December 2024
- Export potential with global OEM partnerships
- Various Indian auto component manufacturers are entering joint ventures with foreign companies for domestic production
Risks and Challenges:
- Commodity price fluctuations affecting margins
- Global economic slowdown impacting export demand
- Competition from Chinese manufacturers
- Trading at 9.17 times book value indicates a premium valuation
Market Outlook:
Short-term Outlook (1-3 months):
- Expect consolidation in the ₹750-870 range
- Watch any dip below ₹700
- Watch for a breakout above ₹870 for the next leg up
Medium-term Outlook (3-12 months):
- Sustained institutional interest expected
- Earnings growth should support price appreciation
Long-term Outlook (1-3 years):
- Export opportunities provide additional upside
- EV transition could create new revenue streams
- Sector leadership position makes it a preferred play in the auto components space
Full Coverage on my Newsletter this Week
Keep in the Watchlist and DOYR.
NO RECO. For Buy/Sell.
📌Thank you for exploring my idea! I hope you found it valuable.
🙏FOLLOW for more
👍BOOST if you found it useful.
✍️COMMENT below with your views.
Meanwhile, check out my other stock ideas on the right side until this trade is activated. I would love your feedback.
As per the Latest SEBI Mandate, this isn't a Trading/Investment RECOMMENDATION nor for Educational Purposes; it is just for Informational purposes only. The chart data used is 3 Months old, as Showing Live Chart Data is not allowed according to the New SEBI Mandate.
Disclaimer: "I am not a SEBI REGISTERED RESEARCH ANALYST AND INVESTMENT ADVISER."
This analysis is intended solely for informational purposes and should not be interpreted as financial advice. It is advisable to consult a qualified financial advisor or conduct thorough research before making investment decisions.
E2E: Base Formation and Trend Change Chart of the WeekNSE:E2E : Cloud Computing Giant Shows Strong Breakout After Trendline Breakout. Let's analyse in "Chart of the Week"
As per the Latest SEBI Mandate, this isn't a Trading/Investment RECOMMENDATION nor for Educational Purposes; it is just for Informational purposes only. The chart data used is 3 Months old, as Showing Live Chart Data is not allowed according to the New SEBI Mandate.
Disclaimer: "I am not a SEBI REGISTERED RESEARCH ANALYST AND INVESTMENT ADVISER."
This analysis is intended solely for informational purposes and should not be interpreted as financial advice. It is advisable to consult a qualified financial advisor or conduct thorough research before making investment decisions.
Price Action Analysis:
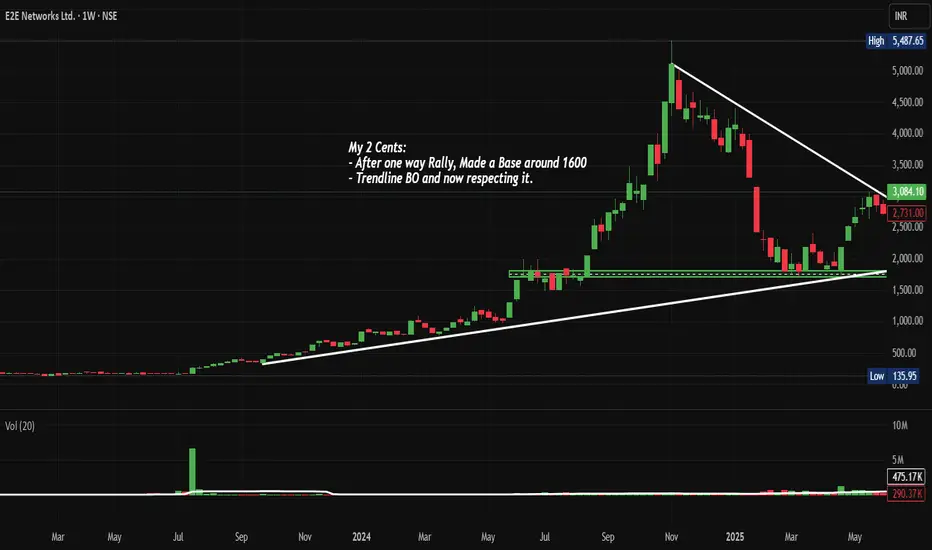
• Stock has formed a massive symmetrical triangle/wedge pattern
• Recent breakout above the upper trendline resistance around 2,900-3,000 levels
• Currently trading at 3,084.10 with strong momentum and above-average volume
• Price action shows a clear shift from consolidation to the trending phase
• Multiple higher lows formation during the consolidation phase indicates underlying strength
Volume Spread Analysis:
• Volume spike visible during the recent breakout, confirming genuine buying interest
• Volume at 813.46K vs average volume of 422.91K, indicating a 92% increase
• Consistent volume support during the base formation phase
• Volume-price confirmation suggests institutional participation
Key Technical Levels:
Support Levels:
• Primary Support: 2,700-2,800 (previous resistance turned support)
• Secondary Support: 2,400-2,500 (triangle breakout level)
• Major Support: 2,000-2,100 (psychological level and previous consolidation zone)
Resistance Levels:
• Immediate Resistance: 3,200-3,300 (next psychological level)
• Major Resistance: 3,500-3,600 (measured move target from triangle)
• All-time High: 5,487.65 (long-term target)
Technical Patterns:
• Symmetrical Triangle: 15-month consolidation pattern completed with upside breakout
• Base Formation: Strong base around 1,600 levels as mentioned in the chart annotation
• Ascending Triangle: Multiple retests of resistance with higher lows
• Volume Breakout Pattern: Confirmed with increased participation
Technical Assessment:
• Trendline Breakout: Clean break above descending trendline resistance
• Price Structure: Shift from consolidation to trending phase
• Momentum: Strong upward momentum post-breakout
• Support-Resistance Flip: Previous resistance becomes new support
Risk Management:
• Maximum Risk: 10% of position size
• Volatility Risk: High (small-cap IT stock)
• Sector Risk: Technology sector concentration
Risk Mitigation:
• Diversification across the IT portfolio
• Position sizing discipline
• Regular monitoring of technical levels
• Sector rotation consideration
Sectoral Analysis:
Industry Overview:
• India's data center industry is undergoing a major transformation, driven by the rapid rise in digital adoption, AI-driven workloads, and cloud computing adoption
• In 2025, E2E Cloud, a leading AI-centric cloud service provider, announced the launch of India's largest NVIDIA H200 GPU infrastructure
• Strong government support for Digital India initiatives
• Growing demand for cloud computing and AI/ML services
Sector Positioning:
• E2E network provides a full-stack AI/ML and GenAI cloud ecosystem designed for scalable, accessible, and cost-efficient deployment of large-scale compute clusters
• E2E Networks provides enterprise-grade GPU computing at a much lower cost by removing the complexity and extra expenses linked to global hyperscale providers
• Strategic focus on AI and machine learning infrastructure
• Competitive advantage in cost-effective cloud solutions
Growth Drivers:
• Increasing AI adoption across industries
• Digital transformation acceleration post-COVID
• Government push for data localization
• Growing startup ecosystem requiring cloud infrastructure
Fundamental Backdrop:
Financial Performance:
• Revenue: 159 Cr with Profit: 34.5 Cr (TTM)
• Revenue from operations slumped -12.63% YoY to Rs 36.11 crore in Q1 FY26
• Profit before tax (PBT) stood at Rs -2.84 crore in Q1 FY26, steeply lower than Rs 10.14 crore in Q1 FY25
• Strong profitability growth trajectory
Market Capitalization & Valuation:
• Mkt Cap: 6,166 Crore (up 10.8% in 1 year)
• Small Cap company classification
Shareholding Pattern:
• Promoter Holding: 40.6%
• Promoter holding has decreased over the last quarter: -3.00%
• Mutual Fund Shareholding in E2E Networks was 1.86%
• Strong promoter holding with some recent reduction
Business Model Strength:
• E2E CDN is a global content delivery network that distributes your content & web pages to end-users with minimal latency
• Asset-light scalable business model
• Recurring revenue from cloud services
• Growing customer base in the AI/ML segment
Key Concerns:
• Though the company is reporting repeated profits, it is not paying out a dividend
• High valuation multiples indicate growth expectations
• Small-cap volatility and liquidity concerns
• Intense competition from global cloud providers
Bull Case:
• Strong technical breakout
• Leadership position in Indian AI/ML cloud infrastructure
• Beneficiary of India's digital transformation
• Scalable business model with high growth potential
Bear Case:
• Expensive valuation with high growth expectations
• Competition from global hyperscalers
• Small-cap inherent volatility
• Dependency on the technology sector performance
Overall Assessment:
• Technically strong setup with favourable risk-reward
• Fundamentally positioned in a high-growth sector
• Regular monitoring required due to small-cap nature
Full Coverage on my Newsletter this Week
Keep in the Watchlist and DOYR.
NO RECO. For Buy/Sell.
📌Thank you for exploring my idea! I hope you found it valuable.
🙏FOLLOW for more
👍BOOST if you found it useful.
✍️COMMENT below with your views.
Meanwhile, check out my other stock ideas on the right side until this trade is activated. I would love your feedback.
As per the Latest SEBI Mandate, this isn't a Trading/Investment RECOMMENDATION nor for Educational Purposes, it is just for Informational purposes only. The chart data used is 3 Months old, as Showing Live Chart Data is not allowed according to the New SEBI Mandate.
Disclaimer: "I am not a SEBI REGISTERED RESEARCH ANALYST AND INVESTMENT ADVISER."
This analysis is intended solely for informational purposes and should not be interpreted as financial advice. It is advisable to consult a qualified financial advisor or conduct thorough research before making investment decisions.
VIMTALABS: Parallel Channel & Flag BO, Chart of the WeekNSE:VIMTALABS Explodes 50%: From Parallel Channel Prison to Trendline Freedom Post Q1 FY26 Flag Breakout. Let's analyse it in the "Chart of the Week"
As per the Latest SEBI Mandate, this isn't a Trading/Investment RECOMMENDATION nor for Educational Purposes; it is just for Informational purposes only. The chart data used is 3 Months old, as Showing Live Chart Data is not allowed according to the New SEBI Mandate.
Disclaimer: "I am not a SEBI REGISTERED RESEARCH ANALYST AND INVESTMENT ADVISER."
This analysis is intended solely for informational purposes and should not be interpreted as financial advice. It is advisable to consult a qualified financial advisor or conduct thorough research before making investment decisions.
Price Action Analysis:
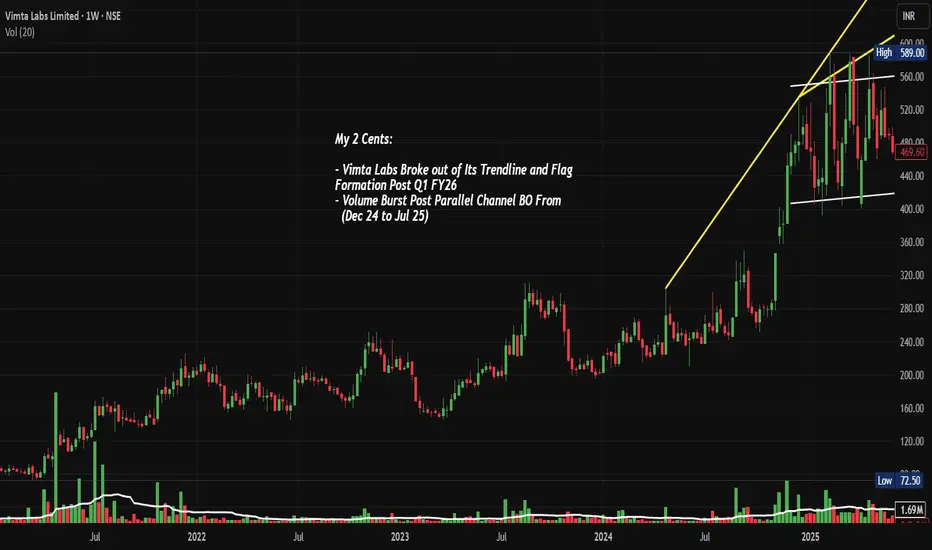
- Current Price: ₹887.20 (as per chart)
- 52-Week Range: ₹252 to ₹903
- Market Cap: ₹3,901 Crores
- Recent Performance: Stock has shown exceptional momentum with 171% returns in the past year
Volume Spread Analysis:
- Breakout Volume: Exceptional volume spike during the August 2025 breakout
- Volume Confirmation: Higher volumes on up-moves, lower on corrections
- Accumulation Phase: Steady volume during the consolidation phase indicates smart money accumulation
Chart Patterns:
- Long-term Ascending Trendline: Yellow trendline acting as dynamic support since May 2024
- Parallel Channel Breakout: Stock consolidated in a 6-month parallel channel (₹400-550) from December 2024 to July 2025
- Flag and Pennant Formation: Classic continuation pattern post Q1 FY26 results
- Volume Breakout: Massive volume surge accompanying the breakout, confirming genuine momentum
Key Technical Levels:
- Base Formation: ₹400-450 level established during Dec 2024 - Jul 2025 consolidation
- Primary Support: ₹550-600 (previous resistance turned support)
- Secondary Support: ₹500 (parallel channel upper boundary)
- Immediate Resistance: ₹700-750 (psychological levels)
- Final Resistance: ₹900-1000
Fundamental and Sectoral Backdrop:
Company Overview:
- Contract Research and Testing Organization serving biopharmaceutical, food, consumer goods, electronic, electrical, agrochemical, healthcare, and medical device sectors
Financial Performance:
- Q1 FY26 Results: Net profit rose 53.83% to ₹19 Crore, sales increased 30.29% to ₹98 crore
- Recent Quarter: EBITDA margins at 35.7%
- Debt Position: The Company is almost debt-free
Sector Dynamics:
- CRO/CRAMS Sector: Strong tailwinds from global pharmaceutical outsourcing
- Biologics Focus: Company expanding in high-growth biologics testing segment
- Regulatory Compliance: Successfully completed US FDA GCP certification
Other Highlights:
- Consistent revenue growth across quarters
- Strong margin expansion and operational efficiency
- Debt-free balance sheet providing financial flexibility
- Expanding service offerings in high-margin biologics
- Beneficiary of the global pharma outsourcing trend
Key Risk Factors:
- High valuation metrics post recent rally
- Dependence on the pharmaceutical sector cycles
- Regulatory compliance requirements
- Competition from larger CRO players
Market Sentiment:
- Recent 31% surge to hit a new 52-week high of ₹902, reflecting strong investor interest
- Strong institutional interest evidenced by consistent buying
- Positive analyst coverage post strong quarterly results
Full Coverage on my Newsletter this Week
Keep in the Watchlist and DOYR.
NO RECO. For Buy/Sell.
📌Thank you for exploring my idea! I hope you found it valuable.
🙏FOLLOW for more
👍BOOST if you found it useful.
✍️COMMENT below with your views.
Meanwhile, check out my other stock ideas on the right side until this trade is activated. I would love your feedback.
As per the Latest SEBI Mandate, this isn't a Trading/Investment RECOMMENDATION nor for Educational Purposes, it is just for Informational purposes only. The chart data used is 3 Months old, as Showing Live Chart Data is not allowed according to the New SEBI Mandate.
Disclaimer: "I am not a SEBI REGISTERED RESEARCH ANALYST AND INVESTMENT ADVISER."
This analysis is intended solely for informational purposes and should not be interpreted as financial advice. It is advisable to consult a qualified financial advisor or conduct thorough research before making investment decisions.
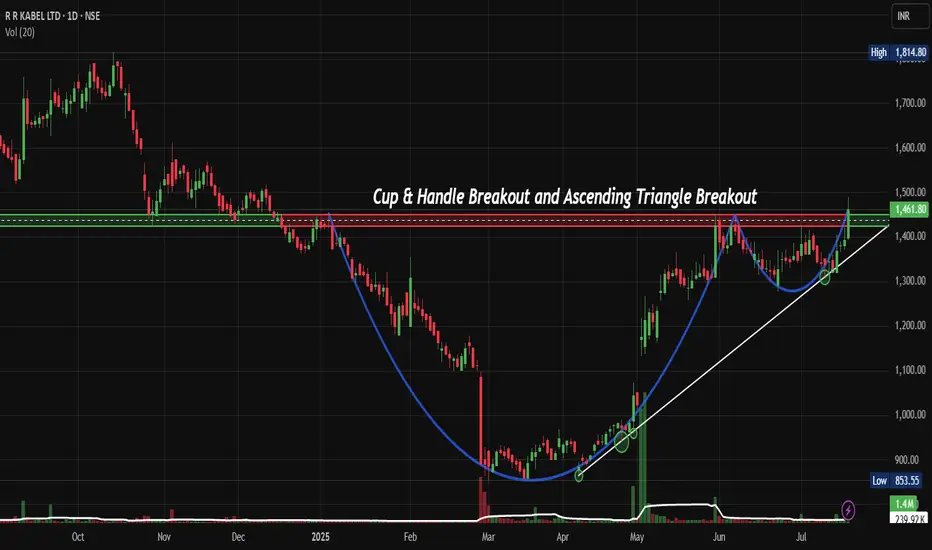
APOLLO: C&H and Rounding Bottom BO: Chart of the Week NSE:APOLLO : The Cup and Handle Breakout That Finally Delivered After Multiple False Starts with Rounding Bottom Breakout on Daily TF Let's Analyze it in the Chart of the Week.
As per the Latest SEBI Mandate, this isn't a Trading/Investment RECOMMENDATION nor for Educational Purposes; it is just for Informational purposes only. The chart data used is 3 Months old, as Showing Live Chart Data is not allowed according to the New SEBI Mandate.
Disclaimer: "I am not a SEBI REGISTERED RESEARCH ANALYST AND INVESTMENT ADVISER."
This analysis is intended solely for informational purposes and should not be interpreted as financial advice. It is advisable to consult a qualified financial advisor or conduct thorough research before making investment decisions.
Price Action:
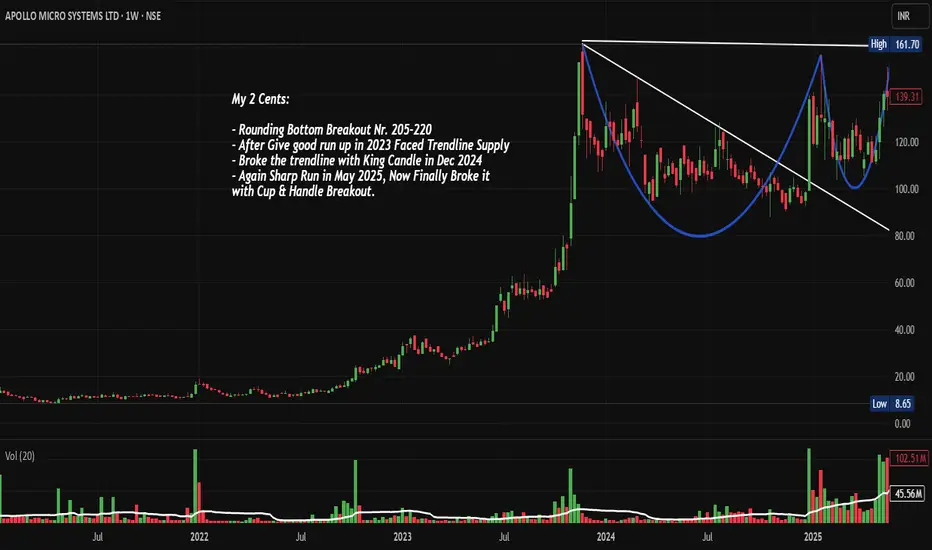
• The chart reveals a sophisticated Cup and Handle pattern formation spanning from Late-2023 to August 2025, with the "cup" forming between 205-160 levels and the "handle" consolidating around the 180-200 zone
• Multiple breakout attempts were witnessed - first in December 2024 with a King Candle formation, followed by another sharp rally in May 2025, both failing to sustain above the descending trendline
• The current August 2025 breakout represents the third and most convincing attempt, breaking through both the descending resistance trendline and the horizontal resistance at 205-220 levels
• Volume surge during the current breakout (119.95M vs average 54.33M) confirms institutional participation and validates the breakout authenticity
• The curved line clearly marks the rounding bottom formation, indicating a gradual shift from bearish to bullish sentiment
Volume Spread Analysis:
Volume Pattern Insights:
• Exceptional volume breakout with nearly 2.2x average daily volume during the recent surge
• Volume accumulation visible during the cup formation, indicating smart money participation
• Low volume during handle formation, suggesting healthy consolidation
• Volume expansion coinciding with price breakout confirms institutional buying
Key Support and Resistance:
• Immediate Support Zones:
- Primary: 220-225 (previous resistance turned support)
- Secondary: 200-205 (handle formation base)
- Major: 180-185 (cup formation low)
• Critical Resistance Levels:
- Near-term: 250-260 (measured move target from cup depth)
- Intermediate: 280-290 (Fibonacci extension 1.618 level)
- Long-term: 320-340 (cup and handle pattern target)
• Base Formation: Strong accumulation base established between 160-220 over 18+ months
Multi-Pattern Technical Setup:
• Cup and Handle Pattern: Classic bullish continuation pattern with 18-month formation period
• Descending Triangle Breakout: Successfully breached the falling trendline resistance
• Rounding Bottom: Long-term reversal pattern indicating strong institutional accumulation
• Volume Breakout Pattern: Exceptional volume expansion confirming price breakout validity
Fundamental and Sectoral Backdrop:
Latest Financial Performance:
• Net profit surged 126% to Rs 19 crore in Q1 FY2026 compared to Rs 8 crore in Q1 FY2025
• Revenue growth of 46.5% to Rs 134 crore versus Rs 91 crore in the previous year, same quarter
• Quarterly growth basis shows a 32.21% jump in net profits since last quarter
• Market capitalization stands at approximately Rs 7,854 crores, reflecting strong market confidence
Strategic Business Positioning:
• Company is involved in more than 150 indigenous defence programs and 60 DcPP (Defence Capital Procurement Policy) programs as a sub-system partner
• Specializes in ruggedized electronic hardware and software solutions for critical sectors
• Strong focus on import substitution and Atmanirbhar Bharat initiatives
• Diversified client base including DRDO, HAL, BEL, and other major defence contractors
Sector Momentum Analysis:
• Apollo Micro Systems gained 14.6% on August 22, 2025, demonstrating resilience amid market fluctuations
• Stock has significantly outperformed the broader market year-to-date, reflecting strong performance in the Aerospace & Defence sector
• Defence budget allocation increases continue to provide sectoral tailwinds
• Growing focus on indigenous defence manufacturing creates long-term opportunities
Market Participation Analysis:
• High institutional interest is evident from volume patterns
• Retail participation is likely to increase given the breakout visibility
• Options activity expected to increase as the stock approaches higher price levels
• Potential inclusion in small-cap/midcap indices could trigger passive fund buying
Risk Assessment and Scenario Analysis:
Technical Risk Factors:
• Failed breakout history (December 2024 and May 2025) suggests caution is required
• High beta nature means increased volatility during market corrections
• Potential for profit booking at psychologically important 250 levels
• Need for sustained volume to validate the breakout authenticity
Fundamental Risk Considerations:
• Defence sector dependency on government policy changes and budget allocations
• Long procurement cycles are typical in defence contracts, affecting quarterly results
• Competition from established defence majors and emerging players
• Currency fluctuation impact on imported components and raw materials
Full Coverage on my Newsletter this Week
Keep in the Watchlist and DOYR.
NO RECO. For Buy/Sell.
📌Thank you for exploring my idea! I hope you found it valuable.
🙏FOLLOW for more
👍BOOST if you found it useful.
✍️COMMENT below with your views.
Meanwhile, check out my other stock ideas on the right side until this trade is activated. I would love your feedback.
As per the Latest SEBI Mandate, this isn't a Trading/Investment RECOMMENDATION nor for Educational Purposes, it is just for Informational purposes only. The chart data used is 3 Months old, as Showing Live Chart Data is not allowed according to the New SEBI Mandate.
Disclaimer: "I am not a SEBI REGISTERED RESEARCH ANALYST AND INVESTMENT ADVISER."
This analysis is intended solely for informational purposes and should not be interpreted as financial advice. It is advisable to consult a qualified financial advisor or conduct thorough research before making investment decisions.
Cupid: Past Multibagger Forming Rounding Bottom BreakoutFrom ₹10 to ₹150: How CUPID Stock Became a Multibagger Dream and What's Next. Let's analyse and Deep Dive into my Chart of the Week Idea.
Price Action Analysis:
Long-term Trend Analysis:
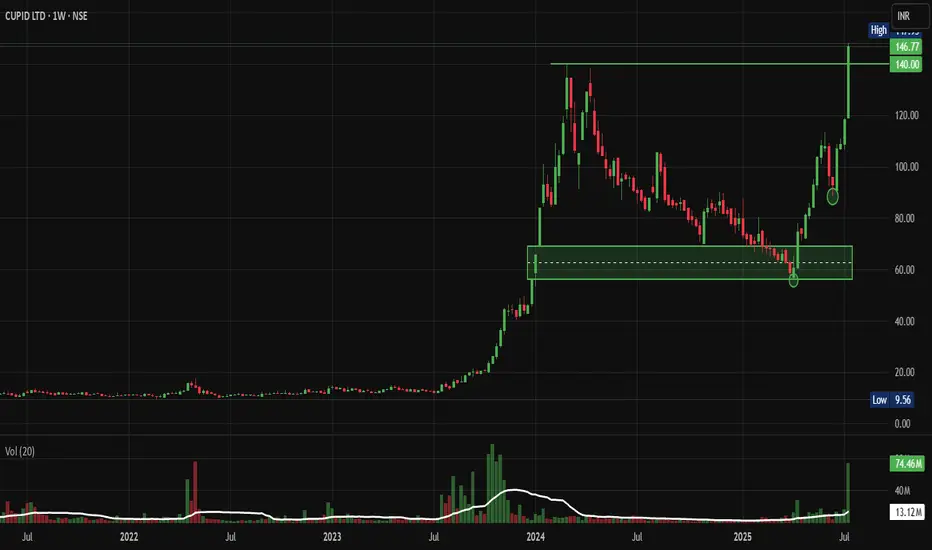
- Primary Trend: Strongly bullish multi-year uptrend since 2023
- Trend Structure: Classic accumulation-markup-distribution pattern visible
- Price Progression: Massive rally from ₹10 levels in 2023 to ₹145+ levels
- Current Phase: Potential early stage of renewed markup phase after consolidation
Volume Spread Analysis:
Volume Profile Assessment:
- Accumulation Phases: High volume during the 2023-2024 markup phase
- Distribution Evidence: Volume spike during 2024 highs suggesting profit-taking
- Current Volume: Recent volume expansion (74.46M) confirming breakout momentum
- Volume Trend: Healthy volume participation during the current breakout phase
Volume-Price Relationship:
- Positive Correlation: Rising prices accompanied by expanding volume
- Breakout Validation: Current breakout supported by above-average volume
- Distribution Concerns: Previous high volume at peaks indicated selling pressure
Key Price Levels:
Support Levels:
- Immediate Support: ₹95-100 (recent consolidation base)
- Critical Support: ₹80-85 (previous resistance turned support)
- Major Support: ₹65-70 (rectangle pattern lower boundary)
- Ultimate Support: ₹50-55 (long-term trend line support)
Resistance Levels:
- Key Resistance: ₹145-150 (previous highs)
- Major Resistance: ₹150-155
- Target Extension: ₹170-180 (measured move projection)
Technical Indicators Assessment:
Trend Indicators:
- Moving Averages: Price clearly above major moving averages, indicatinga bullish bias
- Trend Strength: Strong upward trajectory since the consolidation base
- Momentum: Building positive momentum after prolonged consolidation
Trade Setup & Strategy:
Primary Long Setup:
- Entry Strategy: Buy on dips to ₹115-120 support zone
- Confirmation: Entry above ₹145 for momentum traders
Alternative Strategies:
Conservative Approach:
- Entry: Wait for pullback to ₹100-105 levels
- Timeframe: Medium to long-term holding period (Weekly Charts)
- Risk Profile: Lower risk, moderate reward
Aggressive Approach:
- Entry: Immediate entry at current levels (₹145)
- Timeframe: Short to medium-term momentum play (Daily Charts)
- Risk Profile: Higher risk, higher reward potential
Entry and Exit Levels:
Entry Zones:
- Zone 1: ₹115-120 (Primary entry for dip buyers)
- Zone 2: ₹145-150 (Momentum breakout entry)
- Zone 3: ₹100-105 (Deep pullback opportunity)
Target Levels:
- Target 1: ₹150-155 (Short-term objective)
- Target 2: ₹160-165 (Medium-term target based on pattern)
- Target 3: ₹180-190 (Long-term extension target)
- Ultimate Target: ₹200+ (Bull market extension)
Exit Strategy:
- Profit Booking: Book 30% at Target 1, 40% at Target 2, and the remaining at Target 3
- Trailing Stop: Implement trailing stop-loss above ₹140
- Time Stop: Review position if targets are not achieved in 8-12 months
Stop-Loss Strategy:
Stop-Loss Levels:
- Aggressive Stop: ₹110 (for entries around ₹120)
- Moderate Stop: ₹100 (for swing traders)
- Conservative Stop: ₹85 (for long-term investors)
Stop-Loss Management:
- Initial Risk: Limit to 8-10% of the entry price
- Trailing Mechanism: Move stop-loss to breakeven after 15% gains
- Pattern Stop: Below ₹95 invalidates the breakout setup
- Time-based Stop: Exit if below ₹110 for more than 2 weeks
Position Sizing & Risk Management:
Position Sizing Guidelines:
- Conservative Investors: 2-3% of portfolio
- Moderate Risk Takers: 4-5% of portfolio
- Aggressive Traders: 6-8% of portfolio (maximum)
- Sectoral Exposure: Limit total pharma/healthcare exposure to 15-20%
Risk Management Framework:
- Maximum Loss: Limit loss to 2% of total portfolio per trade
- Diversification: Don't concentrate more than 10% in a single stock
- Sector Allocation: Balance with other defensive sectors
- Time Diversification: Stagger entries over 2-3 weeks
Portfolio Integration:
- Correlation Check: Monitor correlation with other pharma stocks
- Sector Rotation: Consider the pharma sector cycle and rotation
- Market Cap Allocation: Balance small-cap exposure with large-caps
- Liquidity Consideration: Account for small-cap liquidity constraints
Risk Assessment:
Technical Risks:
- Failed Breakout: Risk of false breakout below ₹115
- Distribution Pattern: High volume at peaks may indicate selling
- Overbought Conditions: Rapid rise may lead to consolidation
- Support Breakdown: Break below ₹95 would be technically negative
Fundamental Risks:
- Valuation Concerns: High PE ratio of 96+ indicates premium valuation
- Sales Decline: The Recent 7% sales decline raises growth concerns
- Sector Competition: Increasing competition in the contraceptive market
- Regulatory Changes: Healthcare sector regulatory modifications
Market Risks:
- Small-Cap Volatility: Higher volatility compared to large-caps
- Liquidity Risk: Potential liquidity issues during market stress
- Sentiment Risk: Healthcare sector sentiment shifts
- Global Economic: Impact of global economic conditions on exports
Company Overview & Fundamental Backdrop:
Business Profile:
- NSE:CUPID is India's premier manufacturer of male and female condoms, personal lubricant, and IVD kits, established in 1993
- The company manufactures and exports contraceptives, including male and female condoms, and medical devices, with a focus on sexual health and reproductive safety, serving both domestic and international markets, supplying high-quality products to governments and NGOs
- Market capitalization: ₹3,940 crores as of July 2025, classified as a Small Cap company
Financial Performance:
- Current valuation metrics: PE ratio of 96.3 and PB ratio of 11.5
- Recent performance: Sales declined by 7.24% to Rs 61 crore in Q4 FY25 versus Rs 66 crore in Q4 FY24; however, net profit rose 2.71% to Rs 41 crore for FY25
- Long-term returns: The stock has delivered 133% returns in the last 3 years
Sectoral Growth Outlook:
- The Indian contraceptive devices market is expected to grow at a CAGR of 6.2-6.3% from 2025 to 2030
- Market size estimated at USD 264.01 million in 2025, expected to reach USD 377.61 million by 2030, at a CAGR of 7.42%
- India's pharmaceutical sector aims to grow from the current US$50 billion to US$450 billion by 2047, with India being the 3rd largest producer of drugs globally
Monitoring Parameters:
What to Look Closely at Technically?
- Weekly Close: Monitor weekly closes above ₹115 for trend continuation
- Volume Trends: Watch for volume expansion on up-moves
- Relative Strength: Compare performance with the Nifty Healthcare Index
What to Look Closely at Fundamentally?
- Quarterly Results: Track revenue growth and margin expansion
- Order Book: Monitor new contract wins and export orders
- Sector Trends: Keep track of contraceptive market growth
- Management Commentary: Follow management guidance and outlook
Now, when to exit?
- Technical Breakdown: Close below ₹95 for two consecutive days
- Volume Reversal: High volume selling at resistance levels
- Fundamental Deterioration: Significant decline in business metrics
- Sector Weakness: Broad-based healthcare sector underperformance
So, My Take:
NSE:CUPID presents a compelling technical setup with a confirmed breakout from a year-long consolidation pattern. The stock has transformed from a ₹10 stock to a multibagger, and current technical indicators suggest potential for further upside. However, premium valuation and recent sales decline warrant careful risk management. The trade offers an attractive risk-reward profile for investors willing to accept small-cap volatility in exchange for participation in a growing healthcare subsector.
Keep in the Watchlist and DOYR.
NO RECO. For Buy/Sell.
📌Thank you for exploring my idea! I hope you found it valuable.
🙏FOLLOW for more
👍BOOST if you found it useful.
✍️COMMENT below with your views.
Meanwhile, check out my other stock ideas on the right side until this trade is activated. I would love your feedback.
Disclaimer: "I am not a SEBI REGISTERED RESEARCH ANALYST AND INVESTMENT ADVISER."
This analysis is intended solely for informational and educational purposes and should not be interpreted as financial advice. It is advisable to consult a qualified financial advisor or conduct thorough research before making investment decisions.
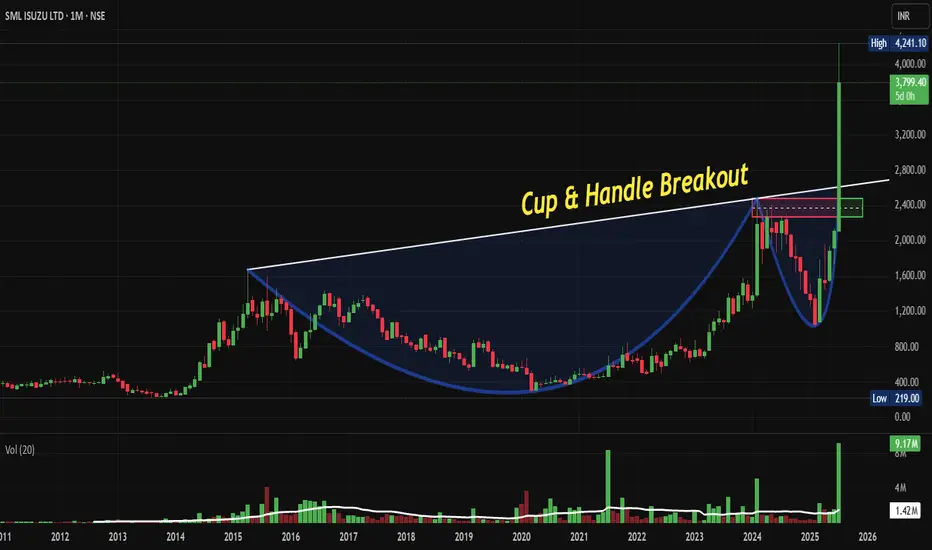
SMLISUZU: Explosive Cup and Handle Breakout, Chart of the Month From Years of Consolidation to Explosive Breakout: Why NSE:SMLISUZU Cup & Handle Pattern Could Deliver Multi-Bagger Returns. Let's Deep Dive into "Chart of the Month"
Price Action Analysis:
- Current trading price is approximately ₹3,799.40
- The stock has demonstrated a textbook Cup & Handle formation spanning over a decade (2015-2025)
- Post-breakout momentum shows strong bullish continuation with healthy volume expansion
- Recent breakout above the ₹2,400 breakout level indicates institutional accumulation
Volume Spread Analysis:
- Volume spike during the 2024-2025 breakout phase confirms genuine institutional interest
- Average daily volume has increased significantly from historical levels
- Volume pattern shows healthy distribution during consolidation phases and accumulation during breakouts
- Recent volume bars indicate sustained buying interest at higher levels
Key Technical Levels:
Base Formation:
- Primary base formed between 2020-2023 at ₹400-800 levels
- Secondary base consolidation occurred in 2023-2024 around ₹1,200-1,600 range
- The decade-long cup formation created a strong foundation for the current uptrend
Support Levels:
- Immediate support: ₹3,200-3,400 (recent consolidation zone)
- Strong support: ₹2,400-2,600 (cup breakout level)
- Critical support: ₹1,800-2,000 (previous resistance turned support)
- Long-term support: ₹1,200-1,400 (base formation)
Resistance Levels:
- Immediate resistance: ₹4,200-4,400 (psychological round number)
- Next resistance: ₹4,800-5,000 (projected target based on cup depth)
- Long-term target: ₹6,000+ (measured move from cup formation)
Technical Pattern:
Cup & Handle Pattern
- Formation period: 2015-2025 (10-year formation)
- Cup depth: Approximately ₹1,800 (from ₹2,400 high to ₹600 low)
- Handle formation: 2024-2025 consolidation
- Breakout confirmation: Volume expansion above ₹2,400
Moving Average Alignment:
- Price trading above all major moving averages
- Strong uptrend with moving averages in bullish sequence
- No signs of trend reversal in the immediate term
Trade Setup:
Entry Levels:
- Aggressive entry: ₹3,600-3,700 (current market price on minor dips)
- Conservative entry: ₹3,200-3,400 (on pullback to support)
- Accumulation zone: ₹2,800-3,200 (for long-term positions)
Exit Levels:
- Target 1: ₹4,500-4,700 (25-30% upside)
- Target 2: ₹5,500-5,800 (50-60% upside)
- Target 3: ₹6,500+ (multi-bagger potential)
Stop-Loss Strategy:
- For aggressive entries: ₹3,100 (8-10% risk)
- For conservative entries: ₹2,800 (12-15% risk)
- Trailing stop: Use a 20% trailing stop once the position moves 30% in favour
Position Sizing & Risk Management:
Position Sizing Guidelines
- Conservative investors: 2-3% of portfolio
- Moderate risk investors: 3-5% of portfolio
- Aggressive investors: 5-8% of portfolio (maximum recommended)
Risk Management Framework
- Never risk more than 2% of the total portfolio on a single trade
- Use position sizing formula: (Portfolio Risk ÷ Trade Risk) × 100
- Implement pyramid buying on pullbacks to support levels
- Book partial profits at each target level (33% at each target)
Portfolio Allocation Strategy:
- Core holding: 60% of position for long-term (2-3 years)
- Trading position: 40% for swing trades and profit booking
- Rebalance quarterly based on technical developments
Sectoral & Fundamental Backdrop:
Commercial Vehicle Sector Overview:
- The Commercial Vehicles market in India is projected to grow by 2.13% (2025-2030), resulting in a market volume of 1,165.00k vehicles in 2030
- India's commercial vehicle industry is gearing up for a modest recovery, with ICRA forecasting a 3-5 per cent year-on-year growth in wholesale volumes for FY26
- The India Commercial Vehicles Market size is estimated at 51.09 billion USD in 2025, and is expected to reach 62.95 billion USD by 2029, growing at a CAGR of 5.36%
Industry Dynamics:
- Infrastructure development is driving demand for commercial vehicles
- The government's focus on road construction and the logistics sector
- The e-commerce boom is increasing last-mile delivery vehicle demand
- Replacement demand cycle supporting steady growth
Company Fundamentals:
- Net profit of SML ISUZU rose 44.34% to Rs 67 crore in the quarter ended June 2025 as against Rs 46 crore during the previous quarter ended June 2024. Sales rose 13.39% to Rs 846 crore in the quarter ended June 2025
- Market Cap: 5,498 Crore (up 84.8% in 1 year), Revenue: 2,498 Cr, Profit: 142 Cr, Promoter Holding: 43.96%
Business Model Strengths:
- NSE:SMLISUZU Limited manufactures and sells commercial vehicles and related parts in India and internationally. Its products include trucks and buses
- Strong partnership with Isuzu Motors for technology and product development
- Focus on fuel-efficient and reliable commercial vehicles
- Growing aftermarket services contributing to recurring revenue
Financial Health Indicators:
- Consistent revenue growth over recent quarters
- Improving profit margins, indicating operational efficiency
- Stable promoter holding, suggesting management confidence
- Strong balance sheet supporting growth investments
Risk Assessment:
Technical Risks:
- Failure to hold ₹3,200 support could trigger correction to ₹2,800
- High volatility expected due to recent sharp price appreciation
- Potential profit booking pressure at psychological levels
Fundamental Risks:
- Cyclical nature of the commercial vehicle industry
- Dependency on economic growth and infrastructure spending
- Competition from established players like Tata Motors
- Raw material cost fluctuations impacting margins
Market Risks:
- Overall market correction could impact individual stock performance
- Interest rate changes affecting vehicle financing demand
- Regulatory changes in emission norms requiring investment
My Take:
NSE:SMLISUZU presents a compelling technical setup with the successful breakout from a decade-long Cup & Handle pattern. The combination of strong fundamentals, improving sector dynamics, and bullish technical indicators suggests potential for significant upside. However, investors should implement proper risk management given the stock's recent appreciation and inherent sector volatility.
The stock appears well-positioned to benefit from India's infrastructure growth story and the recovery of the commercial vehicle sector. Technical indicators support a bullish outlook with multiple price targets achievable over the next 12-18 months.
Keep in the Watchlist and DOYR.
NO RECO. For Buy/Sell.
📌Thank you for exploring my idea! I hope you found it valuable.
🙏FOLLOW for more
👍BOOST if you found it useful.
✍️COMMENT below with your views.
Meanwhile, check out my other stock ideas on the right side until this trade is activated. I would love your feedback.
Disclaimer: "I am not a SEBI REGISTERED RESEARCH ANALYST AND INVESTMENT ADVISER."
This analysis is intended solely for informational and educational purposes and should not be interpreted as financial advice. It is advisable to consult a qualified financial advisor or conduct thorough research before making investment decisions.
ABCAPITAL(cup& handle)My analysis is large capital company with good returns.
Key piont is Make cup and handle pattern look into chart how was possible to Target reach . Road map create for our target is 230, 300 but .. respect to SL .. LIKE ME .
Company has delivered good profit growth of 47.2% CAGR over last 5 years
Shareholding pattern (%)
As On Dec-23
Promoter 69.0 %
DII 8.4%
FII 10.6 %
Others 12.0 %
for MORE check in my TradingView ID
If You LIKE👌👌 MY Idea ......Boost.🔥🔥🔥.. its.
"Disclosure : I am not Sebi-registered." This channel is for only educational purpose. Any profit/loss, I am not responsible.
Before taking any trade on our charts / calls, please consult your financial advisors. Thanks🙏

CARTRADE: Breaks Free with Rising Wedge Breakout Post Q1 FY 26NSE:CARTRADE Breaks Free: The Rising Wedge Breakout That's Driving This Auto-Tech Giant to New All-Time Heights with Strong Q1 FY 26
Price Action:
Price Movement and Trend Structure:
• Current Price: ₹2,066.90 (as of July 28, 2025)
• Daily Change: +₹172.20 (+9.09%) - Strong bullish momentum
• Price Range: High ₹2,140.90 | Low ₹2,100.90 | Volume 5.36M shares
• Price Trajectory: Consistent higher highs and higher lows pattern from October 2024
• Recent Action: Sharp acceleration in price movement post-July breakout
• Momentum Character: Strong bullish momentum with gap-up openings and sustained buying
Volume Spread Analysis:
Volume Characteristics:
• Breakout Volume: Exceptional volume spike during the breakout phase (5.36M shares)
• Volume Pattern: Generally increasing volume during upward moves, declining during consolidations
• Average Volume: Approximately 1-2M shares on regular trading days
• Volume Confirmation: The breakout is well-supported by above-average volume, validating the move
Volume Indicators:
• Volume Expansion: 3-4x normal volume during breakout sessions
• Distribution vs Accumulation: Clear accumulation pattern throughout the wedge formation
• Volume-Price Relationship: Positive correlation between volume and price advancement
Chart Patterns:
• Rising Wedge Breakout: The stock has successfully broken out of a long-term rising wedge pattern that was forming since October 2024
• Timeframe: Daily chart showing progression from October 2024 to July 2025
• Breakout Confirmation: Strong breakout above the upper trendline of the wedge with significant volume expansion
• Breakout Level: Approximately ₹1,850-1,900 range
• Pattern Completion: Clean breakout with follow-through buying confirming pattern validity
Key Price Levels:
• All-Time High: ₹2,140.90 (recent high)
• Previous Resistance Zones: ₹1,800, ₹1,900, ₹2,000
• Immediate Support: ₹1,850-1,900 (previous breakout zone)
• Major Support: ₹1,650-1,700 (middle of previous consolidation)
• Long-term Support: ₹1,400-1,450 (bottom of the rising wedge)
Trend Analysis:
• Primary Trend: Strong bullish momentum with consistent higher highs and higher lows
• Secondary Trend: Recently accelerated upward movement post-breakout
• Trend Strength: Multiple touchpoints on both trendlines confirm the validity of the wedge pattern validity
• Momentum: Increasing momentum as evidenced by the steepening price action
Key Support and Resistance Levels:
Key Resistance Levels:
• Immediate Resistance: ₹2,150-2,200 (psychological and technical resistance)
• Next Target: ₹2,300-2,350 (measured move from wedge breakout)
• Long-term Target: ₹2,500+ (extension based on wedge height projection)
Critical Support Levels:
• First Support: ₹1,950-2,000 (recent consolidation zone)
• Strong Support: ₹1,850-1,900 (breakout confirmation level)
• Major Support: ₹1,650-1,700 (50% retracement of recent move)
• Ultimate Support: ₹1,400-1,450 (wedge bottom - unlikely to be tested)
Base Formation:
• Base Pattern: Rising wedge base formed over 9 months (October 2024 to July 2025)
• Base Depth: Approximately ₹1,000 to ₹1,900 range
• Base Quality: High-quality base with multiple retests of support and resistance
• Breakout Strength: Clean breakout with gap-up opening confirming institutional interest
Technical Patterns and Indicators:
Chart Patterns:
• Completed Pattern: Rising Wedge Breakout (Bullish continuation pattern)
• Pattern Reliability: High - well-defined trendlines with multiple touchpoints
• Measured Move Target: ₹2,300-2,400 (based on wedge height projection)
• Time Frame: 9-month pattern completion
Technical Formations:
• Flag and Pennant Potential: Post-breakout consolidation may form continuation patterns
• Gap Analysis: Potential gap fills not immediately concerning given strong fundamentals
• Trend Channel: Stock is establishing a new, steeper upward channel post-breakout
Trade Setup and Strategy:
Entry Levels:
• Aggressive Entry: ₹2,050-2,070 (current market price on dips)
• Conservative Entry: ₹1,950-1,980 (on pullback to breakout zone)
• Momentum Entry: ₹2,100-2,120 (on continuation above resistance)
• Scale-in Strategy: 40% at ₹2,000, 35% at ₹1,950, 25% at ₹1,900
Exit Levels and Targets:
• Target 1: ₹2,200-2,250 (immediate resistance zone) - Book 30% profits
• Target 2: ₹2,350-2,400 (measured move target) - Book 40% profits
• Target 3: ₹2,500-2,600 (extension target) - Book remaining 30%
• Trail Strategy: Trail stop-loss 8-10% below recent swing lows after Target 1
Stop-Loss Strategy:
• Aggressive Stop: ₹1,900-1,920 (below recent support)
• Conservative Stop: ₹1,850-1,870 (below breakout zone)
• Disaster Stop: ₹1,750-1,780 (below major support)
• Risk-Reward Ratio: Minimum 1:2, targeting 1:3 for optimal entries
Position Sizing and Risk Management:
Position Sizing Guidelines:
• Conservative Allocation: 2-3% of portfolio (suitable for risk-averse investors)
• Moderate Allocation: 4-5% of portfolio (balanced approach)
• Aggressive Allocation: 6-8% of portfolio (for high-conviction trades)
• Maximum Position: Not exceeding 10% of the total portfolio, regardless of conviction
Risk Management Rules:
• Single Trade Risk: Maximum 1-2% of portfolio value per trade
• Stop-Loss Discipline: Strict adherence to predetermined stop-loss levels
• Profit Booking Strategy: Systematic profit booking at predetermined targets
• Position Monitoring: Daily review of technical levels and volume patterns
Risk Mitigation Techniques
• Diversification: Avoid overconcentration in a single stock or sector
• Hedging Options: Consider protective puts for large positions
• Correlation Analysis: Monitor correlation with broader auto and tech indices
• News Sensitivity: Be prepared for volatility around earnings and sector news
Sectoral and Fundamental Backdrop:
Industry Landscape:
• Auto Marketplace Growth: India's online auto marketplace is growing at a 27.5% CAGR (2025-2030)
• Digital Transformation: Increasing shift from offline to online vehicle transactions
• Market Leadership: CarTrade Tech is India's leading and only profitable auto marketplace
• Competitive Advantage: Multi-platform presence with CarWale, BikeWale, CarTrade, and OLX India
Business Model Strength:
• Asset-Light Model: Operates 114 auto malls, mostly leased, ensuring capital efficiency
• Revenue Diversification: Multiple revenue streams including listing fees, transaction commissions, and financial services
• Platform Integration: Comprehensive ecosystem covering new cars, used cars, commercial vehicles, and two-wheelers
• Strategic Acquisitions: OLX India acquisition for ₹535.54 crore, strengthening market position
Recent Fundamental Performance:
• Q1 FY26 Results: Revenue of ₹173 crore (22% YoY growth)
• Profit Growth: Net profit doubled year-on-year in Q1 FY26
• Market Capitalization: ₹9,801 crore (up 139% in past year)
• Valuation Metrics: Trading at 4.42 times book value
• EBITDA Performance: EBITDA almost doubled in Q1 FY26
Growth Catalysts:
• Market Expansion: Penetration into tier-2 and tier-3 cities
• Technology Enhancement: AI and ML integration for better user experience
• Financial Services: Growing fintech vertical with loan facilitation
• Electric Vehicle Segment: Positioning for EV marketplace opportunities
• B2B Growth: Expanding dealer and OEM partnerships
Sector Tailwinds:
• Digital Adoption: Accelerated post-pandemic shift to online platforms
• Used Car Market: Growing preference for certified pre-owned vehicles
• Credit Penetration: Increasing vehicle financing accessibility
• Regulatory Support: Government push for digitization and transparency
• Consumer Behaviour: Millennial and Gen-Z preference for online research and transactions
Risk Factors and Considerations:
Technical Risks:
• Overbought Conditions: Stock may be due for consolidation after a sharp run-up
• Gap Risk: Potential for gap-down on negative news or market corrections
• Volume Sustainability: Need for continued high volume to sustain momentum
• Market Correlation: High beta stock susceptible to broader market volatility
Fundamental Risks:
• Economic Slowdown: Auto sales sensitivity to economic cycles
• Competition Intensification: New entrants and existing players' aggressive strategies
• Regulatory Changes: Potential policy changes affecting online marketplaces
• Technology Disruption: Emergence of new technologies or business models
Market Risks:
• Sector Rotation: Shift in investor preference away from auto-tech stocks
• Liquidity Concerns: Mid-cap stock with potential liquidity constraints during market stress
• Earnings Expectations: High growth expectations leading to volatility on any disappointment
• Valuation Concerns: Premium valuations make stock sensitive to market sentiment changes
My Take and Investment Thesis:
NSE:CARTRADE presents a compelling technical setup with a successful rising wedge breakout supported by strong volume and robust fundamental performance. The stock has established itself as a leader in India's growing auto marketplace sector with a diversified business model and strong growth trajectory.
The technical breakout, combined with excellent Q1 FY26 results showing doubled profits and 22% revenue growth, creates a favourable risk-reward scenario for investors. However, given the stock's significant run-up (146% in 11 months), careful position sizing and strict risk management are essential.
The investment thesis is supported by both technical momentum and fundamental strength, making it suitable for investors seeking exposure to India's digital transformation in the automotive sector. The key to success will be disciplined execution of the outlined entry, exit, and risk management strategies while monitoring both technical levels and fundamental developments closely.
Keep in the Watchlist and DOYR.
NO RECO. For Buy/Sell.
📌Thank you for exploring my idea! I hope you found it valuable.
🙏FOLLOW for more
👍BOOST if you found it useful.
✍️COMMENT below with your views.
Meanwhile, check out my other stock ideas on the right side until this trade is activated. I would love your feedback.
Disclaimer: "I am not a SEBI REGISTERED RESEARCH ANALYST AND INVESTMENT ADVISER."
This analysis is intended solely for informational and educational purposes and should not be interpreted as financial advice. It is advisable to consult a qualified financial advisor or conduct thorough research before making investment decisions.
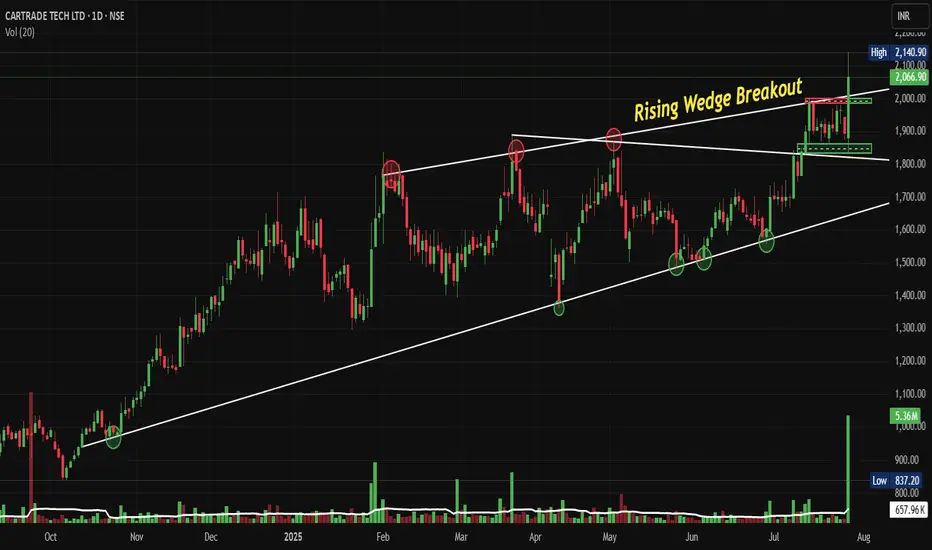
YATRA: Spectacular Recovery, Chart of the Week Post Q1 FY26From IPO Disaster to Cup & Handle Breakout: NSE:YATRA Spectacular Recovery Rally May Just Be Getting Started post Strong Q1 FY26 Numbers
As per the Latest SEBI Mandate, this isn't a Trading/Investment RECOMMENDATION nor for Educational Purposes; it is just for Informational purposes only. The chart data used is 3 Months old, as Showing Live Chart Data is not allowed according to the New SEBI Mandate.
Disclaimer: "I am not a SEBI REGISTERED RESEARCH ANALYST AND INVESTMENT ADVISER."
This analysis is intended solely for informational purposes and should not be interpreted as financial advice. It is advisable to consult a qualified financial advisor or conduct thorough research before making investment decisions.
Price Action Analysis:
Chart Pattern Identification:
- Primary Pattern: Cup & Handle Formation (Bullish Reversal Pattern)
- Cup formation period: March 2024 to May 2025
- Handle formation: May 2025 to July 2025
- Breakout confirmation: August 2025 with strong volume spike
Key Price Levels:
- IPO Base Level: ₹125-130 (Initial listing range)
- All-Time High: ₹194.00 (Early 2024 peak)
- Major Support Levels:
- ₹118 (Cup base/IPO resistance turned support)
- ₹106 (Handle low)
- ₹90-95 (Previous resistance cluster)
- Major Resistance Levels:
- ₹160 (Next logical resistance)
- ₹180-185 (Pre-ATH resistance zone)
- ₹194 (All-time high)
Trend Analysis:
- Long-term Trend: Bullish reversal after prolonged downtrend
- Medium-term Trend: Strong bullish momentum post-breakout
- Short-term Trend: Consolidating after breakout with bullish bias
Volume Spread Analysis:
Volume Characteristics:
- Breakout Volume: Exceptional surge to 134.47M (significantly above average)
- Volume Confirmation: Strong institutional participation is evident
- Historical Volume Pattern: Low volume during handle formation followed by breakout explosion
Volume Spread:
- Volume surge indicates genuine breakout with institutional backing
- Previous accumulation phase visible during cup formation
- Current volume levels suggest sustained interest
Key Support & Resistance:
Dynamic Support Levels:
- Immediate Support: ₹125-130 (Breakout level/IPO base)
- Secondary Support: ₹118 (Cup rim level)
- Critical Support: ₹106 (Handle low - stop loss reference)
Resistance Levels:
- First: ₹160 (38.2% retracement from ATH)
- Second: ₹180-185 (Pre-ATH consolidation zone)
- Ultimate: ₹220-240 (Cup & Handle measured move)
Technical Indicators & Patterns:
Classical Patterns:
- Cup & Handle: Completed with successful breakout
- Rounding Bottom: Visible in the cup formation
- Ascending Triangle: Formed during handle consolidation
Key Technical Observations:
- Price action shows strong momentum post-breakout
- Previous IPO resistance at ₹125-130 now acting as support
- Breakout occurred with a gap-up opening, indicating strong sentiment
Sectoral Backdrop:
Online Travel Industry Overview:
- India Online Travel Market expected to reach USD 23.10 billion in 2025 and grow at a CAGR of 7.76% to reach USD 33.90 billion by 2030
- Online travel booking service market in India expected to reach projected revenue of US$57,924.4 million by 2030 with a CAGR of 10.6%
- India's travel industry is valued at $178 billion, fueling economic growth with travel stocks offering lucrative investment opportunities
Market Position:
- Yatra Online Ltd. was identified as one of the major companies operating alongside MakeMyTrip, EaseMyTrip, and Cleartrip
- Strong competitive position in a growing market
- Recovery phase post-pandemic showing robust growth trajectory
Fundamental Backdrop:
Financial Metrics:
- Market Cap: 2,223 Crore, Revenue: 900 Cr, Profit: 49 Cr (TTM)
- Promoter Holding: 64.46% (Strong management commitment)
- Trading at 2.84 times book value at 45.8 times P/E
Operational Assessment:
- The company has a low return on equity of 2.90% over the last 3 years
- Profitability achieved, indicating operational efficiency improvement
- Revenue growth trajectory supported by sector tailwinds
Growth Lever:
- Beneficiary of India's domestic tourism boom
- Digital transformation in travel booking
- Post-pandemic recovery in the travel sector
- The government's focus on tourism development
Market Outlook & Catalysts:
Positive Catalysts:
- Travel & Tourism market in India projected to grow by 8.07% (2025-2029)
- Increasing domestic travel penetration
- Corporate travel recovery
- Digital adoption acceleration
Key Risk Factors:
- Intense competition from larger players
- Seasonal business variations
- Economic slowdown impact on discretionary spending
- Regulatory changes in the travel sector
Key Monitoring Points:
- Sustained holding above the ₹125 breakout level
- Volume sustainability in the coming sessions
- Broader market conditions and sector rotation
- Company's Next Few quarterly results and guidance updates.
Full Coverage on my Newsletter this Week
Keep in the Watchlist and DOYR.
NO RECO. For Buy/Sell.
📌Thank you for exploring my idea! I hope you found it valuable.
🙏FOLLOW for more
👍BOOST if you found it useful.
✍️COMMENT below with your views.
Meanwhile, check out my other stock ideas on the right side until this trade is activated. I would love your feedback.
As per the Latest SEBI Mandate, this isn't a Trading/Investment RECOMMENDATION nor for Educational Purposes, it is just for Informational purposes only. The chart data used is 3 Months old, as Showing Live Chart Data is not allowed according to the New SEBI Mandate.
Disclaimer: "I am not a SEBI REGISTERED RESEARCH ANALYST AND INVESTMENT ADVISER."
This analysis is intended solely for informational purposes and should not be interpreted as financial advice. It is advisable to consult a qualified financial advisor or conduct thorough research before making investment decisions.
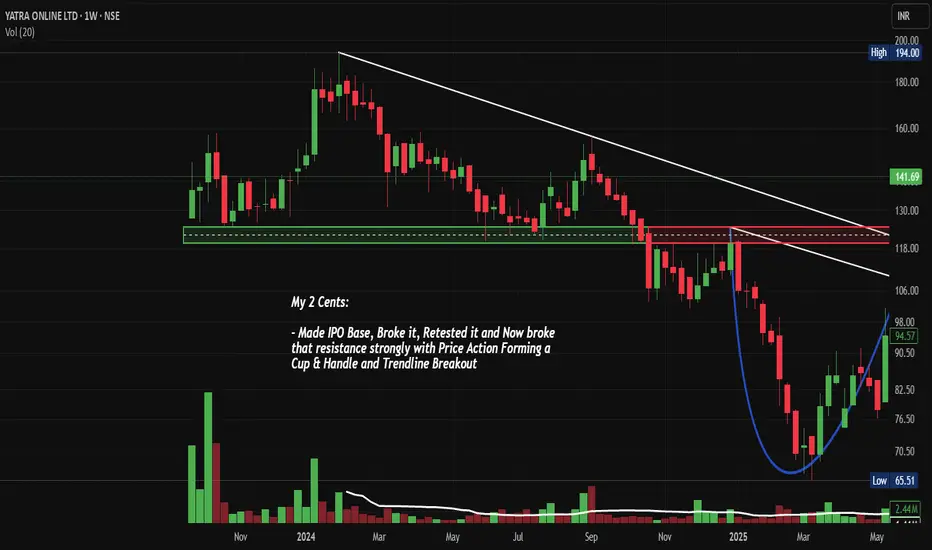
Muthoot Fin. bounce from Polarity LevelsNSE:MUTHOOTFIN made a good bounce from Polarity Levels with a huge candle again with high Volumes and closing above 50 DEMA, taking Support of 200 DEMA.
On the back news of the finance ministry seeking relaxation in the new rules on gold loans proposed by the central bank, they proposed that small ticket borrowers below 200,000 rupees should be excluded from the tighter rules to ensure speedy disbursements.
Price Action & Volume Analysis:
The stock has been consolidating in a well-defined range between ₹2,060-2,070 (support zone) and ₹2,400-2,435 (resistance zone) since April 2025. Today's strong move with above-average volume of 1.16M shares (compared to the 20-day average) suggests institutional participation and potential breakout momentum.
The price action shows a classic "coiling" pattern within the broader range, with decreasing volatility over the past few weeks, often a precursor to significant directional moves.
Key Technical Levels:
Support Zones:
- Immediate Support: ₹2,169-2,180 (50 EMA confluence)
- Strong Support: ₹2,060-2,070 (tested multiple times since April)
- Critical Support: ₹1,950-1,980 (October 2024 breakout level)
Resistance Zones:
- Immediate Resistance: ₹2,300-2,320
- Major Resistance: ₹2,400-2,435 (multiple rejections)
- Extension Target: ₹2,500-2,550
Base Formation & Pattern Recognition:
The stock has formed a robust Ascending Triangle pattern since the October 2024 lows. The horizontal resistance at ₹2,400-2,435, combined with rising support levels, creates a bullish continuation pattern. The triangle's apex is approaching, suggesting an imminent breakout.
Additionally, there's a clear Flag and Pole formation visible from the March-April rally, with the current consolidation representing the flag portion.
Moving Average Analysis:
- 50 EMA (Orange): Currently at ₹2,169, acting as dynamic support
- 200 EMA (Red): Located around ₹2,000, providing long-term trend support
- The stock is trading above both key EMAs, confirming the bullish trend structure
Trade Setup & Strategy:
Bullish Breakout Play:
Entry Strategy:
- Primary Entry: ₹2,320-2,330 (on volume breakout above resistance)
- Alternative Entry: ₹2,280-2,290 (pullback entry if direct breakout fails)
Target Levels:
- Target 1: ₹2,500 (measured move from triangle base)
- Target 2: ₹2,650 (extension target)
- Target 3: ₹2,800 (psychological resistance)
Risk Management:
- Stop Loss: ₹2,150 (below 50 EMA and swing low)
- Risk-Reward Ratio: 1:2.5 to 1:3.5
Position Sizing:
Risk should only be 1-2% of portfolio capital, given the stop loss distance.
Volume Confirmation:
Today's volume spike to 1.16M shares is encouraging, representing nearly 25% above the average. This volume expansion, coinciding with price advancement, suggests institutional accumulation. Watch for sustained volume above 1M shares for breakout confirmation.
Sectoral & Fundamental Backdrop:
NBFC Sector Dynamics:
The Non-Banking Financial Company (NBFC) sector has been gaining traction due to:
- Improving the credit growth environment
- RBI's supportive regulatory stance
- Rising rural credit demand
- Digital transformation initiatives
Muthoot Finance Fundamentals:
- Dominant player in gold financing with 5,000+ branches
- Strong asset quality with minimal NPAs
- Consistent dividend payout history
- Beneficiary of rising gold prices and rural credit demand
- Digital initiatives expanding customer base
Macro Tailwinds:
- Monsoon predictions favouring the rural economy
- Wedding season demand for gold loans
- Formalization of the gold loan market
- Potential interest rate stabilization
Risk Factors:
Technical Risks:
- Failure to sustain above ₹2,300 could lead to range continuation
- Broader market correction could impact individual stock performance
- Sector rotation away from financials
Fundamental Risks:
- Gold price volatility affecting loan demand
- Regulatory changes in the NBFC space
- Competition from banks in the gold loan segment
My Take:
NSE:MUTHOOTFIN presents an attractive risk-reward setup with its ascending triangle breakout potential. The combination of strong fundamentals, sector tailwinds, and technical setup creates a compelling investment thesis. However, strict adherence to stop losses and position sizing remains crucial given the inherent market volatility.
The stock appears poised for a significant move, with the technical pattern suggesting a higher probability of an upside breakout. Traders should wait for volume confirmation above ₹2,320 levels before initiating positions.
Keep in the Watchlist.
NO RECO. For Buy/Sell.
📌Thank you for exploring my idea! I hope you found it valuable.
🙏FOLLOW for more
👍BOOST if you found it useful.
✍️COMMENT below with your views.
Meanwhile, check out my other stock ideas on the right side until this trade is activated. I would love your feedback.
Disclaimer: "I am not SEBI REGISTERED RESEARCH ANALYST AND INVESTMENT ADVISER."
This analysis is intended solely for informational and educational purposes and should not be interpreted as financial advice. It is advisable to consult a qualified financial advisor or conduct thorough research before making investment decisions.
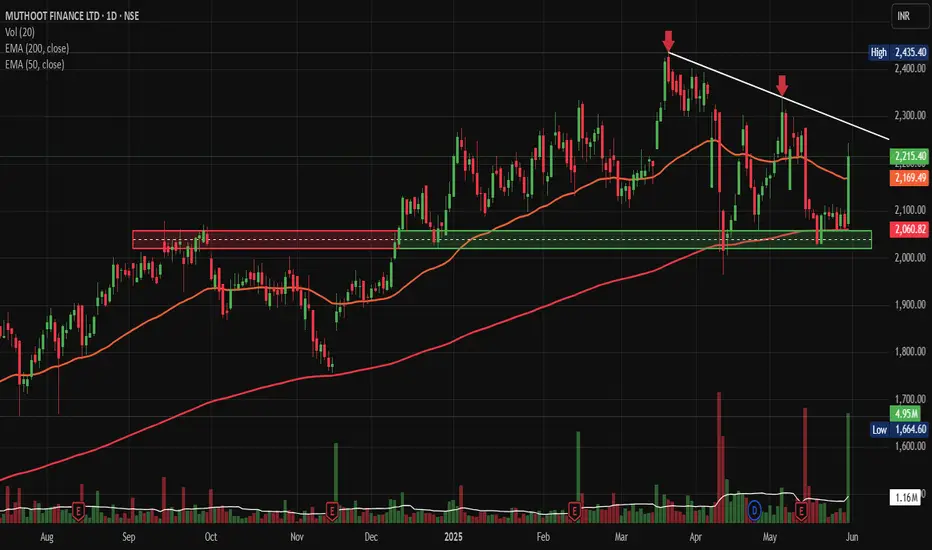
SARDAEN: Triangle Breakout, Chart of the WeekWhy NSE:SARDAEN Triangle Breakout Could Signal the Next Big Move in it, let's analyze in "Chart of the Week" Post Strong Q1 FY26 Results
As per the Latest SEBI Mandate, this isn't a Trading/Investment RECOMMENDATION nor for Educational Purposes, it is just for Informational purposes only. The chart data used is 3 Months old, as Showing Live Chart Data is not allowed according to the New SEBI Mandate.
Disclaimer: "I am not a SEBI REGISTERED RESEARCH ANALYST AND INVESTMENT ADVISER."
This analysis is intended solely for informational purposes and should not be interpreted as financial advice. It is advisable to consult a qualified financial advisor or conduct thorough research before making investment decisions.
Price Action Analysis:
• Stock has exhibited a strong uptrend from 2022 lows around ₹120-140 to current levels of ₹534.95
• Major rally phase from mid-2023 onwards, gaining over 300% in approximately 18 months
• Current consolidation phase since late 2024, around ₹400-600 range, indicates institutional accumulation
• Recent price action shows formation of higher lows with resistance being tested multiple times
Volume Spread Analysis:
• Volume spikes during major breakout moves confirm institutional participation
• Recent consolidation accompanied by relatively lower volumes, typical of the accumulation phase
• Volume breakout above 7.11M suggests renewed interest at current levels
• Volume pattern supports the bullish bias with buying interest on dips
Key Technical Levels:
Base Formation:
• Primary base established between ₹400-₹430 levels during 2024 consolidation
• Secondary base forming at ₹480-₹500 range as recent support
• Base width of approximately 8-10 months indicates a strong foundation for the next leg up
Support Levels:
• Immediate Support: ₹480-₹500 (recent swing lows and 50-day moving average area)
• Strong Support: ₹420-₹440 (previous resistance turned support)
• Major Support: ₹380-₹400 (long-term trend line support and 200-day moving average)
Resistance Levels:
• Immediate Resistance: ₹560-₹580 (recent highs and psychological level)
• Major Resistance: ₹600-₹620 (all-time high zone and round number resistance)
• Extended Resistance: ₹680-₹720 (measured move projection from triangle pattern)
Technical Pattern Recognition
Symmetrical Triangle Pattern:
• Clear triangle formation visible from the chart with converging trend lines
• Triangle spans approximately 8-10 months, indicating a significant pattern
• Breakout direction typically follows the prevailing trend (bullish in this case)
Trend Line Analysis:
• Primary uptrend line intact from 2022 lows, providing dynamic support
• Resistance trend line from 2024 highs is being challenged multiple times
• Converging trend lines creating the triangle pattern setup
Fundamental and Sectoral Backdrop:
Company Fundamentals:
• Market Cap: ₹18,852 crore (up 88.40% in 1 year)
• Revenue: ₹5,350 crore with profit of ₹941 crore (TTM)
• Business Model: Manufacture of sponge iron, ferro alloys, billet, wire-rod, and iron ore pellet through Steel, Ferro, and Power segments
• Promoter Holding: 73.16% indicating strong management confidence
• Dividend Policy: Low payout at 7.69% of profits over the last 3 years, suggesting reinvestment focus
Sectoral Outlook:
• Steel Industry: India is the world's largest steel producer with strong domestic demand
• Ferro Alloys Market: Global market projected to grow from $156.37 billion in 2024 to $204.2 billion by 2032 at 5.60% CAGR
• Indian Ferrosilicon: Market valued at $347.7 million in 2022, estimated to grow at 5.0% CAGR through 2030
• Infrastructure Push: Union Budget 2025-26 increased capital investment outlay for infrastructure by 11.1% to ₹11.2 lakh crore
Growth Lever:
• Integrated business model across the steel value chain provides operational synergies
• Strong promoter holding indicates alignment with minority shareholders
• Beneficiary of India's infrastructure development and steel demand growth
• Consolidation phase completion, suggesting readiness for the next growth phase
Key Risk Factors:
• Commodity price volatility affecting margins
• Working capital days increased from 78.1 days to 119 days, indicating efficiency concerns
• Current valuation appears overvalued by 52% compared to intrinsic value
• Global steel demand fluctuations and trade policy changes
Market Catalysts:
• Government infrastructure spending and PLI schemes
• 2025 outlook suggests potential upturn in steel producer activity with lower input costs and shifting trade policies
• Iron ore production increased by 5.5% to 135 MMT in FY 2024-25, supporting raw material availability
• Ferro Alloys industry poised to reach $188.7 billion by 2025, driven by a robust economy
Full Coverage on my Newsletter this Week
Keep in the Watchlist and DOYR.
NO RECO. For Buy/Sell.
📌Thank you for exploring my idea! I hope you found it valuable.
🙏FOLLOW for more
👍BOOST if you found it useful.
✍️COMMENT below with your views.
Meanwhile, check out my other stock ideas on the right side until this trade is activated. I would love your feedback.
As per the Latest SEBI Mandate, this isn't a Trading/Investment RECOMMENDATION nor for Educational Purposes, it is just for Informational purposes only. The chart data used is 3 Months old, as Showing Live Chart Data is not allowed according to the New SEBI Mandate.
Disclaimer: "I am not a SEBI REGISTERED RESEARCH ANALYST AND INVESTMENT ADVISER."
This analysis is intended solely for informational purposes and should not be interpreted as financial advice. It is advisable to consult a qualified financial advisor or conduct thorough research before making investment decisions.
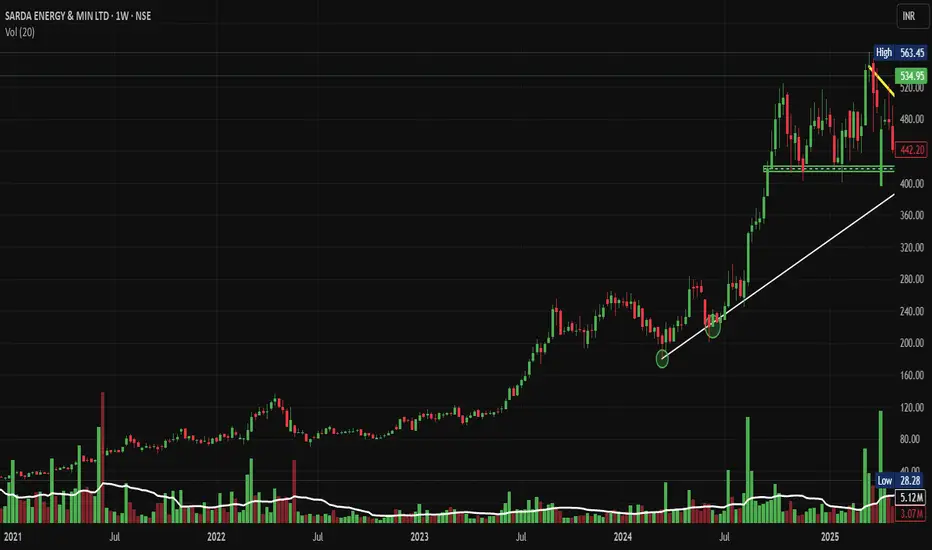
ZUARI: Stunning Breakout: A Deep Technical Analysis in the ChartNSE:ZUARI Stunning Breakout: A Deep Technical Analysis in the Chart of the Week
As per SEBI Mandate, this isn't a Trading/Investment RECOMMENDATION nor for Educational Purposes, it's just for Informational purposes
Disclaimer: "I am not a SEBI REGISTERED RESEARCH ANALYST AND INVESTMENT ADVISER."
This analysis is intended solely for informational purposes and should not be interpreted as financial advice. It is advisable to consult a qualified financial advisor or conduct thorough research before making investment decisions.
Price Action Analysis:
- The stock has shown a remarkable multi-year uptrend spanning from 2021 to 2025
- Price has rallied from lows around ₹90 in 2021 to current levels near ₹306, representing a gain of over 240%
- The stock is currently trading at ₹306.25 with recent highs touching ₹344.40
- Volume surge is evident in recent sessions with 58.28M shares traded, indicating strong institutional participation
Volume Analysis:
- Exceptional volume spike during breakout phases indicates institutional buying
- Volume-price correlation is positive during upward moves
- Recent volume of 58.28M vs average suggests strong momentum continuation
- Distribution patterns absent, indicating healthy accumulation
Chart Patterns and Structure:
Base Formation:
- A strong accumulation base was formed between 2021-2022 in the ₹90-180 range
- This 18-month consolidation phase created a solid foundation for the subsequent bull run
- The base shows characteristics of a cup-and-handle pattern with gradual accumulation
Support and Resistance Levels:
- Major Support Levels: ₹160-170 (dotted green rectangle area), ₹210-220
- Immediate Support: ₹280-290 range
- Key Resistance: ₹344.40 (recent high marked by red horizontal line)
- Next Resistance: ₹360-380 zone if breakout sustains
Technical Patterns:
- Multi-year ascending triangle formation with higher lows and consistent resistance around ₹250-260 levels
- Recent breakout above ₹260 resistance with strong volume confirmation
- Flag and pennant patterns visible during consolidation phases
- Currently in a potential flag formation after the recent surge
Fundamental and Sectoral Backdrop:
Company Overview:
- NSE:ZUARI is an India-based fertilizer manufacturing company engaged in the manufacturing, trading, and marketing of chemical fertilizers and fertilizer products
- The company manufactures and markets Single Super Phosphate (SSP) through its brand Jai Kisaan with a market cap of ₹1,288 Cr
- The company has delivered a poor sales growth of 8% over the past five years, with a low return on equity of 8% over the last 3 years
Sectoral Dynamics:
- India's FY 2025-26 budget allocates ₹1.84 trillion for fertilizer subsidies, with ₹1.19 trillion for urea and ₹0.49 trillion for P&K fertilizers
- The India Fertilizer Market size was valued at $40.5 billion in 2023 and is expected to reach INR 1,401.0 Billion by 2033, exhibiting a growth rate (CAGR) of 4-6.1%
- India's fertilizer sector in 2025 is a blend of strategic imports, domestic policy innovation, and scientific transformation with precision farming initiatives and sustainability experiments
Key Rationale:
- Government support through substantial subsidy allocation provides sector stability
- Growing agricultural focus and food security concerns drive long-term demand
- Technical breakout coincides with favourable sectoral tailwinds
- Undervaluation based on intrinsic value models suggests upside potential
- Strong historical returns demonstrate the company's ability to generate wealth
Risk Factors:
- Poor fundamental metrics with low sales growth and ROE
- High dependence on government policies and subsidy changes
- Commodity price volatility affecting margins
- Environmental regulations pushing toward organic alternatives
- Working capital-intensive business model
My Take:
NSE:ZUARI presents a compelling technical setup with a multi-year breakout backed by strong sector fundamentals. The stock's impressive 240%+ rally from base levels, combined with government support for the fertilizer sector, creates an attractive risk-reward proposition. However, one should be mindful of the company's weak operational metrics and maintain disciplined risk management. The current setup favours trend continuation with measured targets, making it suitable for both swing and positional traders with appropriate position sizing.
Full Coverage on my Newsletter this Week
Keep in the Watchlist and DOYR.
NO RECO. For Buy/Sell.
📌Thank you for exploring my idea! I hope you found it valuable.
🙏FOLLOW for more
👍BOOST if you found it useful.
✍️COMMENT below with your views.
Meanwhile, check out my other stock ideas on the right side until this trade is activated. I would love your feedback.
As per SEBI Mandate, this isn't a Trading/Investment RECOMMENDATION nor for Educational Purposes, it's just for Informational purposes
Disclaimer: "I am not a SEBI REGISTERED RESEARCH ANALYST AND INVESTMENT ADVISER."
This analysis is intended solely for informational purposes and should not be interpreted as financial advice. It is advisable to consult a qualified financial advisor or conduct thorough research before making investment decisions.
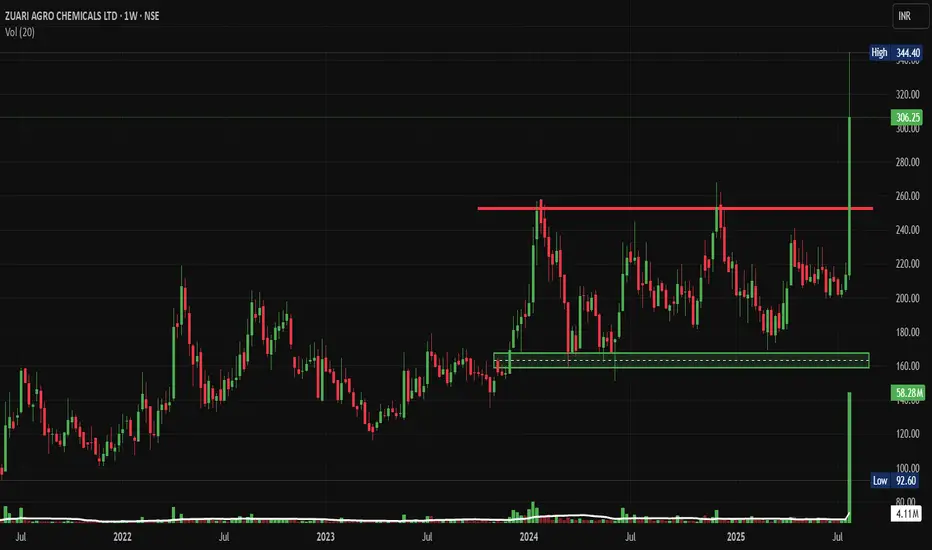
HINDUNILVR: Attempting Rising Wedge Breakout Post Q1 FY 26NSE:HINDUNILVR Attempting Rising Wedge Breakout: A Technical Revival Story Worth Watching Post Decent above Estimate Volume Growth and Q1 FY26 Results.
Price Action:
• Trading within a well-defined rising wedge pattern from February 2025 to July 2025
• The stock experienced a significant decline from its peak around ₹3,035 in September 2024 to a low of ₹2,136 in March 2025
• Currently trading at ₹2,521.20 with a gain of ₹83.80 (+3.44%)
• The stock appears to be attempting a breakout from the upper trendline of the rising wedge
Volume Spread Analysis:
• Volume has been relatively subdued during the consolidation phase within the wedge
• Recent sessions show increased volume activity with 5.51M shares traded, indicating renewed interest
• The volume pattern suggests accumulation during the lower levels of the wedge formation
• Volume spike accompanies the current breakout attempt, confirming the move
Key Technical Levels:
Key Support Levels:
• Immediate support: ₹2,420-₹2,450 (recent consolidation zone)
• Strong support: ₹2,300-₹2,350 (lower trendline of the rising wedge)
• Critical support: ₹2,136 (52-week low established in March 2025)
Resistance Levels:
• Immediate resistance: ₹2,550-₹2,580 (upper trendline breakout zone)
• Next resistance: ₹2,700-₹2,750 (previous swing highs)
• Major resistance: ₹3,035 (52-week high from September 2024)
Technical Patterns:
• Rising Wedge Pattern: A bearish reversal pattern that has been forming since Feb 2025
• Breakout Attempt: The stock is testing the upper boundary of the rising wedge with increased volume
• Higher Lows Formation: Despite the wedge pattern, the stock has been making higher lows since March 2025
Trade Setup:
Entry Strategy:
• Primary Entry: On sustained breakout above ₹2,550 with volume confirmation
• Secondary Entry: On pullback to ₹2,480-₹2,500 after successful breakout
• Aggressive Entry: Current levels around ₹2,520 for short-term traders
Exit Levels:
• Target 1: ₹2,680-₹2,700 (8-10% upside potential)
• Target 2: ₹2,850-₹2,900 (15-18% upside potential)
• Target 3: ₹3,000-₹3,050 (20-25% upside potential)
Stop-Loss Strategy:
• Conservative: ₹2,350 (below the rising wedge support)
• Moderate: ₹2,420 (below immediate support zone)
• Tight: ₹2,480 (for breakout trades)
Position Sizing:
• Conservative investors: 2-3% of portfolio allocation
• Moderate risk appetite: 4-5% of portfolio allocation
• Aggressive traders: 6-8% of portfolio allocation
Risk Management:
• Risk-Reward Ratio: Maintain a minimum 1:2 ratio for all entries
• Trailing Stop: Implement a 5-7% trailing stop after 10% gains
• Partial Profit Booking: Book 30% profits at Target 1, 40% at Target 2, and hold 30% for Target 3
Sectoral and Fundamental Backdrop:
FMCG Sector Overview:
• BSE FMCG index was up 1 per cent, as compared to a 0.5 per cent decline in the BSE Sensex
• The FMCG sector is showing resilience amid broader market volatility
• Rural demand recovery is expected to support sector growth in the coming quarters
Financial Performance:
• TTM Revenue: 63,928 Cr, TTM Profit: 10,827 Cr
• The company has delivered a poor sales growth of 10% over the past five years
• Annual revenue for March 2025 reached Rs 63,121 Crore, up 2%. Net profit rose 3.8% to Rs 10,671 Crore
Valuation Metrics:
• HUL's stock trades at a Price-to-Earnings (P/E) ratio around 55.70x, slightly below its historical averages (~61x over 5 years)
• Stock is trading at 12 times its book value
• Market Cap: 5,92,476 Crore (down -6.82% in 1 year)
Business Fundamentals:
• Promoter Holding: 61.9%
• Strong brand portfolio across multiple FMCG categories
• Extensive distribution network covering both urban and rural markets
• Urban markets contribute 60 per cent to HUL's sales, while rural markets comprise the rest
Recent Developments:
• Motilal Oswal analysts believe that volume growth for HUL has reached its lowest point and foresee a gradual recovery in volumes during FY25
• Brokerages tracked by Business Standard estimate HUL's net profit to decline 1.2 per cent year-on-year (Y-o-Y) on average, to ₹2,540.6 crore
• The company is expected to benefit from improving rural demand and premiumization trends
My Take:
• HUL remains a defensive play in the FMCG space with strong market positioning
• The technical breakout attempt coincides with expectations of volume recovery
• Long-term investors can consider accumulating on dips while traders can play the breakout momentum
Keep in the Watchlist and DOYR.
NO RECO. For Buy/Sell.
📌Thank you for exploring my idea! I hope you found it valuable.
🙏FOLLOW for more
👍BOOST if you found it useful.
✍️COMMENT below with your views.
Meanwhile, check out my other stock ideas on the right side until this trade is activated. I would love your feedback.
Disclaimer: "I am not a SEBI REGISTERED RESEARCH ANALYST AND INVESTMENT ADVISER."
This analysis is intended solely for informational and educational purposes and should not be interpreted as financial advice. It is advisable to consult a qualified financial advisor or conduct thorough research before making investment decisions.
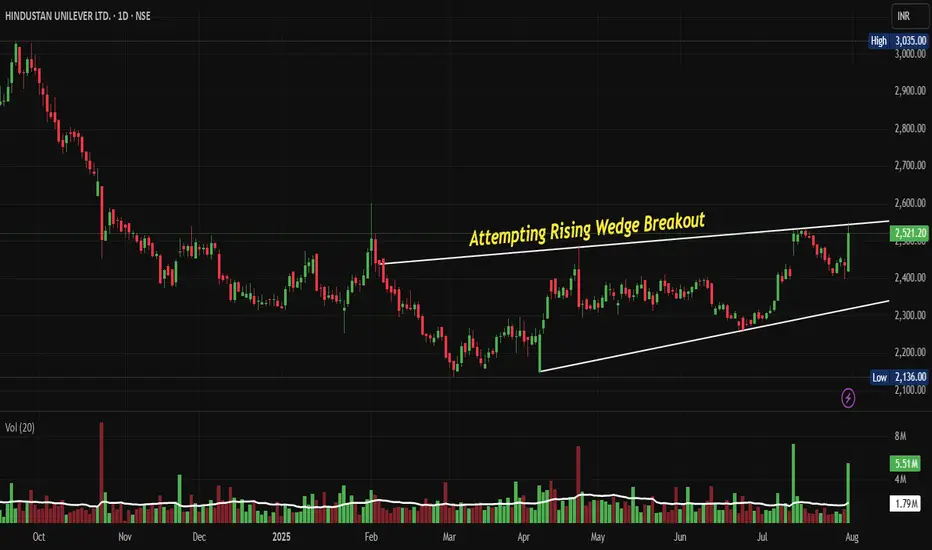
CRAFTSMAN: Rising Wedge Breakout Post Q1 FY26NSE:CRAFTSMAN Breaks Above Rising Wedge: A Bullish Technical Play Worth Watching Post Decent Q1 FY26 Results
Price Action Analysis:
Current Price Movement:
• Current Price: ₹6,863.50 (as of July 30, 2025)
• Day's Performance: +₹415.50 (+6.44%)
• Volume: 91.27K shares
• 52-Week Range: ₹3,700 - ₹7,121.25
Price Structure Analysis:
• Trend: Strong uptrend from March 2025 lows
• Higher Highs: Consistent formation since March 2025
• Higher Lows: Well-defined support levels during pullbacks
• Momentum: Acceleration post-breakout with gap-up opening
Volume Spread Analysis:
• Volume Patterns: Decreasing volume during the consolidation phase
• Breakout Volume: Significant surge indicating institutional participation
• Volume Profile: Above-average participation at key resistance levels
Key Price Levels:
• All-Time High: ₹7,121.25 (immediate target zone)
• Breakout Level: ₹6,500 (now acting as support)
• Previous Resistance: ₹6,200-6,300 (now support zone)
• Major Support: ₹5,800-6,000 (rising trendline confluence)
Base Formation:
• Primary Base: Extended consolidation between ₹4,800-6,500 from March to July 2025
• Duration: Approximately 4 months
• Depth: Shallow correction of 15-20% from previous highs
• Character: Healthy sideways movement with diminishing volatility
Key Support and Resistance Levels:
• Major Resistance: ₹7,121.25 (all-time high)
• Immediate Resistance: ₹6,900-7,000 zone
• Strong Support: ₹6,500 (breakout level)
• Major Support: ₹5,800-6,000 (rising wedge upper trendline)
• Critical Support: ₹5,200-5,300 (previous consolidation zone)
Technical Pattern:
Rising Wedge Breakout:
• Pattern: Bullish breakout from a rising wedge formation
• Formation Period: March 2025 to July 2025
• Breakout Level: ₹6,500 approximately
• Volume Confirmation: Strong volume spike on breakout day
Trade Setup:
Entry Strategy:
• Primary Entry: ₹6,850-6,900 (current levels on any minor dip)
• Aggressive Entry: ₹6,800-6,850 (immediate entry)
• Conservative Entry: ₹6,650-6,700 (on pullback to breakout level)
Target Levels:
• Target 1: ₹7,200-7,300 (immediate resistance zone)
• Target 2: ₹7,800-8,000 (measured move target)
• Target 3: ₹8,500-9,000 (cup and handle projection)
Stop-Loss Levels:
• Aggressive Stop: ₹6,400 (below breakout level)
• Conservative Stop: ₹6,200 (below rising wedge support)
• Trailing Stop: Move to breakeven once Target 1 is achieved
Position Sizing:
• Risk per trade: Maximum 2% of portfolio
• Position size calculation based on stop-loss distance
• For ₹6,850 entry with ₹6,400 stop: Risk = ₹450 per share
• Recommended allocation: 1-2% of equity portfolio
Risk Management:
Risk Factors:
• Market-wide correction could drag the stock down
• Sector rotation out of engineering/auto components
• Profit booking at all-time high levels
• Global economic headwinds affecting the auto sector
Risk Mitigation:
• Strict stop-loss adherence
• Partial profit booking at each target level
• Position size limiting to manage portfolio risk
• Monitoring broader market sentiment
Exit Strategy:
• Book 30% profits at Target 1
• Book another 40% at Target 2
• Trail remaining 30% with rising stop-loss
Sectoral and Fundamental Backdrop:
Business Overview:
• Diversified engineering company with vertically integrated manufacturing
• Three main segments: Automotive Powertrain (51%), Aluminium Products (21%), Industrial & Engineering (28%)
• Market capitalization: ₹16,357 crores
• Revenue: ₹6,323 crores with profit of ₹211 crores (TTM)
Recent Financial Performance(Q1 FY26):
• Q1 FY26 results: Revenue of ₹1,784 crores, profit of ₹70 crores
• PAT growth: 31% YoY in Q1 FY26
• Segment performance: Aluminium Products revenue up 102.82% YoY
• Powertrain revenue: ₹496.41 crores (up 19.23% YoY)
Sector Dynamics:
• Automotive sector recovery post-pandemic
• Increasing adoption of aluminium components for weight reduction
• Growing demand for powertrain components in commercial vehicles
• Beneficiary of the Make in India initiative
Key Clients and Market Position:
• Supplies to tier 1 OEMs including Tata Motors, Cummins, M&M, Royal Enfield
• Strong presence in commercial vehicles, two-wheelers, and tractor segments
• Established player in aluminium die-casting and machining
Growth Drivers:
• Capacity utilization improvements
• Focus on higher-margin aluminium products
• Expansion in industrial and engineering segments
• Increasing content per vehicle trends
Analyst Outlook after Q1 FY26:
• Average 1-year price target: ₹5,754 (though this appears conservative given current price)
• Price target range: ₹4,318 to ₹8,085
• Positive sentiment on aluminium business growth
• Capex guidance of ₹100-120 crores annually for maintenance and debottlenecking
My Take:
The technical setup for NSE:CRAFTSMAN presents a compelling bullish case with the successful breakout from a rising wedge pattern, supported by strong volume and a healthy fundamental backdrop. The stock is well-positioned to test new highs, though traders should remain disciplined with risk management given the proximity to all-time high levels. The diversified business model and strong sectoral tailwinds provide fundamental support to the technical breakout.
Keep in the Watchlist and DOYR.
NO RECO. For Buy/Sell.
📌Thank you for exploring my idea! I hope you found it valuable.
🙏FOLLOW for more
👍BOOST if you found it useful.
✍️COMMENT below with your views.
Meanwhile, check out my other stock ideas on the right side until this trade is activated. I would love your feedback.
Disclaimer: "I am not a SEBI REGISTERED RESEARCH ANALYST AND INVESTMENT ADVISER."
This analysis is intended solely for informational and educational purposes and should not be interpreted as financial advice. It is advisable to consult a qualified financial advisor or conduct thorough research before making investment decisions.
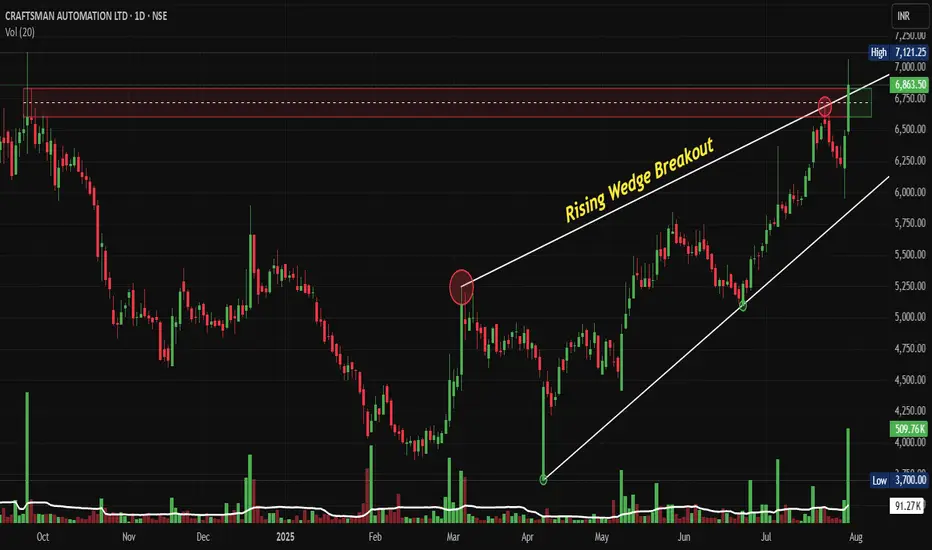
TATACHEM: Breaks out of Cup & Handle Breakout Post Q1 FY 26NSE:TATACHEM Breaks Out: The Cup and Handle Formation That Could Signal New Highs Post Good Q1 FY 26 with Margin Expansion.
Price Action:
Trend Structure
• Long-term uptrend intact with a higher lows pattern since March 2025
• Strong momentum breakout above key resistance at 1,000 levels
• Price action showing bullish continuation after brief consolidation
• Current trading above all major moving averages (20, 50, 200 EMA)
Breakout Characteristics
• Clean breakout above resistance
• Volume expansion confirming institutional participation
• No immediate rejection at breakout level, suggesting strength
• Momentum favouring further upside continuation
Volume Spread Analysis:
Volume Pattern:
• Significant volume spike during the breakout phase in July 2025
• Volume contraction during handle formation (typical healthy pattern)
• Above-average volumes during cup formation, indicating accumulation
• Recent volume expansion suggests institutional buying interest
Volume Confirmation:
• Breakout supported by 2-3x average daily volume
• Previous resistance turning into support with volume backing
• Accumulation-distribution pattern favourable for continued upside
Chart Pattern:
• The chart displays a classic Cup and Handle pattern formation spanning from Jan 2025 to July 2025
• The "Cup" formation shows a rounded bottom with the low around 750-780 levels during March 2025
• The "Handle" represents the consolidation phase between June-July 2025, around 920-960 levels
• Clear breakout above the 1,000 resistance level with strong volume confirmation
Key Technical Levels
• Primary Support: 920-950 (handle low and recent consolidation)
• Secondary Support: 850-880 (mid-cup level)
• Major Support: 750-780 (cup bottom)
• Immediate Resistance: 1,050-1,080 (psychological levels)
• Target Resistance: 1,200-1,250 (measured move from cup depth)
Trade Setup and Strategy:
Entry Levels:
• Aggressive Entry: 1,000-1,020 (on breakout confirmation)
• Conservative Entry: 950-980 (on pullback to handle support)
• Scale-in Entry: 920-950 (major support retest)
Exit Levels:
• Target 1: 1,100-1,120 (initial resistance cluster)
• Target 2: 1,200-1,250 (measured move target)
• Target 3: 1,300-1,350 (extension target based on cup depth)
Stop-Loss Strategy:
• Initial Stop-Loss: 920 (below handle low)
• Trailing Stop: 950 after Target 1 achievement
• Risk-Reward Ratio: 1:3 to 1:4 on conservative entry
Position Sizing and Risk Management:
Position Sizing:
• Allocate 2-3% of portfolio for this trade
• Calculate position size based on stop-loss distance
• Consider scaling in approach for better average entry
Risk Management:
• Maximum risk per trade: 1-2% of total capital
• Use position sizing formula: Risk Amount ÷ (Entry - Stop Loss)
• Maintain diversification across sectors and market caps
Risk Factors:
• Broader market correction could impact individual stock performance
• Sector-specific headwinds in the chemicals industry
• Global economic slowdown affecting demand
Fundamental and Sectoral Backdrop:
Recent Financial Performance:
• Q1 FY26 results showed consolidated revenue of ₹3,719 Cr with EBITDA of ₹649 Cr and PAT of ₹316 Cr
• Standalone revenue at ₹1,169 Cr, up 11.65% compared to Q1FY25, with PAT of ₹307 Cr, up 20%
• Stock gained 16.66% over the last three months
• Strong operational performance supporting technical breakout
Sectoral Outlook:
• The Chemicals market in India is projected to grow by 3.46% (2025-2029), resulting in a market volume of US$35.4bn in 2029
• India's speciality chemicals market is expected to increase at a CAGR of 12% to US$64 billion by 2025
• The chemical industry, currently valued at around US$250 billion, aims to grow to US$300 billion by 2025
• The sector is projected to grow by 11 to 12 per cent during 2021–27, tripling its global market share by 2040
Investment Thesis:
• Strong sectoral tailwinds supporting long-term growth
• Company's positioning in the speciality chemicals segment
• Potential beneficiary of India's manufacturing growth story
• Technical breakout aligning with fundamental strength
Key Monitoring Points:
Technical Triggers:
• Sustain above 1,000 levels for breakout confirmation
• Volume patterns on any pullbacks
• Price action at target levels for profit booking decisions
Fundamental Catalysts:
• Quarterly earnings performance and guidance
• New project announcements or capacity expansions
• Sectoral policy developments and government initiatives
• Global chemical prices and demand trends
Risk Monitoring:
• A break below 920 levels would invalidate the bullish setup
• Broader market sentiment and global risk-off scenarios
• Sector rotation away from chemicals and industrials
• Company-specific news flow and management commentary
My Take:
The combination of technical breakout, strong fundamentals, and positive sector outlook makes NSE:TATACHEM an attractive investment proposition at current levels, with the cup and handle pattern suggesting potential for significant upside over the next 6-12 months.
Keep in the Watchlist and DOYR.
NO RECO. For Buy/Sell.
📌Thank you for exploring my idea! I hope you found it valuable.
🙏FOLLOW for more
👍BOOST if you found it useful.
✍️COMMENT below with your views.
Meanwhile, check out my other stock ideas on the right side until this trade is activated. I would love your feedback.
Disclaimer: "I am not a SEBI REGISTERED RESEARCH ANALYST AND INVESTMENT ADVISER."
This analysis is intended solely for informational and educational purposes and should not be interpreted as financial advice. It is advisable to consult a qualified financial advisor or conduct thorough research before making investment decisions.
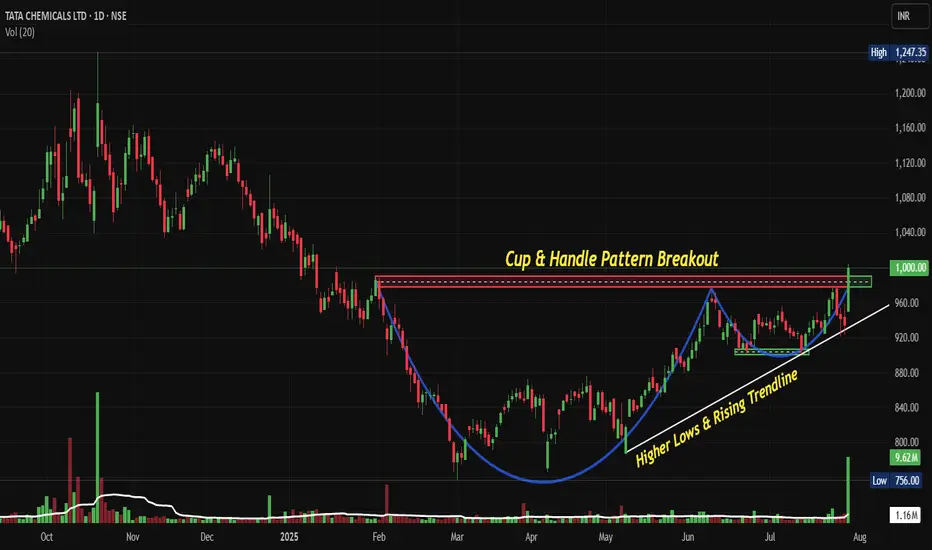
CIPLA: Darvas Box Breakout Post Results ReactionNSE:CIPLA Darvas Box Breakout Post Q1 FY 26 Results Reaction: Why This Pharma Giant Could Be Your Next Big Winner Let's Analyze
Price Action:
Price Movement Characteristics:
- Volatility: Compressed volatility within the Darvas Box range
- Price Swings: Controlled swings between ₹1,480-1,532.50 boundaries
- Breakout Attempts: Multiple tests of upper resistance without sustained follow-through
- Support Tests: Clean bounces from the lower boundary showing strong institutional support
Volume Spread Analysis
- Current Volume: 5.23M (above 20-day average)
- Volume Pattern: Declining during consolidation (bullish accumulation sign)
- Volume Spike Required: Need 1.5x average volume for breakout confirmation
- Volume Trend: Steady participation without panic selling
Market Structure Analysis:
- Higher Lows Formation: Gradual increase in swing lows within the consolidation
- Lower Highs Compression: Resistance level holding firm, creating compression
- Price Coiling: Decreasing range suggesting energy buildup for directional move
- Time Compression: Extended sideways movement indicating a major move is pending
Chart Pattern Recognition:
- Primary Pattern: Darvas Box Formation (clearly marked on the chart)
- Box Range: ₹1,480 - ₹1,532.50 consolidation zone
- Pattern Duration: Approximately 3-4 months of sideways consolidation
- Volume Context: Declining volume during the consolidation phase, typical of accumulation
Candlestick Pattern Analysis:
- Recent Candles Formation: Doji and small-bodied candles indicating indecision at resistance
- Candle Bodies: Predominantly small bodies suggesting balanced buying/selling pressure
- Wicks Analysis: Upper wicks at resistance showing selling pressure, lower wicks showing support
- Colour Distribution: Mixed red/green candles within the box showing consolidation
Key Support and Resistance Levels:
- Immediate Support: ₹1,480 (Darvas Box lower boundary)
- Strong Support: ₹1,420 (previous swing low)
- Critical Support: ₹1,335 (yearly low)
- Immediate Resistance: ₹1,532.50 (Darvas Box upper boundary)
- Target Resistance: ₹1,600-1,620 (measured move projection)
- Ultimate Target: ₹1,700+ (analyst consensus target)
Base Formation:
- Base Type: Rectangular consolidation/Darvas Box
- Base Duration: 3-4 months (adequate for institutional accumulation)
- Base Tightness: Well-defined boundaries showing controlled supply
- Breakout Confirmation: Price action at upper boundary with volume expansion needed
Trend Analysis:
- Short-term Trend: Sideways consolidation
- Medium-term Trend: Neutral to slightly bullish
- Long-term Trend: Recovery phase from 2024 lows
Momentum Indicators:
- Current Momentum: Building up for potential breakout
- Price Position: Near upper boundary of consolidation range
- Market Structure: Higher lows formation within the box
Trade Setup Strategy:
Entry Strategy:
- Primary Entry: Breakout above ₹1,535 with volume confirmation
- Secondary Entry: Retest of breakout level around ₹1,520-1,525
- Conservative Entry: Support bounce from ₹1,485-1,490
Target Levels:
- Target 1: ₹1,580 (initial resistance)
- Target 2: ₹1,620 (measured move from box height)
- Target 3: ₹1,700 (analyst target consensus)
- Long-term Target: ₹1,800+ (bull case scenario)
Stop-Loss Levels:
- Aggressive: ₹1,470 (below box support)
- Conservative: ₹1,450 (below key support zone)
- Risk Management: ₹1,420 (major support failure)
Position Sizing Guidelines:
- High Conviction: 2-3% of portfolio (on confirmed breakout)
- Medium Conviction: 1-2% of portfolio (on retest entry)
- Conservative: 0.5-1% of portfolio (support bounce play)
- Maximum Risk per Trade: Not more than 1% of total capital
Risk Management Framework:
- Risk-Reward Ratio: Minimum 1:2 for all entries
- Position Scaling: Add on strength after initial 5% move
- Profit Booking: Book 30% at Target 1, 40% at Target 2, trail rest
- Stop-Loss Management: Trail stop to breakeven after 7-8% profit
Sectoral and Fundamental Backdrop:
Pharmaceutical Sector Outlook:
- Market Size: The Indian pharma market is expected to reach US$18.8 billion by 2028 at an 8% CAGR
- Global Position: 500 facilities approved by the US FDA, the highest number outside the US
- Growth Drivers: Speedy introduction of generic drugs and focus on rural health programmes
CIPLA Fundamental Strengths:
- Market Capitalization: ₹1,23,842 Crore
- Performance: ₹27,548 Cr revenue with ₹5,269 Cr profit
Key Fundamental Concerns:
- Growth Rate: Poor sales growth of 10% over the past five years
- Promoter Holding: Decreased by 4.42% over the last 3 years, currently at 29.19%
Industry Catalysts:
- FDA Approvals: India has received 6,316 USFDA approvals for formulation plants
- Global Market Share: India supplies 40 per cent of generic drugs globally
- Export Potential: Strong positioning as a global generic supplier
Risk Assessment:
Technical Risks:
- Pattern Failure: Box breakdown below ₹1,470 would negate the bullish thesis
- Volume Concerns: Breakout without volume confirmation could lead to a false move
- Market Sentiment: Broader market correction could impact individual stock performance
Fundamental Risks:
- Regulatory Changes: FDA compliance issues or policy changes
- Competition: Intense pricing pressure in the generic segment
- Currency Risk: Rupee fluctuation impact on export revenues
Market Risks:
- Sector Rotation: Money flow away from the pharma sector
- Global Slowdown: Impact on export-dependent business model
- Geopolitical Factors: Trade tensions affecting pharmaceutical exports
My Take:
Trading/Investment Thesis:
The Darvas Box pattern on NSE:CIPLA represents a classic accumulation phase, characterised by institutional buying at lower levels. The pharmaceutical sector's strong fundamentals, combined with CIPLA's established market position, create a favourable environment for a potential breakout.
My Action Plan:
- Watch for breakout above ₹1,535 with 1.5x volume
- Enter in phases rather than a lump-sum investment
- Maintain strict stop-loss discipline
- Book profits in tranches as targets are achieved
Keep in the Watchlist and DOYR.
NO RECO. For Buy/Sell.
📌Thank you for exploring my idea! I hope you found it valuable.
🙏FOLLOW for more
👍BOOST if you found it useful.
✍️COMMENT below with your views.
Meanwhile, check out my other stock ideas on the right side until this trade is activated. I would love your feedback.
Disclaimer: "I am not a SEBI REGISTERED RESEARCH ANALYST AND INVESTMENT ADVISER."
This analysis is intended solely for informational and educational purposes and should not be interpreted as financial advice. It is advisable to consult a qualified financial advisor or conduct thorough research before making investment decisions.
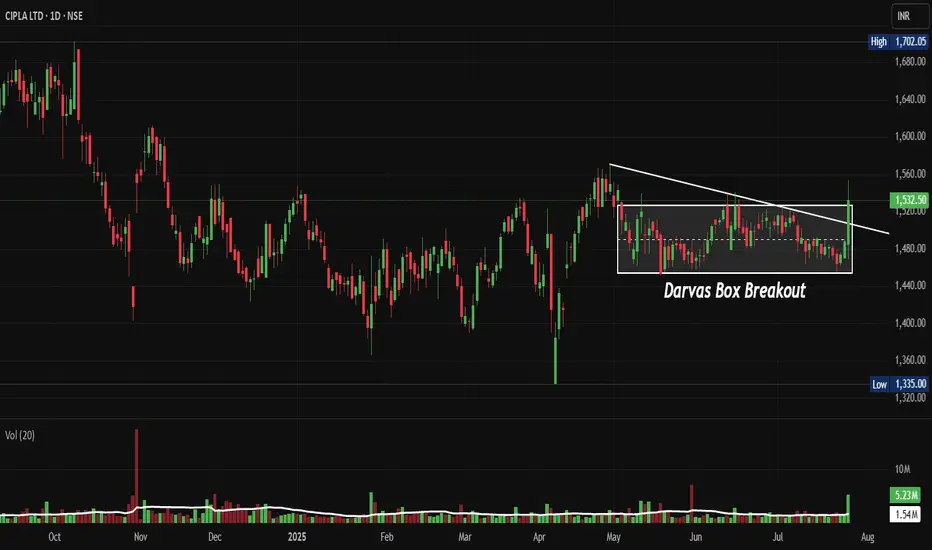
RAIN: Breaks Out of Rising Wedge Pattern Signals Fresh UptrendNSE:RAIN Breaks Out: Rising Wedge Pattern Signals Potential Bullish Run to 180+ Levels
Signals Fresh Uptrend After Months of Consolidation
Price Action:
- NSE:RAIN has been trading within a well-defined rising wedge pattern since March 2025
- The stock has recently broken out above the upper trendline of the wedge at approximately 160 levels
- Current price of 160.74 represents a significant move above the key resistance zone
- The breakout is accompanied by increased volume, suggesting genuine buying interest
Volume Spread Analysis:
• Volume breakout accompanied the wedge pattern breakout
• Higher volumes during up moves compared to down moves indicate bullish participation
• Volume spike visible during the recent breakout at 160+ levels
• Average volume of 972K around today, 3.59M shares with recent surge to higher levels
Base Formation and Accumulation Zone:
• The stock established a strong base between 117-125 levels from March to July 2025
• Multiple retests of the 117 support level showed strong buying interest
• Base formation lasted approximately 4 months, indicating thorough accumulation
• Volume during base formation remained relatively stable with occasional spikes
Key Support and Resistance Levels:
• Primary Support: 117.06 (marked as swing low and base support)
• Secondary Support: 140-145 zone (previous resistance turned support)
• Immediate Resistance: 165-170 zone (next major hurdle)
• Target Resistance: 180-185 zone (measured move target)
• 52-week High: 197.00 (ultimate resistance level)
Technical Patterns:
Rising Wedge Breakout Pattern:
• Clear rising wedge pattern formed over 4-5 months
• Lower highs and higher lows converged into a wedge formation
• Breakout occurred at 160+ levels with strong volume confirmation
• Pattern suggests continuation of the broader uptrend
Trend Analysis:
• Long-term trend: Bullish (higher highs and higher lows since March 2025)
• Medium-term trend: Bullish breakout from consolidation
• Short-term trend: Strong bullish momentum post-breakout
• Moving averages alignment suggests sustained upward momentum
Chart Patterns and Indicators:
• Cup and handle formation visible in the broader timeframe
• Multiple flag patterns during the consolidation phase
• Price above all key moving averages, indicating bullish sentiment
Trade Setup and Strategy:
Entry Levels:
• Aggressive Entry: 155-160 levels (on any minor pullback)
• Conservative Entry: 145-150 levels (on deeper retracement to support)
• Breakout Entry: Above 165 levels with volume confirmation
• averaging between 150-160 for position building
Exit Levels and Targets:
• Target 1: 180-185 levels (initial profit booking - 15-20% upside)
• Target 2: 195-200 levels (testing previous highs - 25-30% upside)
• Target 3: 220-230 levels (extended target - 40-45% upside)
• Swing high exit: Trail stops below key support levels
Stop-Loss Strategy:
• Initial Stop-Loss: Below 140 levels (10-12% risk from current levels)
• Trailing Stop-Loss: Below 150 levels once 180 is achieved
• Pattern Stop-Loss: Below the wedge support around 145 levels
• Time-based stop: Exit if no progress in 2-3 months
Position Sizing and Risk Management:
• Maximum position size: 2-3% of total portfolio
• Risk per trade: Not more than 1% of portfolio value
• Scale in approach: 50% at entry, 30% on dip, 20% on breakout confirmation
• Maintain a risk-reward ratio of a minimum of 1:3
Sectoral and Fundamental Backdrop:
Company Overview:
• NSE:RAIN is one of the world's largest producers of calcined petroleum coke, coal tar pitch and other high-quality basic and speciality chemicals
• Market Cap: 5,405 Crore with Revenue: 15,472 Cr
• Promoter Holding: 41.2% indicating stable management control
Financial Health Assessment:
• The company has a low interest coverage ratio, which poses some financial risk
• Net Profit: ₹-115.10Cr as on March 2025 (Q4 FY25) showing current losses
• The company has delivered a poor sales growth of 4.46% over the past five years
• Recent debt reduction efforts as management focuses on prepaying obligations
Business Segments Performance:
• Carbon Business: Environment-friendly and energy-efficient practices have made RAIN's carbon business highly profitable and sustainable
• The carbon business co-generates energy at six calcined petroleum coke plants with a combined power-generation capacity of approximately 135 MW
• The speciality chemicals segment is showing resilience despite market challenges
Sector Outlook and Industry Trends:
• In 2025, the industry is expected to continue its recovery, adjusting to new market drivers while balancing short- and long-term goals
• Chemical industry focusing on decarbonization and innovation initiatives
• India Ratings affirms Rain Industries' credit rating at IND A/Stable with stable outlook and improved operational outlook
Key Risk Factors:
• Cyclical nature of the chemical industry affecting margins
• High debt levels and interest coverage concerns
• Global economic slowdown has an impact on demand
• Raw material price volatility
• Environmental regulations affecting operations
Positive Catalysts
• Debt reduction strategy showing management commitment
• Stable credit rating with improved operational outlook
• Strong technical breakout indicating renewed investor interest
• Global chemical industry recovery supporting sector sentiment
• Energy co-generation capabilities providing cost advantages
Risk Assessment and Monitoring:
Key Levels to Watch:
• Break below 145: Bearish signal, consider exit
• Sustain above 165: Bullish confirmation for higher targets
• Volume patterns: Declining volume on up moves would be concerning
• Sector rotation: Monitor chemical sector performance relative to the broader market
Regular Review Parameters:
• Weekly closing above key moving averages
• Monthly volume trends and institutional participation
• Quarterly earnings performance and guidance
• Industry developments and regulatory changes
• Management commentary on debt reduction progress
Exit Triggers:
• Fundamental deterioration in business metrics
• Break of key technical support levels
• Adverse sector developments
• Better opportunities in other stocks/sectors
• Achievement of target levels with profit booking
My Take:
NSE:RAIN presents a technically attractive setup with the rising wedge breakout, but investors should be cautious about the fundamental challenges. The trade setup offers good risk-reward ratios for short to medium-term positions, while long-term investors should wait for clearer signs of fundamental improvement.
Keep in the Watchlist and DOYR.
NO RECO. For Buy/Sell.
📌Thank you for exploring my idea! I hope you found it valuable.
🙏FOLLOW for more
👍BOOST if you found it useful.
✍️COMMENT below with your views.
Meanwhile, check out my other stock ideas on the right side until this trade is activated. I would love your feedback.
Disclaimer: "I am not a SEBI REGISTERED RESEARCH ANALYST AND INVESTMENT ADVISER."
This analysis is intended solely for informational and educational purposes and should not be interpreted as financial advice. It is advisable to consult a qualified financial advisor or conduct thorough research before making investment decisions.
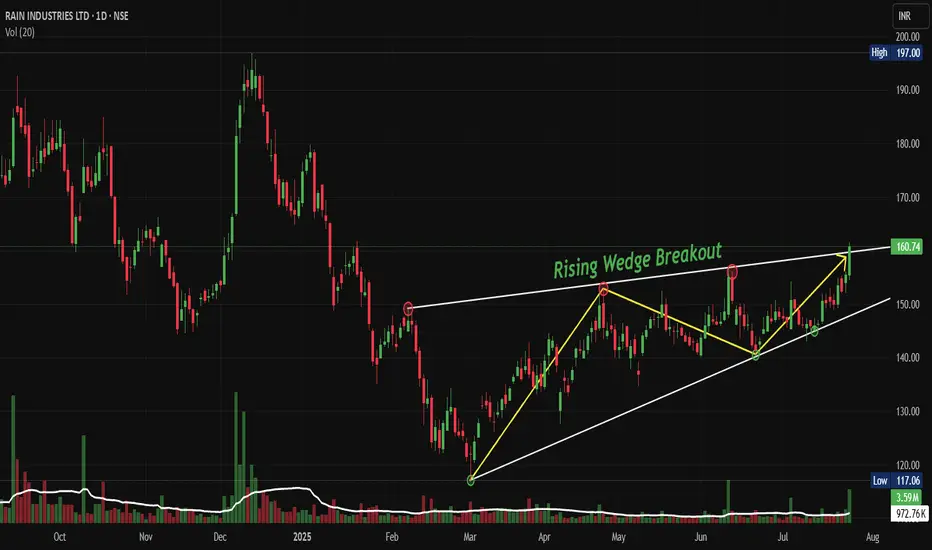
ELGIEQUIP: Breaks Out of its Ascending Triangle PatternNSE:ELGIEQUIP Breaks Out of its Ascending Triangle Pattern: This Industrial Giant Could Be Your Next Multi-Bagger as Manufacturing Boom Accelerates
Price Action:
- Current Price: ₹589.75 (as of chart date)
- 52-Week High: ₹752.95
- 52-Week Low: ₹401.00
- Daily Change: +₹35.95 (+6.41%)
- Market Cap: ₹18,703 Cr.
Volume Spread Analysis:
Volume Profile Assessment:
- Breakout Volume: 6.8M shares (significantly above average)
- Volume Trend: Increasing volume during breakout phase
- Volume-Price Relationship: Positive correlation during an uptrend
- Distribution vs Accumulation: Clear accumulation pattern visible
Volume Indicators:
- 20-day Average Volume: 1.24M shares
- Breakout Volume Confirmation: Yes (above average volume)
- Volume Concentration: Higher volumes at support levels indicate buying interest
My Key Technical Observations:
- Stock has successfully broken out from a major ascending triangle pattern
- Strong volume confirmation on the breakout day
- Price action showing momentum acceleration after months of consolidation
- Clear trend reversal from the March 2025 lows
Pattern Recognition and Structure Analysis:
Primary Pattern: Ascending Triangle Breakout
- Formation Period: Jan 2025 to July 2025 (7 months)
- Resistance Level: ₹570-580 (horizontal resistance)
- Support Trendline: Rising from ₹401 lows in March 2025
- Breakout Confirmation: Volume spike accompanying price breakout
- Pattern Target: ₹680-700 (measuring the height of the triangle base)
Secondary Patterns:
- Double Bottom formation at ₹401 levels (March 2025)
- Flag and pennant consolidations during the uptrend
- Higher highs and higher lows structure since March 2025
Key Support and Resistance:
Key Resistance Levels:
- Immediate Resistance: ₹600-610 (psychological level)
- Major Resistance: ₹650-680 (pattern target zone)
- 52 Week High Resistance: ₹750-755 (previous swing high)
Key Support Levels:
- Immediate Support: ₹560-570 (breakout level, now support)
- Strong Support: ₹520-530 (previous consolidation zone)
- Major Support: ₹480-490 (ascending trendline support)
- Critical Support: ₹440-450 (50% retracement of current move)
Base Formation Analysis:
- Primary Base: ₹480-580 consolidation zone (7 months)
- Base Characteristics: Tight consolidation with reduced volatility
- Base Quality: High-quality base with multiple retests of support/resistance
- Accumulation Evidence: Consistent volume during the consolidation phase
Trade Setup and Entry Strategy:
Primary Trade Setup - Momentum Play:
- Entry Strategy: Buy on pullback to ₹570-575 (breakout retest)
- Alternative Entry: Current levels for aggressive traders
- Entry Rationale: Ascending triangle breakout with volume confirmation
Secondary Trade Setup - Swing Trade:
- Entry Strategy: Accumulate on dips to the ₹520-530 zone
- Entry Rationale: Strong support zone with multiple bounce history
- Time Horizon: 3-6 months
Entry Levels and Execution:
Aggressive Entry (Short-term):
- Entry Price: ₹585-590 (current market price)
- Quantity: 30% of planned position
- Rationale: Momentum continuation play
Conservative Entry (Medium-term):
- Entry Price: ₹570-575 (breakout retest)
- Quantity: 50% of the planned position
- Rationale: Better risk-reward ratio
Value Entry (Long-term):
- Entry Price: ₹520-530 (support zone)
- Quantity: 70% of planned position
- Rationale: High probability support zone
Exit Levels and Profit Targets:
Short-term Targets (1-3 months):
- Target 1: ₹620-630 (5-7% upside from current levels)
- Target 2: ₹650-660 (10-12% upside)
- Target 3: ₹680-690 (pattern target)
Medium-term Targets (3-12 months):
- Target 1: ₹700-720 (psychological resistance)
- Target 2: ₹750-760 (52 Week high retest)
- Target 3: ₹800-820 (extension target)
Exit Strategy:
- Partial Profit Taking: 25% at each target level
- Trailing Stop: Implement after reaching the first target
- Final Exit: Technical breakdown below key support
Stop-Loss Strategy:
Initial Stop-Loss Levels:
- Aggressive Traders: ₹555 (5% below entry)
- Conservative Traders: ₹530 (below support zone)
- Long-term Investors: ₹480 (below ascending trendline)
Stop-Loss Management:
- Initial Risk: 5-10% of entry price
- Trailing Strategy: Move stop-loss to breakeven after 5% profit
- Progressive Tightening: Reduce stop distance as price advances
Position Sizing and Risk Management:
Position Sizing Framework:
- Conservative Approach: 2-3% of portfolio
- Moderate Approach: 3-5% of portfolio
- Aggressive Approach: 5-7% of portfolio
Risk Management Rules:
- Maximum Risk per Trade: 2% of total capital
- Risk-Reward Ratio: Minimum 1:2 for all trades
- Portfolio Concentration: Maximum 10% in a single stock
- Sector Exposure: Maximum 20% in the capital goods sector
Capital Allocation Strategy:
- 30% on initial breakout entry
- 40% on pullback to support
- 30% reserved for additional weakness
Sectoral Backdrop:
Capital Goods Sector Overview:
- Sector Performance: Outperforming broader markets in 2025
- Government Support: PLI schemes boosting manufacturing
- Infrastructure Push: Continued focus on industrial development
- Export Opportunities: Growing global demand for Indian machinery
Industrial Compressor Market Dynamics:
- Market Size: India air compressor market valued at $1.09 billion (2023)
- Growth Projection: Expected to reach $1.64 billion by 2030
- CAGR: 5.4% growth from 2024 to 2030
- Volume Growth: From 64,000 units (2023) to 120,000 units (2030)
Manufacturing Sector Tailwinds:
- Target Achievement: Manufacturing sector expected to reach $1 trillion by 2025
- Industrial Growth: Rapid expansion in the automotive and electronics sectors
- Policy Support: Make in India and PLI schemes driving demand
- Infrastructure Development: Continued capex cycle supporting industrial equipment demand
Fundamental Backdrop:
Company Overview:
- Business: Leading manufacturer of air compressors and pneumatic tools
- Market Position: Strong presence in the industrial compressor segment
- Product Range: Oil-lubricated piston compressors, reciprocating compressors
- Employee Strength: 2,172 employees
Financial Highlights:
- Market Capitalization: ₹ 18,703 Cr.
- EPS (TTM): ₹11.05
- Book Value per Share: ₹58.90
- Price to Book Ratio: 10
- Dividend Yield: 0.37%
Recent Performance:
- Q4 FY25 Revenue: ₹ 993 crore
- Q4 FY25 Net Profit: ₹102.00 crore
- Annual Revenue (FY25): ₹3,510 crore
- Annual Net Profit (FY25): ₹350 crore
Earnings Outlook:
- Next Earnings Report: July 30, 2025 (Expected)
- Annual General Meeting: August 12, 2025 (Expected)
- Dividend Declared: ₹2.20 per share for FY25
- Management Assessment: Economic quality in terms of earnings and margins
Risk Factors and Considerations:
Technical Risks:
- False Breakout Risk: Potential failure to sustain above resistance
- Market Correlation: High correlation with broader market movements
- Sector Rotation: Risk of funds moving away from capital goods
- Volume Sustainability: Need for continued volume support
Fundamental Risks:
- Economic Slowdown: Impact on industrial capex cycles
- Competition Intensity: Pressure from domestic and international players
- Raw Material Costs: Inflation in steel and component prices
- Export Dependency: Global economic uncertainty affecting demand
Market Risks:
- Interest Rate Sensitivity: Impact of monetary policy changes
- Currency Fluctuation: Export revenue exposure to forex volatility
- Regulatory Changes: Potential policy modifications affecting industry
- Liquidity Risk: Lower institutional participation during market stress
My Take:
NSE:ELGIEQUIP presents a compelling technical setup with its successful breakout from a 7-month ascending triangle pattern. The combination of strong volume confirmation, favourable sectoral tailwinds, and robust fundamental positioning makes it an attractive investment opportunity. The stock is well-positioned to benefit from India's manufacturing sector growth and the expanding industrial compressor market.
The risk-reward profile appears favourable for both short-term momentum traders and long-term investors, with multiple entry strategies catering to different risk appetites. However, proper position sizing and disciplined stop-loss management remain crucial for the successful execution of this trade setup.
Keep in the Watchlist and DOYR.
NO RECO. For Buy/Sell.
📌Thank you for exploring my idea! I hope you found it valuable.
🙏FOLLOW for more
👍BOOST if you found it useful.
✍️COMMENT below with your views.
Meanwhile, check out my other stock ideas on the right side until this trade is activated. I would love your feedback.
Disclaimer: "I am not a SEBI REGISTERED RESEARCH ANALYST AND INVESTMENT ADVISER."
This analysis is intended solely for informational and educational purposes and should not be interpreted as financial advice. It is advisable to consult a qualified financial advisor or conduct thorough research before making investment decisions.
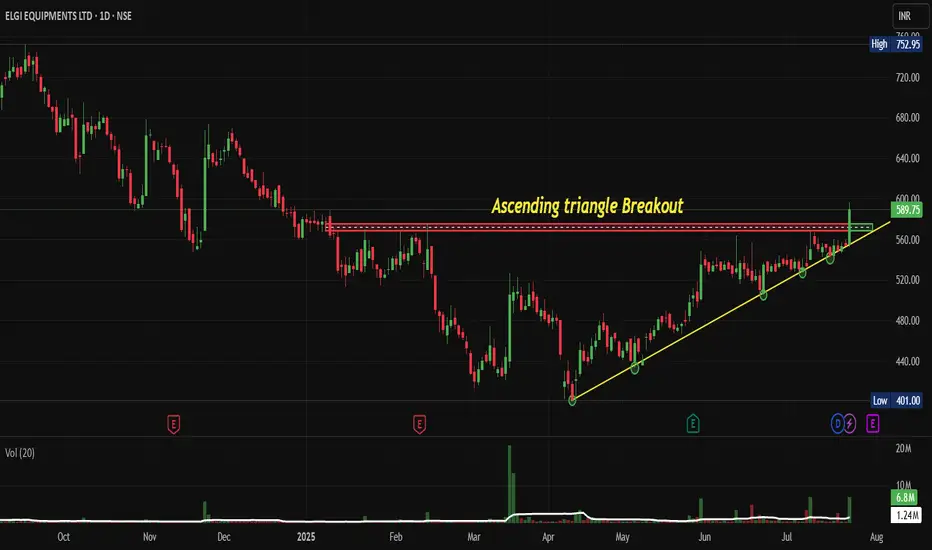
INDIACEM: Trendline Breakout Inside a Rising Wedge PatternNSE:INDIACEM Breaks Key Resistance: Is This the Start of a New Bull Run, after Ultratech Cement's Bullish Commentary Post Results?
Price Action:
• The stock has demonstrated a classic rising wedge pattern formation throughout 2025, indicating controlled accumulation
• Current price of ₹370.95 represents a significant breakout above the Trendline resistance
• The breakout is accompanied by substantial volume expansion (5.61M vs average), confirming institutional participation
• Price has recovered strongly from the March 2025 low of approximately ₹240, representing a 54% rally
Volume Spread Analysis:
• Volume spike visible during the recent breakout phase, indicating genuine buying interest
• Historical volume patterns show increased participation during key support bounces
• Current volume of 821.51K is significantly above average, supporting the breakout thesis
• Volume profile suggests institutional accumulation during the consolidation phases
Technical Patterns and Levels:
Base Formation:
• Primary base established between ₹240-280 levels during February-March 2025
• Secondary base formed around the ₹300-320 range during the wedge consolidation
• Multiple successful tests of these base levels confirm strong demand zones
Support Levels:
• Immediate support: ₹350 (previous resistance now turned support)
• Secondary support: ₹320-330 (wedge midpoint)
• Strong support: ₹300 (multiple bounce level)
• Ultimate support: ₹240-250 (March 2025 low)
Resistance Levels:
• Immediate resistance: ₹380-382 (current high area)
• Next target: ₹400-420 (measured move from wedge)
• Long-term resistance: ₹450-470 (based on pattern projection)
Technical Patterns:
• Rising Wedge Pattern: Successfully above wedge Support with volume
• Trendline Break: Clean break above descending trendline resistance
• Multiple Bottom Formation: Strong base building around ₹240-280 levels
• Volume Expansion: Confirming the validity of the current breakout
Trade Setup:
Entry Strategy:
• Primary Entry: ₹365-370 (current levels on any minor pullback)
• Aggressive Entry: ₹371-375 (momentum continuation)
• Conservative Entry: ₹350-355 (retest of breakout level)
Target Levels:
• Target 1: ₹400 (immediate resistance, 8% upside)
• Target 2: ₹430 (wedge measured move, 16% upside)
• Target 3: ₹470 (extended target, 27% upside)
Stop-Loss Levels:
• Tight Stop: ₹345 (below breakout level, 7% risk)
• Comfortable Stop: ₹320 (below wedge support, 14% risk)
• Long-term Stop: ₹300 (major support breach, 19% risk)
Risk Management:
Position Sizing:
• Conservative Approach: 2-3% of portfolio (given sector volatility)
• Moderate Risk: 4-5% of portfolio for experienced traders
• Maximum allocation: Not more than 7-8% considering stock-specific risks
Risk-Reward Analysis:
• Risk-Reward Ratio: 1:2 to 1:3 depending on entry and stop levels
• Probability of success: High (70-75%) given technical setup
• Time horizon: 3-6 months for target achievement
Portfolio Considerations:
• Diversification across cement stocks recommended
• Monitor sector rotation and infrastructure spending announcements
• Consider hedging through index options if holding large positions
Sectoral and Fundamental Backdrop:
Cement Industry Outlook 2025:
• Industry expects 7-8% growth in cement demand for FY25, driven by infrastructure development
• Government allocated ₹2.87 lakh crore for road infrastructure, supporting cement demand
• Capacity utilization expected to improve to 72% from current levels
• Addition of 35-40 million tonnes of new capacity, primarily in eastern and southern India
India Cements Fundamentals:
• Market capitalization: ₹11,511 crores as of current levels
• Manufacturing capacity: 14.75 MTPA after recent expansions
• Product mix: 35% Ordinary Portland Cement, 65% Portland Pozzolana Cement
• Notable sponsorship: IPL franchise Chennai Super Kings (brand visibility)
• Revenue: ₹1,025 crores in Q1 FY26 (-0.20% YoY decline but improving margins)
Growth Catalysts:
• Infrastructure spending boost from Union Budget 2025-26
• India cement market projected to grow at 7.6% CAGR through 2033
• Rising construction activities in the southern and eastern regions
• Potential for market consolidation benefiting established players
• Promoter holding increased to 81.49% (from 28.42% in June 2024), indicating strong confidence
Risk Factors:
• Raw material cost inflation impacting margins
• Seasonal demand variations affecting quarterly performance
• Competition from larger players like Ambuja Cements
• Environmental regulations potentially increasing compliance costs
• Regional demand concentration in southern markets
My Take:
NSE:INDIACEM presents a compelling technical setup with the successful breakout from a Trendline into a rising wedge pattern. The combination of strong volume support, improving sectoral fundamentals, and a favourable government policy backdrop creates an attractive risk-reward proposition. However, traders should maintain proper position sizing and risk management given the inherent volatility in cement stocks.
Keep in the Watchlist and DOYR.
NO RECO. For Buy/Sell.
📌Thank you for exploring my idea! I hope you found it valuable.
🙏FOLLOW for more
👍BOOST if you found it useful.
✍️COMMENT below with your views.
Meanwhile, check out my other stock ideas on the right side until this trade is activated. I would love your feedback.
Disclaimer: "I am not a SEBI REGISTERED RESEARCH ANALYST AND INVESTMENT ADVISER."
This analysis is intended solely for informational and educational purposes and should not be interpreted as financial advice. It is advisable to consult a qualified financial advisor or conduct thorough research before making investment decisions.
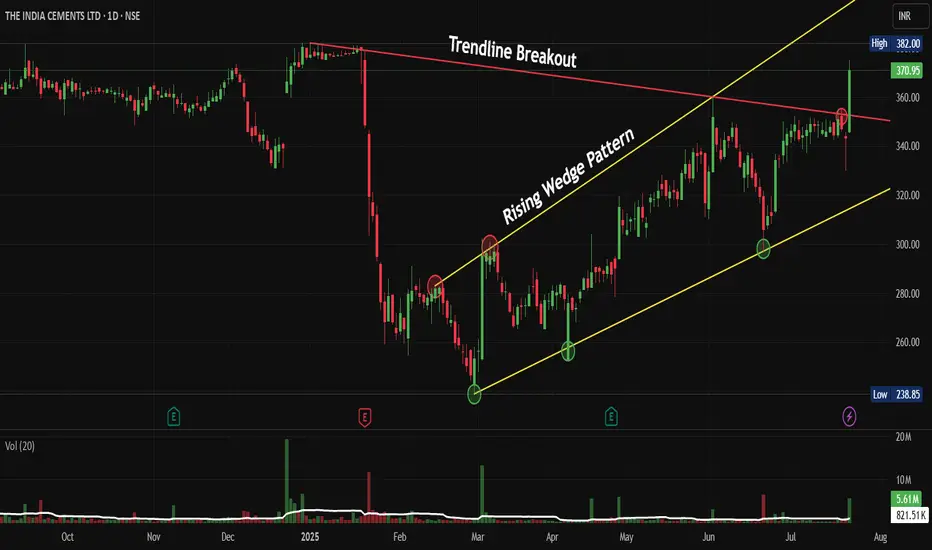
UPL: Rising Wedge Breakout Could Signal Fresh HighsNSE:UPL : Rising Wedge Breakout Could Signal Fresh Highs, But Manage Risk Carefully
Price Action Analysis:
- Current Price: ₹713.75 (+3.92%)
- 52-Week High: ₹717.55
- 52-Week Low: ₹483.70
- The stock is trading near all-time highs with strong momentum
Volume Spread Analysis
- Volume spikes are visible during key breakout points
- Recent volume of 8.07M is above average, confirming breakout attempt
- Volume pattern shows selling pressure during declines and buying interest on rallies
- The volume surge in July suggests institutional participation
Chart Pattern:
Rising Wedge Pattern:
- A classic rising wedge pattern has formed from February 2025 to July 2025
- The pattern shows converging trendlines with higher highs and higher lows
- Volume has been decreasing during the formation, which is typical for rising wedges
- The stock is attempting a breakout from the upper trendline resistance
Key Technical Levels:
Support Levels:
- Immediate Support: ₹680 (recent consolidation zone)
- Strong Support: ₹640 (rising trendline support)
- Major Support: ₹580 (previous resistance turned support)
Resistance Levels:
- Immediate Resistance: ₹720 (psychological level)
- Next Resistance: ₹750 (projected target based on wedge height)
- Extended Target: ₹800 (measured move from base)
Base Formation Analysis:
- The stock formed a solid base between ₹480-₹550 from October 2024 to January 2025
- This accumulation phase lasted approximately 4 months
- Strong buying emerged from the ₹500 level multiple times
- The breakout from this base began in February 2025
Trade Setup:
Entry Strategy:
- Aggressive Entry: ₹714-₹716 (current levels on confirmed breakout)
- Conservative Entry: ₹695-₹700 (on any pullback to support)
- Accumulation Entry: ₹680-₹685 (if stock retraces to wedge support)
Target Levels:
- Target 1: ₹750 (immediate target - 5% upside)
- Target 2: ₹780 (medium-term target - 9% upside)
- Target 3: ₹820 (extended target - 15% upside)
Stop Loss Levels:
- For Aggressive Entry: ₹675 (5.5% risk)
- For Conservative Entry: ₹665 (5% risk)
- For Accumulation Entry: ₹655 (4% risk)
Position Sizing Guidelines:
- Risk per trade: 2% of portfolio maximum
- For ₹100,000 portfolio with ₹714 entry and ₹675 stop: 51 shares maximum
- Adjust position size based on individual risk tolerance
Risk Management Framework:
Trade Management Rules:
- Book 30% profits at Target 1
- Trail stop loss to breakeven after Target 1 is hit
- Book another 40% profits at Target 2
- Let the remaining 30% run with a trailing stop
Risk Factors to Monitor:
- Rising wedge patterns have a 60% failure rate historically
- Global agrochemical sector volatility
- Monsoon dependency for Indian agriculture
- Currency fluctuation impact on exports
Sectoral and Fundamental Backdrop:
Company Overview:
- NSE:UPL provides crop protection solutions, manufacturing and marketing agrochemicals, industrial chemicals, and speciality chemicals
- Global provider with annual revenue exceeding $5 billion, ranking among the top 5 agriculture solutions companies worldwide
Financial Performance:
- Market Cap: ₹58,088 Crore (up 37.1% in 1 year), Revenue: ₹46,637 Cr, Profit: ₹820 Cr
- Revenues grew 8.21% last year.
- The company has delivered a poor sales growth of 5.46% over the past five years
Recent Performance Metrics:
- Year-to-date increase of 29.48%, significantly outperforming the Sensex's 4.44% gain
- Delivered a robust return of 37.1% over the past year, compared to the Sensex's 12.13%
Credit Rating and Outlook:
- Fitch has revised its Long-Term Issuer Default Rating outlook on UPL Corp from 'Negative' to 'Stable', affirming the IDR at 'BB'
Sectoral Outlook:
- The company focuses on reducing environmental impact while enhancing soil health and water conservation through sustainable agriculture
- UPL ranked No. 1 globally in the agrochemical sector by Sustainalytics
- Growing focus on biological solutions and sustainable farming practices
Recent Corporate Actions:
- UPL's subsidiary to acquire 100% of Wuhan Advanta Seeds for USD 4,200 by Sept 2025
- Strategic partnership with Indian Potash Limited to revolutionise sugarcane farming in India
Investment/Trading Thesis:
Positive Factors:
- Strong technical breakout from the rising wedge pattern on cards
- Outperforming the broader market significantly
- Leading position in the global agrochemical sector
- Strategic acquisitions and partnerships
- Improved credit rating outlook
Risk Considerations:
- The company has a low interest coverage ratio
- Historical slow sales growth over 5 years
- Monsoon and weather dependency
- Rising wedge patterns can be bearish reversal signals
- Global commodity price volatility
My Take:
NSE:UPL presents a compelling technical setup with fundamental tailwinds from the agricultural sector. The rising wedge breakout, if sustained, could lead to significant upside. However, traders should maintain strict risk management given the pattern's inherent risks and the company's mixed fundamental metrics.
Keep in the Watchlist and DOYR.
NO RECO. For Buy/Sell.
📌Thank you for exploring my idea! I hope you found it valuable.
🙏FOLLOW for more
👍BOOST if you found it useful.
✍️COMMENT below with your views.
Meanwhile, check out my other stock ideas on the right side until this trade is activated. I would love your feedback.
Disclaimer: "I am not a SEBI REGISTERED RESEARCH ANALYST AND INVESTMENT ADVISER."
This analysis is intended solely for informational and educational purposes and should not be interpreted as financial advice. It is advisable to consult a qualified financial advisor or conduct thorough research before making investment decisions.
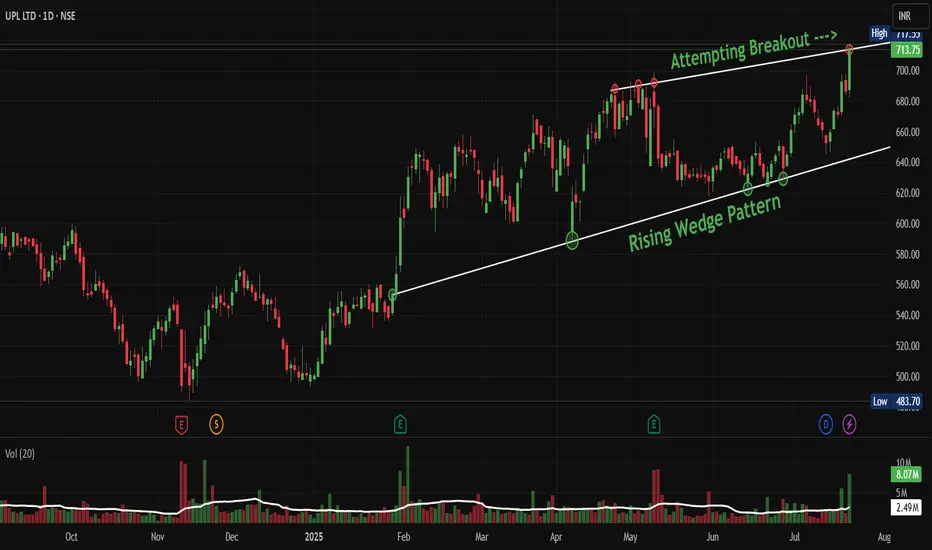
RRKABEL: Cup & Handle Pattern Could Trigger 30% Upside RallyNSE:RRKABEL Perfect Storm: How Cup & Handle Pattern Could Trigger 30% Upside Rally
Price Action Analysis:
Candlestick Patterns:
- Doji Formation: Multiple doji candles during handle formation indicate indecision and potential reversal
- Bullish Engulfing: Strong bullish engulfing pattern on breakout day, showing buying pressure
- Higher Highs/Lows: Clear pattern of higher highs and higher lows post-breakout
- Rejection Candles: Long lower wicks during handle formation show buying support
Price Structure:
- Swing: Clear swing low at ₹853 (March 2025) and swing high at ₹1,850 (previous year)
- Impulse Waves: Strong impulsive moves during the breakout phase indicate institutional participation
- Corrective Waves: Orderly corrective structure during cup and handle formation
- Price Momentum: Accelerating price momentum post-breakout with minimal pullbacks
Market Structure:
- Trend: Transition from downtrend to sideways consolidation to uptrend
- Support Respect: Multiple tests of support levels without breakdown showing strength
- Resistance Breaks: Clean break above multiple resistance levels with conviction
- Price Velocity: Increasing price velocity on breakout indicates strong momentum
Intraday Price Action:
- Opening Gaps: Positive opening gaps during the breakout phase show overnight interest
- Closing Strength: Consistent closing in the upper portion of the daily range
- Pullback Behaviour: Shallow pullbacks with quick recoveries indicate a strong underlying bid
- Volume-Price Sync: Price advances accompanied by volume expansion
Volume Spread Analysis:
Volume Patterns:
- Base Formation: Declining volume during cup formation indicates a lack of selling pressure
- Handle Volume: Minimal volume during handle formation, showing controlled supply
- Breakout Volume: Significant volume spike on breakout confirming institutional participation
- Volume Trend: Above-average volume sustaining post-breakout
Volume Indicators:
- Accumulation Phase: Volume patterns suggest institutional accumulation during the base
- Breakout Confirmation: 2-3x average volume on breakout day
- Follow-through: Consistent volume support in subsequent sessions
- Volume Price Analysis: Positive volume-price correlation during upward movement
Technical Patterns:
Primary Pattern: Cup & Handle Formation
- Cup Formation: The stock formed a classical cup pattern from Jan 2025 to March 2025, with the left rim at approximately ₹1,420 levels
- Handle Formation: A clean handle pattern developed from May to July 2025, showing controlled consolidation with diminishing volume
- Breakout Confirmation: Strong breakout above ₹1,420 resistance with increased volume, signalling pattern completion
- Pattern Reliability: The 6-month cup formation provides a strong technical foundation for sustained upward momentum
Secondary Pattern: Ascending Triangle
- Formation Period: June to July 2025 within the handle structure
- Resistance Level: Horizontal resistance at ₹1,420 tested multiple times
- Support Trend: Rising support line indicating accumulation phase
- Breakout: Clean breakout above triangle resistance with volume expansion
Support & Resistance Levels:
Key Support Levels:
- Immediate Support: ₹1,350 (breakout pullback level)
- Secondary Support: ₹1,280 (handle low)
- Major Support: ₹1,200 (psychological level and previous resistance)
- Critical Support: ₹1,080 (cup base level)
Key Resistance Levels:
- Immediate Resistance: ₹1,500 (psychological level)
- Target Resistance: ₹1,650 (cup depth projection)
- Extended Target: ₹1,800 (previous swing high)
- Long-term Resistance: ₹1,850 (52-week high)
Base Analysis:
Base Characteristics:
- Base Type: Cup with handle base formation
- Duration: 7 months (Jan 2025 to July 2025)
- Depth: Approximately 35% correction from highs
- Volume Pattern: Declining volume during base formation, expanding on breakout
- Base Quality: High-quality base with proper structure and time frame
Base Strength Indicators:
- Volatility Contraction: Price volatility decreased during handle formation
- Volume Dry-up: Minimal selling pressure during consolidation
- Support Holding: Multiple tests of support levels without breakdown
- Institutional Activity: Likely accumulation phase based on volume patterns
Trade Setup:
Entry Strategy:
- Primary Entry: ₹1,420-1,430 (on breakout confirmation)
- Secondary Entry: ₹1,380-1,400 (on pullback to breakout level)
- Aggressive Entry: ₹1,350-1,360 (deeper pullback support)
Entry Confirmation Signals:
- Volume Expansion: Minimum 1.5x average volume on entry
- Price Action: Close above ₹1,420 for two consecutive sessions
- Momentum: RSI above 50 and trending upward
- Moving Averages: Price above 20 and 50-day moving averages
Exit Levels:
Profit Targets:
- Target 1: ₹1,500 (5.5% upside) - Psychological resistance
- Target 2: ₹1,650 (16% upside) - Cup depth projection
- Target 3: ₹1,800 (27% upside) - Previous swing high
- Extended Target: ₹1,850 (30% upside) - 52-week high
Exit Strategy:
- Partial Profit: Book 25% at Target 1
- Scale Out: 50% at Target 2
- Trailing Stop: Implement 8-10% trailing stop after Target 2
- Final Exit: Complete exit at Target 3 or on stop-loss trigger
Stop-Loss Strategy:
Stop-Loss Levels:
- Conservative: ₹1,320 (7% below entry)
- Moderate: ₹1,280 (10% below entry)
- Aggressive: ₹1,250 (12% below entry)
Stop-Loss Management:
- Initial Stop: Below handle low at ₹1,280
- Trailing Stop: Move to breakeven after 5% profit
- Progressive Stops: Raise stops with each target achievement
- Time Stop: Exit if no progress within 4-6 weeks
Position Sizing:
Risk-Based Sizing:
- Conservative Approach: 1-2% of portfolio risk
- Moderate Approach: 2-3% of portfolio risk
- Aggressive Approach: 3-5% of portfolio risk
Position Calculation:
- Risk Per Share: Entry price minus stop-loss level
- Position Size: (Portfolio Risk Amount) / (Risk Per Share)
- Example: For ₹1,400 entry with ₹1,280 stop, risk = ₹120 per share
- Capital Allocation: Maximum 5-8% of total portfolio in a single position
Risk Management:
Risk Control Measures:
- Position Sizing: Limit individual position to 5% of portfolio
- Stop-Loss Discipline: Strict adherence to predetermined stop levels
- Diversification: Maintain exposure across multiple sectors
- Correlation Risk: Avoid concentration in similar cable stocks
Risk Monitoring:
- Daily Monitoring: Track volume, price action, and sector performance
- Weekly Review: Assess progress toward targets and adjust stops
- News Monitoring: Stay updated on company and sector developments
- Market Correlation: Monitor broader market conditions
Sectoral Backdrop:
Indian Cable Industry Outlook:
- Market Growth: The market is projected to grow from USD 10.01 billion in 2025 to USD 17.08 billion by 2032, exhibiting a CAGR of 7.94% during the forecast period
- Infrastructure Push: India's National Grid capacity is expanding continuously under the PM Gati Shakti National Master Plan, which is expected to add around 26,988 circuit km capacity by 2024-2025
- Renewable Energy: India has observed a substantial rise in the demand for wires and cables due to the country's ambitious renewable energy goals
Growth Drivers:
- Smart Cities: The development of smart cities in the country, along with the increase in electronic devices in the household, would increase the demand
- Government Investment: India Wires and Cables Market would grow on the back of rapidly growing investment by the government towards the development of infrastructural projects
- Electrification: Growing electricity demand is driving transmission and distribution network expansion
Fundamental Backdrop:
Company Profile:
- Market Position: RR Kabel is now the 4th largest W&C Company in India by value.
- Global Presence: With a global presence spanning over 67 countries, this electrical company has established a strong international footprint
- Financial Performance: Revenue: 7,618 Cr · Profit: 312 Cr
Financial Metrics:
- Market Cap: Mkt Cap: 16,529 Crore (down -17.5% in 1 year)
- Valuation: Stock is trading at 7.68 times its book value
- Promoter Holding: Promoter Holding: 61.8%
- 52-Week Range: The 52-week high is ₹1825 and the 52-week low is ₹750
Investment Considerations:
- Sector Tailwinds: Strong sectoral growth prospects with government infrastructure push
- Market Leadership: Established position as the 4th largest cable company in India
- International Exposure: Diversified revenue streams from 67 countries
- Valuation Concerns: Recent 22.8% decline in market cap may indicate value opportunity
My Take:
The technical setup for NSE:RRKABEL presents a compelling opportunity with the successful completion of a cup and handle pattern. The 8-month base formation, combined with strong sectoral tailwinds and the company's market leadership position, creates a favourable risk-reward scenario. The breakout above ₹1,420 with volume confirmation suggests institutional participation and potential for sustained upward momentum toward the ₹1,650-1,800 target range.
Key success factors include strict adherence to stop-loss levels, proper position sizing, and monitoring of broader market conditions. The sectoral growth prospects, driven by infrastructure development and renewable energy initiatives, provide fundamental support for the technical breakout.
Keep in the Watchlist and DOYR.
NO RECO. For Buy/Sell.
📌Thank you for exploring my idea! I hope you found it valuable.
🙏FOLLOW for more
👍BOOST if you found it useful.
✍️COMMENT below with your views.
Meanwhile, check out my other stock ideas on the right side until this trade is activated. I would love your feedback.
Disclaimer: "I am not a SEBI REGISTERED RESEARCH ANALYST AND INVESTMENT ADVISER."
This analysis is intended solely for informational and educational purposes and should not be interpreted as financial advice. It is advisable to consult a qualified financial advisor or conduct thorough research before making investment decisions.