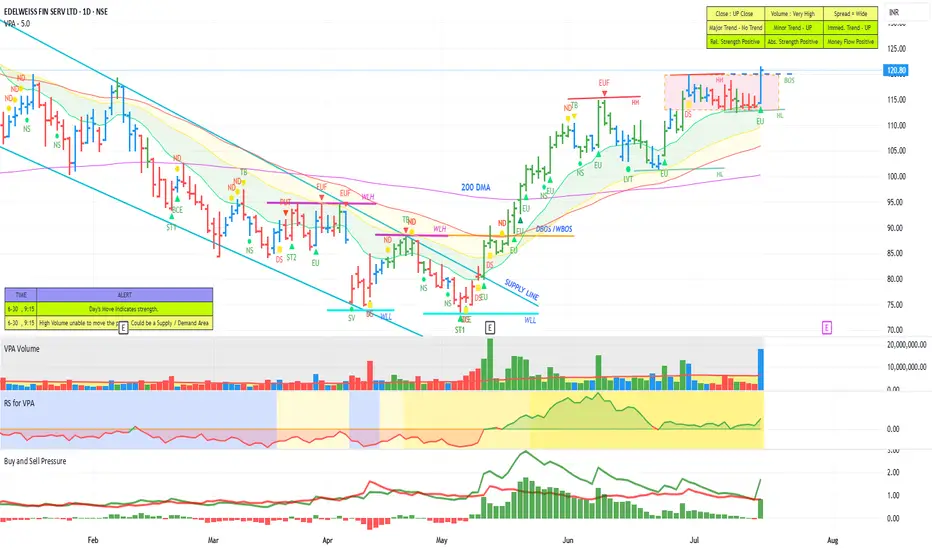
EDELWEISS - Moving to the Next Orbit?Stock continue to making Higher high and Higher Lows. A small consolidation and then a Break of structure with a high volume Bullish wide spread up bar. Relative strength, Money Flow and Buying pressure lending support. The stock seems poised to move in to the next orbit.
Volumespreadanalysis
KIRLPNU: Technical Breakout Attempt That Could Deliver 25% ReturNSE:KIRLPNU : A Technical Breakout Attempt That Could Deliver 25% Returns
Price Action Analysis:
- Current Price: Rs 1,511.20
- Day's High: Rs 1,817.00
- Day's Low: Rs 953.00
- Volume: 152.69K shares
Volume Spread Analysis:
Volume Profile:
- Significant volume spike during recent breakout attempt
- Volume during consolidation was relatively lower
- Current volume suggests institutional buying
- Volume trend supports price movement authenticity
Volume Indicators:
- Volume surge above 20-day average confirms breakout attempt
- Price-volume divergence absent, indicating a healthy move
- The accumulation phase is visible in the volume profile during base formation
Key Technical Observations:
- The stock has shown a strong upward momentum with a significant gap-up movement
- Price has moved from the consolidation zone around Rs 1,350-1,400 to the current levels
- Strong volume surge indicating institutional participation
- Daily candlestick pattern shows bullish momentum with long green candles
Technical Levels & Pattern Analysis:
Support Levels:
- Immediate Support: Rs 1,350-1,380 (previous resistance turned support)
- Strong Support: Rs 1,250-1,300 (multiple touch points)
- Major Support: Rs 1,100-1,150 (significant accumulation zone)
Resistance Levels:
- Immediate Resistance: Rs 1,550-1,580 (red horizontal line marked on chart)
- Next Resistance: Rs 1,650-1,700 (psychological level)
- Major Resistance: Rs 1,800-1,850 (day's high region)
Base Formation:
- Multi-month base formation visible from December 2024 to June 2025
- Consolidation range: Rs 1,100 to Rs 1,400
- Base breakout occurred around Rs 1,380-1,400 levels
- Volume expansion during breakout confirms strength
Technical Patterns:
- Cup and Handle pattern completion with breakout attempt
- Ascending triangle formation during the consolidation phase
- Bullish flag pattern on shorter timeframes
- Higher highs and higher lows trend intact
Trade Setup:
Entry Strategy:
- Primary Entry: Rs 1,480-1,520 (current market price on dips)
- Secondary Entry: Rs 1,350-1,380 (on pullback to support)
- Aggressive Entry: Rs 1,540-1,560 (breakout continuation)
Target Levels:
- Target 1: Rs 1,650-1,700 (8-12% upside)
- Target 2: Rs 1,800-1,850 (18-22% upside)
- Target 3: Rs 1,950-2,000 (25-30% upside)
Stop Loss Levels:
- Conservative Stop Loss: Rs 1,320 (below major support)
- Aggressive Stop Loss: Rs 1,420 (below immediate support)
- Trailing Stop Loss: Rs 1,480 (after first target achievement)
Risk Management:
Position Sizing:
- Conservative traders: 2-3% of portfolio
- Moderate traders: 4-5% of portfolio
- Aggressive traders: 6-8% of portfolio
- Risk per trade should not exceed 1-2% of total capital
Risk Assessment:
- Risk-Reward Ratio: 1:2 to 1:3 (favorable)
- Maximum drawdown potential: 12-15%
- Probability of success: 65-70% based on technical setup
Money Management Rules:
- Never risk more than 2% of capital per trade
- Use position sizing based on stop loss distance
- Maintain diversification across sectors
- Book partial profits at predetermined levels
Sectoral Backdrop:
Industry Overview:
- NSE:KIRLPNU is engaged in the manufacturing and service of engineering goods, operating through the Compression Systems Segment, comprising air and gas compressors, air-conditioning and refrigeration
- Industrial air compressor market to grow at 8.2% CAGR (2023-2033) with market share to reach US$6.86 Billion by 2033
Market Dynamics:
- India Air Compressor Market is forecast to reach $995 million by 2030, after growing at a CAGR of 5.2% during 2024-2030
- Manufacturing is expected to contribute 39.1% share of the market in 2025, as the industry relies heavily on compressed air for pneumatic tools
Growth Drivers:
- Increasing industrialization and infrastructure development
- Rising demand from the manufacturing and automotive sectors
- Energy-efficient compressor adoption
- Government initiatives supporting industrial growth
Fundamental Backdrop:
Financial Performance:
- Market Cap: 9,797 Crore with Revenue of 1,629 Cr and Profit of 211 Cr
- Revenue: ₹583Cr as on March 2025 (Q4 FY25) with Net Profit: ₹81Cr
- Annual revenue growth of 23% is outstanding, Pre-tax margin of 17% is great, ROE of 21.1% is exceptional, ROCE of 28.3% is also exceptional
Key Metrics:
- The stock is trading at 8.95 times its book value
- The company is debt-free and has a strong balance sheet, enabling stable earnings growth
- Promoter holding has decreased over the last 3 years: -14.8% with current Promoter Holding: 38.85%
Analyst Outlook:
- Recent research reports show an average share price target of 1784
- Strong financial metrics support technical breakout
- Debt-free status provides financial flexibility
- Consistent profitability across business cycles
Investment Thesis Summary:
Bullish Factors:
- Strong technical breakout attempt with volume confirmation
- Robust financial performance with 23.14% revenue growth
- Favourable industry growth prospects
- Debt-free balance sheet providing stability
Risk Factors:
- General market volatility
- Sector-specific cyclical risks
- Global economic uncertainties
- Promoter holding reduction trend
My Take:
NSE:KIRLPNU presents a compelling technical setup with strong fundamental backing. The recent breakout attempt from multi-month consolidation, supported by volume surge and positive sector outlook, creates an attractive risk-reward opportunity for medium-term investors. The company's strong financial metrics and debt-free status add confidence to the technical setup.
Keep in the Watchlist.
NO RECO. For Buy/Sell.
📌Thank you for exploring my idea! I hope you found it valuable.
🙏FOLLOW for more
👍BOOST if you found it useful.
✍️COMMENT below with your views.
Meanwhile, check out my other stock ideas on the right side until this trade is activated. I would love your feedback.
Disclaimer: "I am not a SEBI REGISTERED RESEARCH ANALYST AND INVESTMENT ADVISER."
This analysis is intended solely for informational and educational purposes and should not be interpreted as financial advice. It is advisable to consult a qualified financial advisor or conduct thorough research before making investment decisions.

PPLPHARMA: 8 Month Slopping Downwards Trendline BreakoutNSE:PPLPHARMA : This Pharma Stock Broke Out of Its Descending Triangle Prison
Price Action:
- Current Price: ₹216.22 (as of July 15, 2025)
- 52-week Range: ₹181.73 - ₹307.90
- The stock has been in a clear descending triangle pattern since November 2024
- Price has been consistently making lower highs while finding support around the ₹190-200 zone
- Recent price action shows signs of consolidation near the apex of the triangle
Volume Spread Analysis:
- Average daily volume: 4.68M shares
- Volume spikes were observed during significant price movements in November 2024 and March 2025
- Recent volume has been relatively subdued, indicating a lack of conviction in either direction
- Volume pattern suggests an accumulation phase with periodic distribution
Key Technical Levels:
Support Levels:
- Primary Support: ₹190-200 (multiple tests, strong base)
- Secondary Support: ₹181.73 (52-week low)
- Psychological Support: ₹175-180 zone
Resistance Levels:
- Immediate Resistance: ₹230-240 (descending trendline)
- Secondary Resistance: ₹250-260 (previous swing high)
- Major Resistance: ₹280-290 (November 2024 high)
Base Formation:
- The stock has formed a solid base between ₹190-220 over the past 4 months
- This base represents a potential accumulation zone for institutional investors
- The horizontal support at ₹200 has been tested multiple times, showing its significance
Technical Patterns:
- Primary Pattern: Descending Triangle
- Secondary Pattern: Potential Cup and Handle formation if the stock breaks above ₹240
- The descending triangle spans approximately 8 months, making it a significant pattern
Trade Setup:
Entry Strategy:
- Breakout Entry: Buy above ₹240 with volume confirmation
- Support Entry: Buy near ₹200-205 for swing trade
- Conservative Entry: Wait for weekly close above ₹245 for momentum play
Exit Levels:
- Short-term Target: ₹260-270
- Medium-term Target: ₹290-300
- Long-term Target: ₹350-380
Stop-Loss Levels:
- For breakout trades: ₹225 (below breakdown level)
- For support trades: ₹185 (below 52-week low)
- Trailing stop: 8-10% below entry price
Position Sizing:
- Risk per trade: Maximum 2% of portfolio
- For ₹240 entry with ₹225 stop: Position size = (Portfolio × 0.02) / 15
- Suggested allocation: 1-2% of total portfolio for this trade
Risk Management:
- Maximum holding period: 3-6 months
- Review position if stock fails to break ₹240 within 4 weeks
- Partial profit booking at ₹270 (book 50% position)
- Trail stop-loss after first target achievement
Sectoral and Fundamental Backdrop:
Sectoral Analysis:
- The India Pharmaceutical Market size is estimated at USD 66.66 billion in 2025, and is expected to reach USD 88.86 billion by 2030, at a CAGR of 5.92% during the forecast period (2025-2030)
- India's pharmaceutical industry ranks third globally in pharmaceutical production by volume and 14th by value, supported by a well-established domestic sector comprising approximately 3,000 drug companies and over 10,000 custom manufacturing units
- The Indian pharmaceuticals industry is expected to grow 9-11% in the financial year 2024, as per ICRA
- The biosimilars market in India is expected to grow at a CAGR of 22%, reaching USD 12 billion by 2025, representing nearly 20% of the country's pharmaceutical market
Company Fundamentals:
- Market Cap: 28,745 Crore (up 42.2% in 1 year), Revenue: 9,151 Cr, Profit: 91.1 Cr
- Stock is trading at 3.53 times its book value
- The company has a low interest coverage ratio, Promoter Holding: 34.94%
- The P/E ratio of Piramal Pharma Ltd is 324 times as on 15-July-2025, a 651% premium to its peers' median range of 33.45 times
Business Overview:
- The company has a 49% ownership interest in a joint venture with Allergan India Pvt. Ltd (Avvyie, a US pharmaceutical company, holds a 51% ownership interest), which is one of the leading pharmaceutical companies in Ophthalmology formulations in India
- Strong presence in glaucoma and dry eye treatments
- Diversified portfolio across multiple therapeutic areas
Analyst Targets:
- Recent research reports show an average share price target of 253
- The estimated share price target for 2025 can range from ₹198 to ₹350
Investment Thesis:
Bullish Factors:
- Strong sectoral tailwinds with the Indian pharma market growing at 5.92% CAGR
- Solid base formation indicating institutional accumulation
- Reasonable valuation compared to growth prospects
- Strategic partnership with Allergan provides a competitive advantage
Risk Factors:
- A high P/E ratio indicates expensive valuation
- A low interest coverage ratio suggests financial stress
- Regulatory changes in the pharmaceutical sector
My Take:
NSE:PPLPHARMA presents a mixed technical picture with a descending triangle pattern Breakout but strong support base. The stock is at a crucial juncture where a breakout above ₹240 could lead to significant upside, while a breakdown below ₹190 would confirm further weakness. Given the positive sectoral outlook and the company's strategic positioning, a breakout trade above ₹240 with proper risk management offers favorable risk-reward ratio.
Keep in the Watchlist.
NO RECO. For Buy/Sell.
📌Thank you for exploring my idea! I hope you found it valuable.
🙏FOLLOW for more
👍BOOST if you found it useful.
✍️COMMENT below with your views.
Meanwhile, check out my other stock ideas on the right side until this trade is activated. I would love your feedback.
Disclaimer: "I am not a SEBI REGISTERED RESEARCH ANALYST AND INVESTMENT ADVISER."
This analysis is intended solely for informational and educational purposes and should not be interpreted as financial advice. It is advisable to consult a qualified financial advisor or conduct thorough research before making investment decisions.
Rossari: Ready to Break Out from Multi-Month ConsolidationNSE:ROSSARI : Hidden Gem Ready to Break Out from Multi-Month Consolidation - My Technical Analysis & Trade Setup on this beautiful Chart Structure
Price Action:
- Stock has been in a prolonged consolidation phase since March 2025, after a significant decline from highs near 970 levels
- Current price action shows the formation of a symmetrical triangle pattern with converging trend lines
- Recent price movement indicates a potential breakout attempt with increased volume participation
- The stock has found strong support around 580-600 levels and resistance near the 720-740 zone
Volume Spread Analysis:
Volume Characteristics:
- Volume has been declining during the consolidation phase, which is typical for triangle patterns
- Recent sessions show increasing volume participation, suggesting institutional interest
- Volume spike during recent upward movement indicates genuine buying interest
- Average volume appears to be around 300-400K shares, with recent pickup to 620K+
Volume Confirmation Signals:
- Higher volume on up days compared to down days in recent sessions
- Volume expansion during the recent breakout attempt
- Accumulation pattern visible in volume profile during base formation
Base Formation:
- Primary base formation: Large consolidation base formed between 580-740 levels over 7+ months
- Base characteristics: Symmetrical triangle with higher lows
- Base depth: Approximately 27% from resistance to support levels
- Time duration: An Extended 7-month base suggests a strong accumulation phase
Key Support and Resistance Levels:
- Immediate Support: 680-690 (recent swing low)
- Major Support: 580-600 (tested multiple times, strong buying interest)
- Immediate Resistance: 720-740 (upper trend line of triangle)
- Major Resistance: 800-820 (previous significant resistance zone)
- Ultimate Resistance: 900-920 (prior consolidation area)
Technical Patterns:
- Primary Pattern: Symmetrical Triangle
- Secondary Pattern: Potential Cup and Handle formation within the larger triangle
- Volume Pattern: Decreasing volume during consolidation with recent pickup suggesting breakout preparation
- Price compression: Narrowing price range indicates imminent directional move
Trade Setup:
Entry Strategy:
- Primary Entry: On breakout above 720-725 with volume confirmation
- Secondary Entry: On pullback to 700-705 levels after successful breakout
- Aggressive Entry: Current levels around 704-706 for risk-tolerant traders
Exit Levels:
- Target 1: 760-770 (measured move from triangle base)
- Target 2: 800-820 (previous resistance zone)
- Target 3: 860-880 (extended target based on base depth)
- Ultimate Target: 920-950 (full triangle breakout target)
Stop-Loss Strategy:
- Conservative Stop-Loss: Below 680 (recent swing low)
- Aggressive Stop-Loss: Below 695 (intraday support)
- Trailing Stop: Move to breakeven once Target 1 is achieved
Position Sizing:
- Risk per trade: Maximum 2% of portfolio
- Position size calculation: Based on stop-loss distance from entry
- For entry at 705 with stop at 680: Risk of 25 points allows for appropriate position sizing
- Recommended allocation: 3-5% of portfolio for medium-term holding
Risk Management:
- Maximum drawdown tolerance: 3-4% from entry point
- Partial profit booking at each target level (25% at each target)
- Trailing stop-loss implementation after achieving Target 1
- Time-based exit if no progress within 3-4 weeks
Sectoral and Fundamental Backdrop:
Sector Overview:
- The speciality chemicals sector is showing resilience in the current market conditions
- Increasing demand for sustainable and eco-friendly chemical solutions
- The government push for domestic manufacturing under PLI schemes
- Growing export opportunities in the speciality chemicals space
Company Fundamentals:
- Business Profile: Speciality chemicals manufacturer focusing on home, personal care, and fabric care segments
- Revenue Growth: Consistent growth trajectory in recent quarters
- Market Position: Strong presence in domestic market with expanding export footprint
- Product Portfolio: Diversified range of speciality chemicals and ingredients
Industry Tailwinds:
- Increasing consumer spending on personal care products
- Growing demand for sustainable and biodegradable chemical products
- Import substitution opportunities in speciality chemicals
- Rising per capita income is driving demand for quality personal care products
Fundamental Catalysts:
- New product launches and capacity expansions
- Strategic partnerships and collaborations
- Improving operational efficiency and margin expansion
- Strong balance sheet supporting growth investments
Risk Factors:
Technical Risks:
- Failure to sustain above 720 levels could lead to further consolidation
- Breakdown below 680 could trigger deeper correction to 600-620 levels
- Low liquidity may result in higher volatility during a breakout
Fundamental Risks:
- Raw material price inflation is impacting margins
- Competitive pressure from larger players
- Regulatory changes affecting product approvals
- Currency fluctuation impact on export revenues
My Take:
NSE:ROSSARI presents an attractive risk-reward setup with a well-defined technical pattern and strong fundamental backdrop. The extended consolidation phase suggests substantial energy is building up for the next directional move. With proper risk management and disciplined execution, this setup offers multiple target levels for profit booking while maintaining manageable downside risk.
Keep in the Watchlist.
NO RECO. For Buy/Sell.
📌Thank you for exploring my idea! I hope you found it valuable.
🙏FOLLOW for more
👍BOOST if you found it useful.
✍️COMMENT below with your views.
Meanwhile, check out my other stock ideas on the right side until this trade is activated. I would love your feedback.
Disclaimer: "I am not a SEBI REGISTERED RESEARCH ANALYST AND INVESTMENT ADVISER."
This analysis is intended solely for informational and educational purposes and should not be interpreted as financial advice. It is advisable to consult a qualified financial advisor or conduct thorough research before making investment decisions.
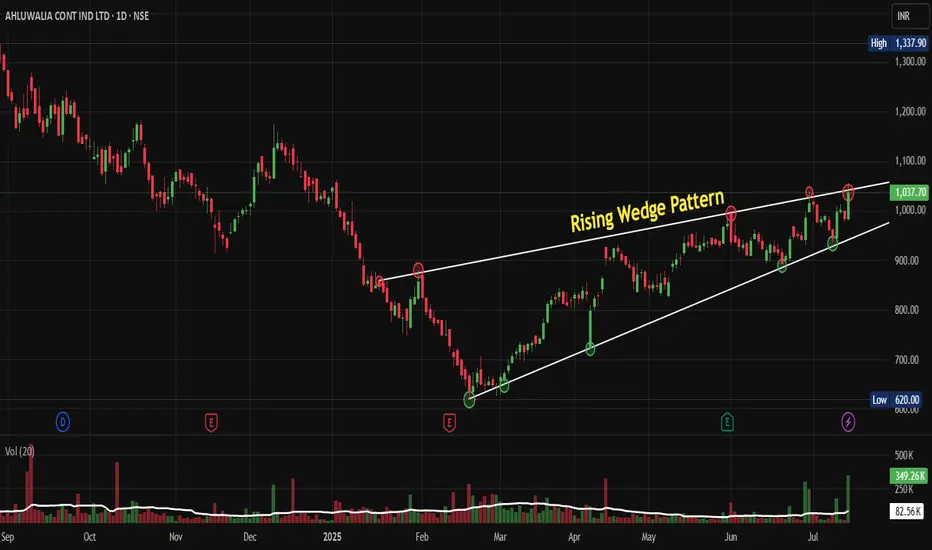
AHLUCONT: Rising Wedge pattern formationNSE:AHLUCONT Rising from the Ashes: How This Construction Giant is Trying to Break Out of Its Year-Long Consolidation Pattern. Let's Analyze
Price Action Analysis:
• The stock is displaying a classic Rising Wedge pattern formation over the past several months
• Current price of ₹1,037.70 represents a +54.00 gain (+5.49%) from the previous close
• The stock has established a strong base formation around the ₹620-650 levels as indicated by the low marker
• Multiple higher lows have been formed along the rising trendline, demonstrating buying interest at progressively higher levels
• The pattern shows a narrowing price range as it approaches the apex, typical of wedge formations
Volume Spread Analysis:
• Volume has been relatively subdued during the consolidation phase, which is characteristic of wedge patterns
• Recent session shows increased volume at 349.26K compared to the average, suggesting institutional participation
• Volume spikes appear to coincide with key support and resistance tests, indicating active participation at critical levels
Key Technical Levels:
Support Levels:
• Primary Support: ₹950-970 (recent breakout level)
• Secondary Support: ₹850-880 (previous consolidation zone)
• Major Support: ₹620-650 (base formation area)
Resistance Levels:
• Immediate Resistance: ₹1,050-1,070 (psychological level)
• Key Resistance: ₹1,100-1,120 (pattern target)
• Major Resistance: ₹1,300-1,337 (52-week high zone)
Technical Patterns:
• Rising Wedge Pattern: The stock has formed a rising wedge over several months, which typically indicates a continuation pattern in an uptrend
• Base Formation: A solid base has been established in the ₹620-650 range, providing strong support for future moves
Trade Setup:
Entry Strategy:
• Primary Entry: ₹1,040-1,050 (current levels with momentum confirmation)
• Secondary Entry: ₹980-1,000 (on any retracement to support)
• Breakout Entry: Above ₹1,070 with volume confirmation
Exit Strategy:
• Target 1: ₹1,120-1,150 (short-term target)
• Target 2: ₹1,200-1,250 (medium-term target)
• Target 3: ₹1,300+ (long-term target based on pattern projection)
Risk Management:
• Stop Loss: ₹950 (below recent support and breakout level)
• Position Size: Risk 1-2% of portfolio per trade
• Risk-Reward Ratio: Minimum 1:2 for all entries
Position Sizing Guidelines:
• Conservative investors: 2-3% of portfolio
• Moderate risk takers: 4-5% of portfolio
• Aggressive traders: 6-8% of portfolio (not recommended to exceed this)
Sectoral and Fundamental Backdrop:
Company Overview:
• Ahluwalia Contracts has a market cap of ₹6,936 crore with promoter holding at 55.32%
• The company reported revenue of ₹4,099 crore and profit of ₹202 crore
• Recent quarterly results show revenue of ₹1,215.84 crore and net profit of ₹83.33 crore for Q4 FY25
Sector Outlook:
• The infrastructure boom is set to lead India to become the third-largest construction market by 2025
• Government has bolstered capital expenditure by 11.1% to $133 billion for fiscal year 2024-25, equivalent to 3.4% of GDP
• The India Infrastructure Sector Market is expected to reach USD 190.70 billion in 2025 and grow at a CAGR of 8% to reach USD 280.60 billion by 2030
Government Support:
• Budget 2025-26 allocates INR 11.21 lakh crore for the infrastructure sector
• The FY2025–26 Budget outlines major allocations with INR 2.9 trillion for the Ministry of Road Transport and Highways, and INR 2.6 trillion for the Ministry of Railways
Growth Drivers:
• The flourishing housing market, coupled with the government's sustained and massive infrastructure push, has driven construction market growth
• Government-led initiatives aimed at advancing infrastructure are driving the Indian construction market growth during the forecast period
• The India Construction Market is projected to register a CAGR of greater than 6% during the forecast period (2025-2030)
Investment Rationale:
Bullish Factors:
• Strong technical breakout on cards from a well-defined pattern
• Robust government spending on infrastructure development
• The company's established market position in the construction sector
• Healthy financial metrics with consistent profitability
Risk Factors:
• Contingent liabilities of ₹1,963 crore present a concern
• Dividend payout has been low at 1.42% of profits over the last 3 years
• General market volatility could impact sector performance
• Execution risks in large infrastructure projects
My Take:
The stock presents a compelling technical setup with strong fundamental support from the government's infrastructure push. The rising wedge breakout, combined with increased volume and supportive sector dynamics, makes it an attractive investment opportunity for medium to long-term investors. However, strict adherence to stop-loss levels and position sizing guidelines is essential for risk management.
Keep in the Watchlist.
NO RECO. For Buy/Sell.
📌Thank you for exploring my idea! I hope you found it valuable.
🙏FOLLOW for more
👍BOOST if you found it useful.
✍️COMMENT below with your views.
Meanwhile, check out my other stock ideas on the right side until this trade is activated. I would love your feedback.
Disclaimer: "I am not a SEBI REGISTERED RESEARCH ANALYST AND INVESTMENT ADVISER."
This analysis is intended solely for informational and educational purposes and should not be interpreted as financial advice. It is advisable to consult a qualified financial advisor or conduct thorough research before making investment decisions.
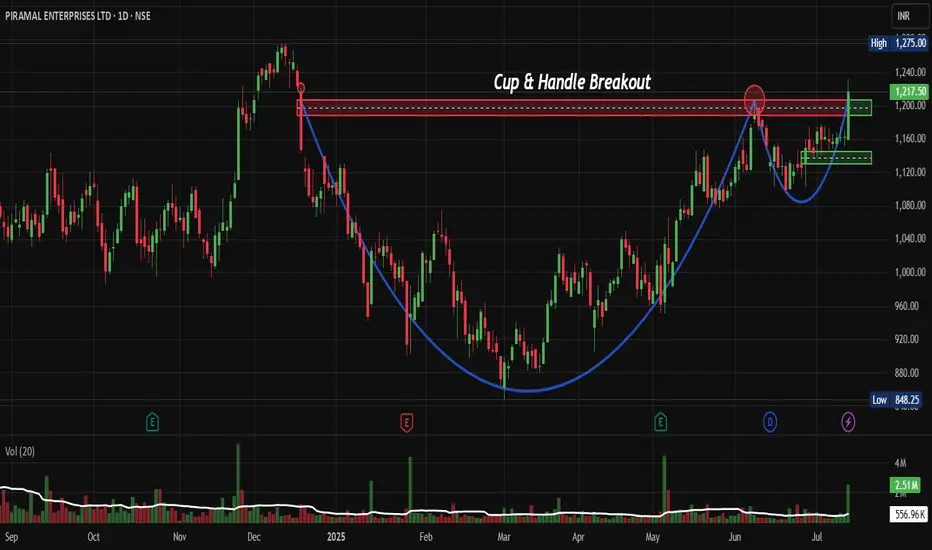
PEL: Perfect Cup & Handle Breakout That Could Double Your MoneyNSE:PEL : The Perfect Cup & Handle Breakout That Could Double Your Money? Let's Analyse
Price Action Analysis:
• Stock has formed a classic Cup & Handle pattern over approximately 8 months (Dec 2024 to July 2025)
• The "cup" formation shows a rounded bottom with the low around ₹850-900 levels in March 2025
• Current breakout above the handle resistance at ₹1,200 levels with strong momentum
• Price has surged from ₹1,158.70 to ₹1,217.50 with a healthy 4.69% gain on breakout day
• The handle formation shows controlled consolidation with lower volumes, indicating accumulation
Volume Spread Analysis:
• Volume spike of 2.51M shares on breakout day, significantly higher than the 20-day average
• During the cup formation, volume was relatively subdued, showing smart money accumulation
• The breakout volume of 556.96K is substantial, confirming the validity of the pattern
• Volume profile shows institutional participation during the base-building phase
Key Support and Resistance Levels:
• Primary Support: ₹1,150-1,160 (previous handle resistance now acting as support)
• Secondary Support: ₹1,100-1,120 (handle low)
• Major Support: ₹1,000-1,020 (cup rim level)
• Immediate Resistance: ₹1,240-1,250
• Major Resistance: ₹1,275 (all-time high)
• Target Resistance: ₹1,400-1,450 (measured move from cup depth)
Base Formation:
• 8-month base formation from Dec 2024 to July 2025
• Base depth: Approximately 35-40% from highs to lows
• Constructive base with multiple retests of support levels
• Base shows characteristics of institutional accumulation with controlled selling pressure
Technical Patterns:
Cup & Handle Pattern:
• Perfect textbook Cup & Handle formation with 8-month duration
• Cup depth of approximately ₹400 (from ₹1,240 to ₹850)
• Handle formed over 6-8 weeks with declining volume
• Breakout above ₹1,200 with expanding volume confirms pattern completion
• Measured target: ₹1,600+ (adding cup depth to breakout level)
Additional Patterns:
• Ascending triangle formation within the handle
• Multiple higher lows during the recovery phase
• Bullish flag pattern preceding the final breakout
• Volume price confirmation throughout the pattern development
Trade Setup:
Entry Strategy:
• Aggressive Entry: ₹1,210-1,220 (on breakout confirmation)
• Conservative Entry: ₹1,180-1,190 (on pullback to breakout level)
• Scale-in Entry: 50% at ₹1,210, 50% at ₹1,190 if pullback occurs
• Entry should be accompanied by volume expansion above 1.5x average
Exit Strategy:
• Target 1: ₹1,320-1,340 (8-10% upside)
• Target 2: ₹1,450-1,480 (20-25% upside)
• Target 3: ₹1,600-1,650 (pattern target, 35-40% upside)
• Partial profit booking at each target level (33% each)
Stop-Loss Management:
• Initial Stop-Loss: ₹1,150 (below handle support)
• Trailing Stop-Loss: Move to breakeven once Target 1 is achieved
• Progressive Stop-Loss: ₹1,250 after Target 1, ₹1,350 after Target 2
• Risk-Reward Ratio: 1:2.5 minimum for the trade setup
Risk Management:
Position Sizing:
• Maximum allocation: 3-5% of the portfolio for this single position
• Scale-in approach recommended for average entry price
• Avoid concentrating more than 10% in the financial services sector
• Consider correlation with other financial holdings
Risk Mitigation:
• Set alerts at key support and resistance levels
• Monitor volume patterns for any divergence signals
• Keep track of broader market sentiment and financial sector performance
• Regular review of stop-loss levels and profit booking strategy
• Avoid averaging down if the stop-loss is triggered
Sectoral Analysis:
Financial Services Sector Overview:
• NBFC sector showing signs of recovery post-COVID consolidation
• Regulatory environment becoming more favourable for established players
• Credit growth revival benefiting well-capitalized NBFCs
• Sector rotation from growth to value creates opportunities in the financial space
Sector Positioning:
• NSE:PEL is positioned in the diversified financial services space
• Benefits from real estate cycle recovery and pharma business stability
• Regulatory changes favouring larger, well-capitalized players
• Sector P/B multiples are still reasonable compared to historical averages
Fundamental Backdrop:
Company Overview:
• Diversified conglomerate with presence in financial services, pharmaceuticals, and real estate
• Strong balance sheet with improved asset quality metrics
• Management focuses on deleveraging and core business strengthening
• Strategic divestments are improving cash flows and reducing the debt burden
Past/Recent Developments:
• Successful completion of major asset sales improves the liquidity position
• Pharma business showing steady growth with new product launches
• Real estate segment benefiting from sector recovery
• Financial services arm gaining market share in target segments
Valuation Metrics:
• Trading at reasonable valuations compared to sector peers
• Improved return ratios and asset quality metrics
• Strong cash generation from core operations
• Debt reduction improving financial flexibility and credit ratings
Growth Catalysts:
• Real estate sector recovery driving housing finance growth
• Pharma business expansion in domestic and international markets
• Potential for higher ROE as leverage normalizes
• Market share gains in target financial services segments
My Take:
This technical setup in NSE:PEL presents a compelling risk-reward opportunity with the stock breaking out from a well-formed base pattern, supported by improving fundamentals and favourable sector dynamics.
Keep in the Watchlist.
NO RECO. For Buy/Sell.
📌Thank you for exploring my idea! I hope you found it valuable.
🙏FOLLOW for more
👍BOOST if you found it useful.
✍️COMMENT below with your views.
Meanwhile, check out my other stock ideas on the right side until this trade is activated. I would love your feedback.
Disclaimer: "I am not a SEBI REGISTERED RESEARCH ANALYST AND INVESTMENT ADVISER."
This analysis is intended solely for informational and educational purposes and should not be interpreted as financial advice. It is advisable to consult a qualified financial advisor or conduct thorough research before making investment decisions.
PLong
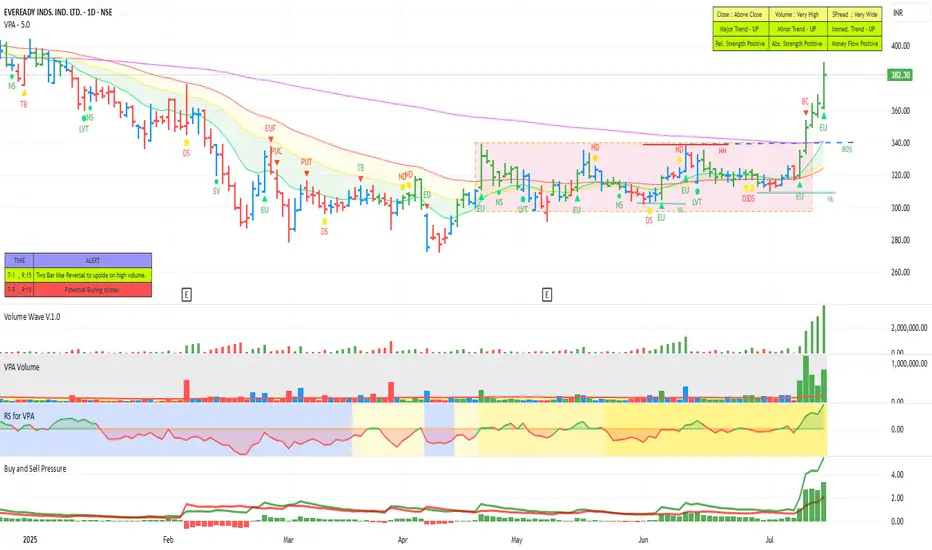
EVEREADY - POISED FOR A UPMOVEThe stock fell about 45% form it's last Peak. Then an attempt to move up and more than two months of consolidation . Now making Higher Highs and Higher lows and moving past the short term moving averages and the 200 DMA. We can see strong momentum and bullish volume and increasing Relative strength. Money Flow is positive. The stock looks poised for a good up move.
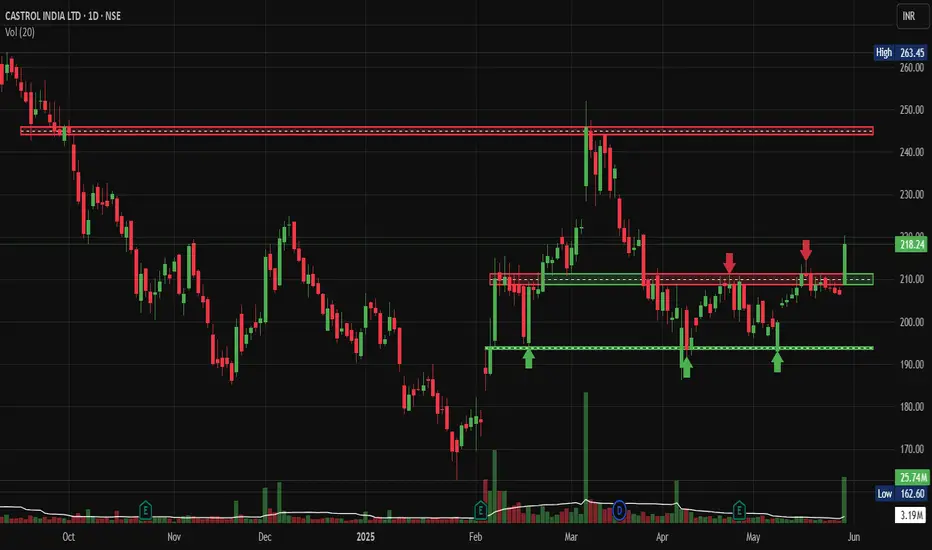
Castrol: Lubricant Oil Giant's Ends Consolidation PhaseNSE:CASTROLIND : Lubricant Oil Giant's Consolidation Phase Offers Strategic Entry Opportunity
Looking at NSE:CASTROLIND chart on the Daily Timeframe, the stock presents a compelling technical setup after months of consolidation following a significant decline from its October 2024 highs.
Price Action Analysis:
NSE:CASTROLIND has been trading in a well-defined range between ₹190-195 support and ₹210-215 resistance since February 2025. The stock peaked around ₹245-250 in October 2024 before experiencing a sharp correction that bottomed out near ₹162 in January. Since then, it has established a solid base above the ₹190 level with multiple successful retests.
The recent price action shows the stock consolidating around ₹208-210, with the current price at ₹208.70 representing a modest gain of 5.66%. This positioning near the upper end of the trading range suggests potential for a breakout attempt.
Volume Analysis:
Volume patterns reveal interesting insights - the chart shows several volume spikes that coincided with key support tests and bounce attempts. The volume of 25.74M against a 20-day average suggests active participation, though not at extreme levels. The volume profile indicates accumulation phases during dips below ₹200, which is constructive for future upward movement.
Key Support and Resistance Levels:
Key support levels are clearly defined at ₹190-195, , which have held multiple times since February. Secondary support exists around ₹180-185. On the upside, immediate resistance sits at ₹210-215 , followed by the more significant ₹230-235 zone . A break above ₹215 would target the previous consolidation high around ₹245.
Technical Pattern:
The stock is forming a classic rectangular consolidation pattern, also known as a trading range. This pattern typically resolves with a breakout in the direction of the prior trend, though given the extended decline from October highs, a base-building scenario appears more likely. The multiple retests of support without breaking down suggest a strong institutional interest at lower levels.
Trade Setup:
Entry Strategy: Consider accumulating on dips toward ₹195-200 or on a confirmed breakout above ₹215 with volume confirmation.
Entry Levels: ₹195-200 (value entry) or ₹216+ (momentum entry)
Target 1: ₹225-230
Target 2: ₹240-245
Target 3: ₹255-260
Stop Loss: Below ₹185 for medium-term positions
Risk-Reward: Approximately 1:2.5 from current levels
Sectoral and Fundamental Backdrop:
The lubricants sector has been facing headwinds from the transition to electric vehicles and longer oil change intervals in modern engines. However, Castrol benefits from its strong brand presence, extensive distribution network, and exposure to industrial lubricants. The company's parent, BP, provides technological advantages and global synergies.
Recent quarterly results have shown resilience despite volume pressures, with the company maintaining healthy margins through premiumization strategies. The automotive sector's recovery post-pandemic and increased industrial activity should support volume growth, though EV adoption remains a long-term concern.
India's infrastructure development and manufacturing push under various government initiatives provide tailwinds for industrial lubricant demand. Currency stability and crude oil price moderation also support margin profiles for lubricant companies.
The stock's valuation appears reasonable after the correction, trading below historical averages, which makes it attractive for patient investors willing to ride through the transition phase in the automotive industry.
Keep in the Watchlist.
NO RECO. For Buy/Sell.
📌Thank you for exploring my idea! I hope you found it valuable.
🙏FOLLOW for more
👍BOOST if you found it useful.
✍️COMMENT below with your views.
Meanwhile, check out my other stock ideas on the right side until this trade is activated. I would love your feedback.
Disclaimer: "I am not SEBI REGISTERED RESEARCH ANALYST AND INVESTMENT ADVISER."
This analysis is intended solely for informational and educational purposes and should not be interpreted as financial advice. It is advisable to consult a qualified financial advisor or conduct thorough research before making investment decisions.
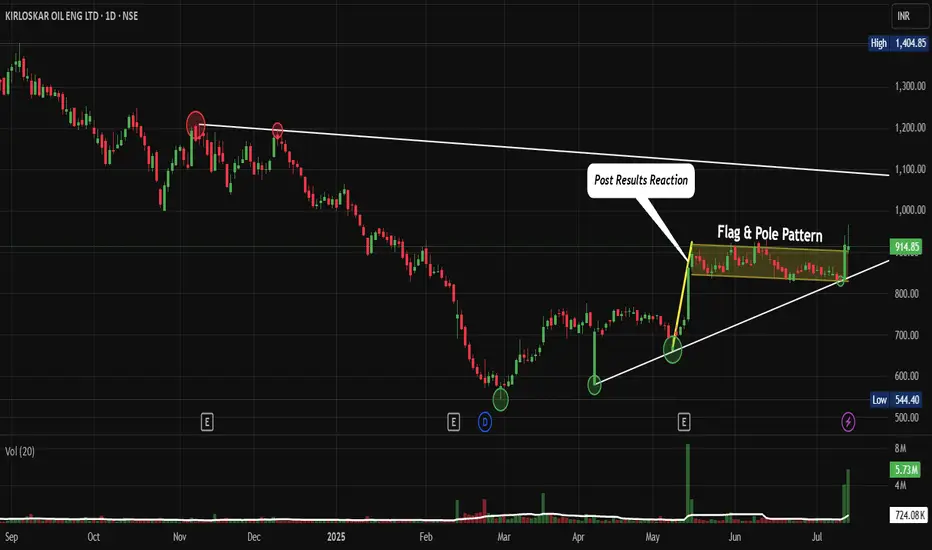
KIRLOSENG: Post-Results Breakout and Consolidation. F&P PatternNSE:KIRLOSENG : How This Hidden Gem Could Be Your Next Big Winner After Post-Results Breakout and Consolidation Let's Analyze in my "Chart of the Week"
Price Action:
- The stock shows a classic recovery pattern from March 2025 lows around ₹590-600
- Current price at ₹914.85 represents a significant 52% recovery from the March bottom
- The stock has been forming higher lows since March, indicating underlying strength
- Recent breakout above the ₹850 resistance level with strong volume confirmation
Volume Spread Analysis:
- Volume spike during the recent breakout suggests institutional participation
- The post-results reaction shows a healthy volume of 724.08K against a 20-day average of 5.73M
- Volume patterns indicate an accumulation phase during the consolidation period from April to June
Base Formation:
- Primary base established between ₹590-650 (March 2025 lows)
- Secondary base formed around the ₹750-800 level during April-May consolidation
- Current base being built around ₹880-920 after the recent breakout
Support and Resistance Levels:
Key Support Levels:
- Immediate support: ₹880-890 (recent breakout level)
- Strong support: ₹830-850 (previous resistance turned support)
- Major support: ₹780-800 (secondary base level)
- Ultimate support: ₹590-650 (primary base)
Resistance Levels:
- Immediate resistance: ₹950-970
- Major resistance: ₹1,000-1,020 (psychological level)
- Long-term resistance: ₹1,100-1,150 (previous highs from late 2024)
- Ultimate target: ₹1,400+ (all-time high region)
Technical Patterns:
Flag and Pole Pattern:
- The chart clearly shows a flag and pole formation
- The flag represents the consolidation phase from May to June 2025
- Recent breakout confirms the pattern completion with an upward trajectory
Ascending Triangle:
- The stock has formed an ascending triangle pattern with higher lows and consistent resistance around ₹850
- The breakout above this level validates the bullish continuation pattern
Post-Results Reaction:
- Kirloskar Oil Engines shares settled slightly, trading at Rs 803.75, representing a 9.36% increase, while the BSE Sensex was up by 0.25%.
- The positive reaction to results indicates market confidence in the company's performance
Trade Setup:
Entry Strategy:
- Primary entry: ₹900-920 (current levels on any dip)
- Secondary entry: ₹880-890 (on pullback to support)
- Aggressive entry: ₹930-950 (on breakout above current resistance)
Entry Levels:
- Conservative traders: Wait for pullback to ₹880-890 support
- Moderate traders: Enter at current levels around ₹910-920
- Aggressive traders: Enter on a breakout above ₹950
Exit Strategy:
Target Levels:
- Target 1: ₹1,000 (8-10% upside)
- Target 2: ₹1,100 (18-20% upside)
- Target 3: ₹1,250 (35-40% upside)
- Ultimate target: ₹1,400+ (50%+ upside)
Exit Timing:
- Book 30% profits at Target 1
- Book 40% profits at Target 2
- Hold the remaining 30% for the ultimate target with a trailing stop loss
Risk Management:
Stop-Loss Levels:
- Conservative stop-loss: ₹850 (6-7% downside)
- Moderate stop-loss: ₹830 (8-9% downside)
- Aggressive stop-loss: ₹800 (11-12% downside)
Position Sizing:
- Risk per trade: Maximum 2% of portfolio
- Position size calculation: Portfolio value × 2% ÷ (Entry price - Stop loss)
- For ₹1,00,000 portfolio with entry at ₹910 and stop at ₹850: Position size = ₹2,000 ÷ ₹60 = 33 shares
Sectoral Backdrop:
Industrial Machinery Sector:
- The industrial machinery sector has been showing resilience amid economic recovery
- Infrastructure push by the government supports demand for engines and pumps
- Agricultural mechanization trends favour companies like NSE:KIRLOSENG
Market Position:
- The company caters to the agriculture, ... Clients (Marine, Defence, etc), After Sales Support, Retail Channel – Tractor spares, Oil, Batteries.
- Diversified revenue streams provide stability across economic cycles
Fundamental Backdrop:
Financial Performance:
- Netprofit is up for the last 2 quarters, 68 Cr → 127 Cr (in ₹)
- Revenue is up for the last 2 quarters, 1454 Cr → 1753 Cr (in ₹)
- As of 31-Mar-2025, Kirloskar Oil Engines has a trailing 12-month revenue of 6349 Cr
Market Valuation:
- Its current market cap is 13,289 Cr with 14.5 Cr shares.
- Stock is trading at 4.30 times its book value
- Promoter holding has decreased over the last 3 years: -18.3%
Growth Outlook:
- The B2B business grew 5 per cent year on year, and the B2C business also witnessed a double-digit growth of 14 per cent year on year
- Strong positioning in agriculture and industrial segments provides sustainable growth prospects
- The final dividend of Rs 4 per equity Share indicates management confidence
My Take:
Investment Rationale:
- Technical breakout supported by improving fundamentals
- Diversified business model reduces concentration risk
- Strong balance sheet with consistent profitability
- Attractive valuation after the recent correction from highs
The combination of technical breakout, improving fundamentals, and supportive sectoral trends makes NSE:KIRLOSENG an attractive investment opportunity for medium to long-term investors with appropriate risk management measures in place.
Keep in the Watchlist.
NO RECO. For Buy/Sell.
📌Thank you for exploring my idea! I hope you found it valuable.
🙏FOLLOW for more
👍BOOST if you found it useful.
✍️COMMENT below with your views.
Meanwhile, check out my other stock ideas on the right side until this trade is activated. I would love your feedback.
Disclaimer: "I am not a SEBI REGISTERED RESEARCH ANALYST AND INVESTMENT ADVISER."
This analysis is intended solely for informational and educational purposes and should not be interpreted as financial advice. It is advisable to consult a qualified financial advisor or conduct thorough research before making investment decisions.
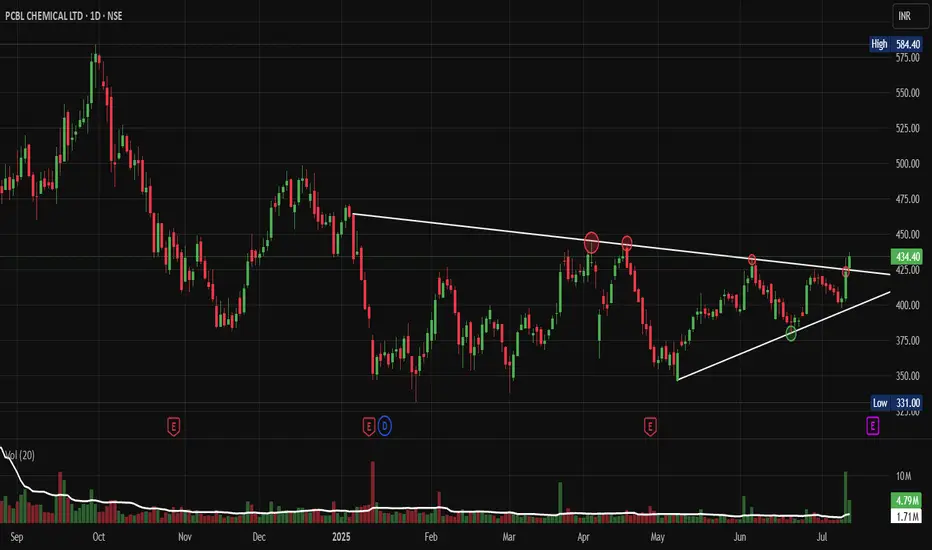
PCBL: The Sleeping Giant Ready to BreakOut of Its TriangleNSE:PCBL : The Sleeping Giant Ready to Break Out of Its Consolidation Triangle
Price Action Analysis:
• Stock has been trading in a well-defined ascending triangle pattern since early 2025
• Current price at ₹434.40 represents a +2.53% gain, showing bullish momentum
• The pattern shows a higher low formation with resistance around ₹450-460 levels
• Recent price action suggests an accumulation phase with controlled volatility
Volume Spread Analysis:
• Volume has been consistently above average during recent sessions (4.79M vs 1.71M average)
• Volume spike visible in recent trading sessions, indicating increased institutional interest
• The volume pattern supports the price consolidation with periodic accumulation phases
• Higher volume during up-moves compared to down-moves suggests buying interest
Key Technical Levels:
Support Levels:
• Primary Support: ₹420-425 (recent swing low)
• Secondary Support: ₹390-395 (ascending trendline support)
• Major Support: ₹360-370 (previous consolidation zone)
Resistance Levels:
• Immediate Resistance: ₹450-460 (triangle upper boundary)
• Key Resistance: ₹480-490 (previous highs)
• Major Resistance: ₹520-530 (psychological level)
Base Formation:
• The stock has formed a strong ascending triangle base over 6-7 months
• Base depth of approximately 15-20% from highs to lows
• Duration suggests a sustainable breakout when it occurs
• Base shows characteristics of institutional accumulation
Technical Patterns:
• Primary Pattern: Ascending Triangle (Bullish)
• Secondary Pattern: Flag formation on shorter timeframes
• Volume-Price Relationship: Positive divergence during recent consolidation
• Moving Average Setup: Price trading above all its key moving averages
Trade Setup:
Entry Strategy:
• Breakout Entry: ₹465-470 (above triangle resistance with volume confirmation)
• Pullback Entry: ₹440-445 (on any dip to support with volume)
• Accumulation Entry: ₹420-430 (for longer-term investors)
Exit Levels:
• Target 1: ₹520-530 (measured move from triangle base)
• Target 2: ₹580-590 (previous swing high zone)
• Target 3: ₹650-680 (extension target based on base depth)
Stop-Loss Levels:
• For Breakout Trades: ₹445-450 (below breakout level)
• For Accumulation Trades: ₹410-415 (below key support)
• Trailing Stop: Use an 8-10% trailing stop after the first target
Position Sizing:
• Conservative Approach: 2-3% of portfolio
• Moderate Approach: 3-5% of portfolio
• Aggressive Approach: 5-7% of portfolio (only for experienced traders)
Risk Management:
• Risk-Reward Ratio: Minimum 1:2 for all trades
• Maximum risk per trade: 2% of total capital
• Use the position sizing calculator based on stop-loss distance
• Avoid adding to losing positions
• Book partial profits at each target level
Sectoral Backdrop:
Chemical Sector Overview:
• Indian chemical sector showing strong fundamentals with export growth
• The speciality chemicals segment is experiencing robust demand
• The government's PLI scheme supports domestic chemical manufacturing
• Global supply chain diversification benefiting Indian chemical companies
Industry Trends:
• Increasing demand for agrochemicals and pharmaceutical intermediates
• Focus on sustainable and green chemistry practices
• Rising input costs are being managed through pricing power
• Strong export opportunities in speciality chemicals
Fundamental Backdrop:
Company Overview:
• NSE:PCBL is a leading player in speciality chemicals and carbon black
• Strong presence in the tire industry through carbon black manufacturing
• Diversified product portfolio, reducing concentration risk
• Established relationships with major tire manufacturers
Financial Highlights:
• Consistent revenue growth over the past few quarters
• Improving margin profile due to operational efficiency
• Strong balance sheet with manageable debt levels
• Increasing return on equity and asset efficiency
Growth Drivers:
• Expanding tire industry in India and globally
• New product launches in speciality chemicals
• Capacity expansion plans for key products
• Focus on high-margin speciality products
Risk Factors:
• Raw material price volatility
• Environmental regulations compliance costs
• Competition from global players
• Cyclical nature of the tire industry
My Take:
NSE:PCBL presents a compelling technical setup with its ascending triangle pattern nearing completion. The combination of strong volume accumulation, supportive sectoral trends, and improving fundamentals creates a favourable risk-reward scenario. Traders should wait for a decisive breakout above the ₹465 levels, accompanied by volume confirmation, for optimal entry. Meanwhile, investors can consider gradual accumulation at current levels, exercising proper risk management.
Keep in the Watchlist.
NO RECO. For Buy/Sell.
📌Thank you for exploring my idea! I hope you found it valuable.
🙏FOLLOW for more
👍BOOST if you found it useful.
✍️COMMENT below with your views.
Meanwhile, check out my other stock ideas on the right side until this trade is activated. I would love your feedback.
Disclaimer: "I am not a SEBI REGISTERED RESEARCH ANALYST AND INVESTMENT ADVISER."
This analysis is intended solely for informational and educational purposes and should not be interpreted as financial advice. It is advisable to consult a qualified financial advisor or conduct thorough research before making investment decisions.
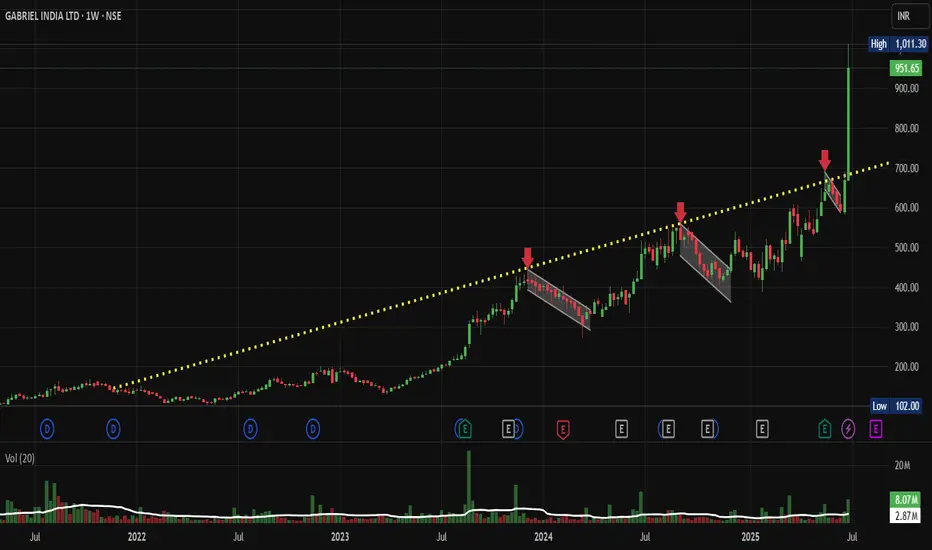
Gabriel India: Ascending Trendline Breakout, Chart of the WeekNSE:GABRIEL : A Technical Breakout Story That Could Double Your Investment? Let's Analyze it in my "Chart of the Week" Idea.
Price Action Analysis:
• The stock has shown a remarkable multi-year uptrend from around ₹100 levels in 2022 to current levels above ₹950
• A clear ascending channel pattern is visible with the yellow dotted trendline acting as dynamic support
• Recent price action shows a powerful breakout from a consolidation phase around ₹600-700 levels
• The stock is currently trading near all-time highs with strong momentum
• Volume expansion during the recent breakout confirms genuine buying interest
Volume Spread Analysis:
• Volume patterns show significant spikes during major price advances
• The recent breakout phase is accompanied by above-average volume, indicating institutional participation
• Volume tends to contract during consolidation phases, which is a healthy price action
• The volume profile suggests strong accumulation during the base-building phases
Key Technical Levels:
Base Formation:
• Primary base formed between ₹100-200 levels during 2022-early 2023
• Secondary base established around ₹400-500 levels in late 2023
• Most recent consolidation base around ₹600-700 levels before the current breakout
Support Levels:
• Immediate support: ₹850-900 (recent breakout zone)
• Strong support: ₹700-750 (previous resistance turned support)
• Major support: ₹600 (base of recent consolidation)
• Critical support: ₹500 (psychological level and previous consolidation zone)
Resistance Levels:
• Immediate resistance: ₹1000-1050 (psychological barrier)
• Next resistance: ₹1200 (measured move target)
• Extended target: ₹1400-1500 (based on channel projection)
Technical Pattern Recognition:
Primary Patterns:
• Long-term ascending channel with consistent higher highs and higher lows
• Multiple cups and handle formations during the uptrend
• Recent flag/pennant consolidation followed by breakout
• Classical stage 2 uptrend characteristics with expanding volume
Technical Indicators:
• Price trading above all major moving averages
• Strong momentum as evidenced by the steep price advance
• Healthy pullbacks followed by resumption of uptrend
• Volume-price confirmation during breakouts
Trade Setup:
Entry Levels:
• Aggressive entry: Current market price (₹950-970)
• Conservative entry: On pullback to ₹850-880 levels
• Breakout entry: Above ₹1000 with volume confirmation
• Accumulation entry: Any dip towards ₹800-820 levels
Exit Levels:
• First target: ₹1200 (26% upside from current levels)
• Second target: ₹1400 (47% upside)
• Extended target: ₹1600 (68% upside)
• Trailing stop strategy recommended for long-term positions
Stop-Loss Placement:
• For aggressive entries: ₹800 (16% risk)
• For conservative entries: ₹750 (12% risk from ₹850 entry)
• For breakout entries: ₹900 (10% risk from ₹1000 entry)
• Weekly closing basis stop-loss recommended
Risk Management Framework:
Position Sizing:
• Risk per trade: Maximum 2-3% of portfolio
• For ₹800 stop-loss from current price: Position size = (Portfolio × 2%) ÷ ₹150
• Recommended allocation: 5-8% of equity portfolio given the risk-reward profile
• Consider scaling into position over 2-3 tranches
Risk Parameters:
• Maximum drawdown tolerance: 20% from peak
• Time-based stop: Exit if consolidation exceeds 6 months
• Sector rotation risk: Monitor auto sector performance
• Market correlation: High beta stock, reduce position size in volatile markets
Sectoral Backdrop:
Auto Ancillary Sector Dynamics:
• Indian automotive sector showing strong recovery post-COVID
• Shift towards electric vehicles creating new opportunities for component manufacturers
• Export potential increasing with global supply chain diversification
• Government's PLI scheme supporting auto component manufacturing
Industry Trends:
• Increasing focus on high-quality, precision components
• Growing aftermarket business providing stable revenue streams
• Consolidation in the sector is favouring established players
• Technology upgrades driving margin expansion
Fundamental Backdrop:
Company Overview:
• NSE:GABRIEL is a leading manufacturer of automotive shock absorbers and suspension systems
• Strong presence in both OEM and aftermarket segments
• Diversified customer base across passenger vehicles, commercial vehicles, and two-wheelers
• Established relationships with major automotive manufacturers
Financial Highlights:
• Consistent revenue growth is driven by industry expansion
• Improving margins through operational efficiency and product mix optimization
• Strong balance sheet with manageable debt levels
• Increasing return on equity and return on capital employed
Growth Drivers:
• Expanding automotive production in India
• Growing replacement market for suspension components
• Export opportunities in emerging markets
• New product development and technology partnerships
Investment Thesis:
• Well-positioned to benefit from India's automotive growth story
• Strong competitive moat through technical expertise and customer relationships
• Potential for multiple expansions as the company scales operations
• Dividend yield providing downside protection for long-term investors
My Take:
The technical setup for NSE:GABRIEL presents a compelling risk-reward opportunity with the stock breaking out from a multi-month consolidation phase. The combination of strong sectoral tailwinds, robust fundamental backdrop, and bullish technical patterns creates a favourable investment environment. However, investors should maintain proper risk management given the stock's high beta nature and current extended valuation levels.
Keep in the Watchlist.
NO RECO. For Buy/Sell.
📌Thank you for exploring my idea! I hope you found it valuable.
🙏FOLLOW for more
👍BOOST if you found it useful.
✍️COMMENT below with your views.
Meanwhile, check out my other stock ideas on the right side until this trade is activated. I would love your feedback.
Disclaimer: "I am not a SEBI REGISTERED RESEARCH ANALYST AND INVESTMENT ADVISER."
This analysis is intended solely for informational and educational purposes and should not be interpreted as financial advice. It is advisable to consult a qualified financial advisor or conduct thorough research before making investment decisions.
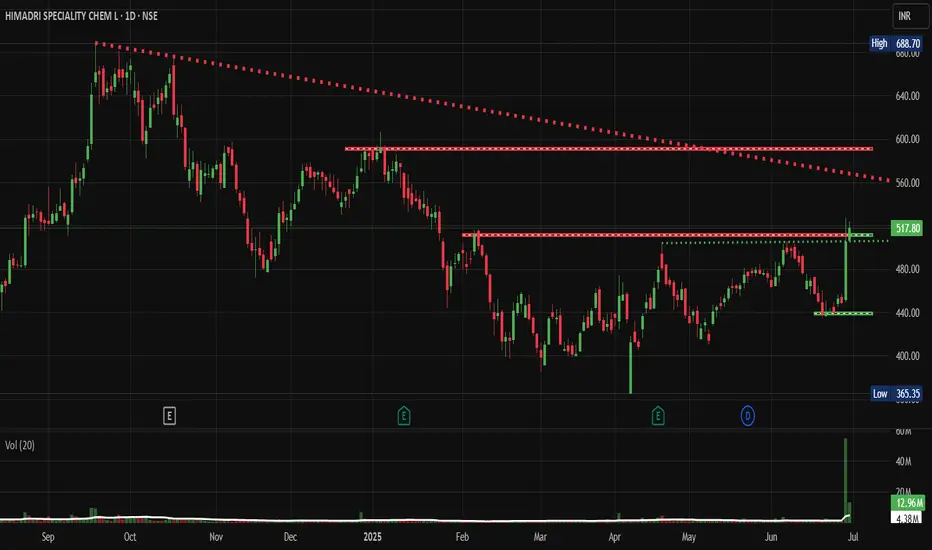
HSCL: A Classic Breakout Story in the MakingNSE:HSCL : A Classic Breakout Story in the Making
Price Action Analysis:
- Stock has formed a strong uptrend from September 2024 lows around 365 levels
- Current price of 517.80 represents a significant +41% move from the base
- Recent breakout above the 500 resistance level with strong volume confirmation
- Price action shows a classic accumulation pattern followed by a markup phase
Volume Spread Analysis:
- Significant volume spike visible in recent sessions (12.96M vs average 4.38M)
- Volume confirmation during breakout above 500 levels
- Accumulation pattern evident with higher volume on up days
- Volume trend supports the bullish price action
Base Formation & Key Levels:
- Primary Base: Formed between 400-520 levels from December 2024 to May 2025
- Secondary Base: 440-480 consolidation zone during March-April 2025
- Base Duration: Approximately 6 months of sideways consolidation
- Base Characteristics: Multiple retests of support levels with decreasing volatility
Key Support & Resistance Levels:
- Immediate Support: 480-500 zone (previous resistance turned support)
- Strong Support: 440-460 zone (multiple bounce levels)
- Major Support: 400 psychological level
- Immediate Resistance: 520-530 zone
- Next Resistance: 580-600 zone (measured move target)
- All-time High Resistance: 688.70
Technical Chart Patterns:
- Cup and Handle Pattern: Visible from October 2024 to June 2025
- Ascending Triangle: Formed during the consolidation phase
- Bullish Flag: Recent consolidation before the breakout
- Higher Highs and Higher Lows: Established uptrend structure
Trade Setup & Strategy:
Entry Strategy:
- Primary Entry: 515-520 on any pullback to the breakout zone
- Aggressive Entry: Current levels around 517-518
- Conservative Entry: Wait for retest of the 500 support level
- Scale-in Approach: 50% at 515, 30% at 505, 20% at 495
Exit Strategy:
- Target 1: 560-570 (Risk-Reward 1:2)
- Target 2: 600-620 (Risk-Reward 1:3)
- Target 3: 650-680 (Risk-Reward 1:4)
- Trailing Stop: Use 480 as a trailing stop once Target 1 is achieved
Risk Management:
- Stop Loss: 475-480 (below breakout support)
- Position Size: Maximum 2-3% of portfolio
- Risk per Trade: Not more than 1% of total capital
- Time Stop: Exit if no progress in 3-4 weeks
Position Sizing Guidelines:
- Conservative Investor: 1-1.5% portfolio allocation
- Moderate Risk: 2-2.5% portfolio allocation
- Aggressive Trader: 3-4% portfolio allocation (with tight stops)
- Swing Trading: 2% with wider stops at 460 levels
Fundamental & Sectoral Backdrop:
Company Overview:
- NSE:HSCL is a leading manufacturer of coal tar pitch and advanced carbon materials
- Key products include coal tar pitch, carbon black feedstock, and speciality carbons
- Strong presence in aluminium, graphite electrode, and speciality chemical sectors
Sectoral Dynamics:
- The speciality chemicals sector is showing strong growth momentum
- Increased demand from the aluminium and steel industries
- The government focus on Make in India and import substitution
- Rising demand for advanced materials in electric vehicles and renewable energy
Fundamental Catalysts:
- Capacity expansion plans and new product launches
- Strong demand from end-user industries
- Improved margin profile due to product mix optimization
- Debt reduction and improved financial metrics
- ESG initiatives and sustainable product development
Market Conditions:
- Overall market sentiment is positive for chemical stocks
- Sectoral rotation favours speciality chemicals
- Export opportunities in global markets
- Raw material cost stabilization supporting margins
Risk Factors:
Technical Risks:
- Failure to sustain above 500 levels could lead to a retest of the 440 support level
- High volatility is expected given the breakout nature
- Overbought conditions in the short term may cause profit booking
Fundamental Risks:
- Raw material price volatility (coal tar and petroleum products)
- Environmental regulations affecting production
- Competition from global players
- Economic slowdown affecting end-user demand
- Currency fluctuation impact on exports/imports
My Take:
My analysis suggests a positive technical setup with strong breakout potential, supported by favourable sectoral trends and improving fundamentals. However, proper risk management and position sizing remain crucial for successful execution.
Keep in the Watchlist.
NO RECO. For Buy/Sell.
📌Thank you for exploring my idea! I hope you found it valuable.
🙏FOLLOW for more
👍BOOST if you found it useful.
✍️COMMENT below with your views.
Meanwhile, check out my other stock ideas on the right side until this trade is activated. I would love your feedback.
Disclaimer: "I am not a SEBI REGISTERED RESEARCH ANALYST AND INVESTMENT ADVISER."
This analysis is intended solely for informational and educational purposes and should not be interpreted as financial advice. It is advisable to consult a qualified financial advisor or conduct thorough research before making investment decisions.
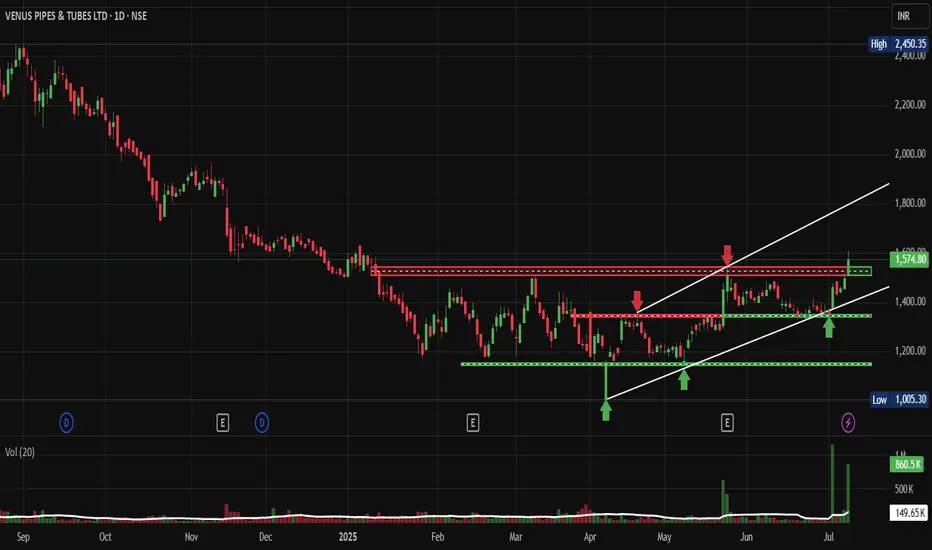
Venus Pipes: A Breakout Story in the MakingNSE:VENUSPIPES : A Breakout Story in the Making
Price Action Analysis:
• Price consolidated between 1,200-1,600 levels from January 2025 to June 2025
• Recent breakout above 1,600 resistance with strong volume confirmation
• Currently trading at 1,574.80 after hitting a high of 2,450.35
• Pullback to retest the breakout level suggests healthy consolidation
Volume Spread Analysis:
• Significant volume spike during the recent breakout phase
• Volume increased from an average of 149.65K to 860.5K, indicating institutional interest
• Higher volume during up moves compared to down moves shows buying pressure
• Volume pattern supports the breakout thesis with strong participation
Key Technical Levels:
Support Levels:
• Primary Support: 1,200 (previous base level)
• Secondary Support: 1,400 (mid-range support)
• Immediate Support: 1,500 (recent pullback low)
Resistance Levels:
• Immediate Resistance: 1,650 (recent high)
• Major Resistance: 2,450 (lifetime high)
• Psychological Resistance: 2,000 and 2,500
Base Formation:
• Strong base formed between 1,200-1,400 levels over 6 months
• Multiple retests of support levels showing accumulation
• Base provides a strong foundation for upward movement
Technical Patterns:
Primary Pattern:
• Bullish continuation pattern with horizontal resistance at 1,600 and rising support line
• Pattern duration: 8 months (Jan 2025 to July 2025)
• Breakout confirmed with volume expansion
Secondary Patterns:
• Higher low pattern indicating underlying strength
• Volume-price divergence resolved with a recent breakout
Trade Setup:
Entry Strategy:
• Conservative Entry: On pullback to 1,500-1,520 levels
• Aggressive Entry: Current levels around 1,570-1,580
• Breakout Entry: Above 1,650 with volume confirmation
Exit Strategy:
• Target 1: 1,800 (immediate target)
• Target 2: 2,100 (50% retracement of lifetime high)
• Target 3: 2,400-2,500 (lifetime high retest)
Stop-Loss Levels:
• For entries around 1,570: Stop at 1,450 (below base support)
• For entries around 1,500: Stop at 1,350 (below key support)
• Trailing stop: 8-10% below recent swing highs
Risk Management:
Position Sizing:
• Risk per trade: Maximum 2% of portfolio
• Position size calculation: Portfolio value × 2% ÷ (Entry price - Stop loss)
• Gradual position building is recommended, given the volatility
Risk Assessment:
• Risk-Reward Ratio: 1:2 to 1:3 for current setup
• Time horizon: 3-6 months for primary targets
• Market correlation: Monitor broader market sentiment
Sectoral Backdrop:
Steel Pipes and Tubes Industry:
• Infrastructure spending boost under government initiatives
• Demand from the oil and gas sector supports growth
• Housing sector recovery driving construction demand
• Water supply projects creating additional opportunities
Industry Trends:
• Consolidation phase in the sector, favouring established players
• Raw material cost pressures being managed through pricing power
• Export opportunities emerging in neighbouring markets
• Technology upgrades improving operational efficiency
Fundamental Backdrop:
Company Overview:
• Venus Pipes & Tubes is a leading manufacturer of steel pipes and tubes
• Established presence in water supply, structural, and industrial applications
• Strong distribution network across India
• Focus on quality and customer service
Recent Developments:
• Capacity expansion plans to meet growing demand
• Strategic partnerships with infrastructure companies
• Improved working capital management
• Strong order book visibility for coming quarters
Financial Health:
• Steady revenue growth trajectory
• Improving margin profile
• Healthy balance sheet with manageable debt levels
• Strong cash flow generation capabilities
My Take:
Short-term View (1-3 months):
• Consolidation expected around current levels
• Potential for retest of breakout levels
• Volume patterns to be monitored for direction
Medium-term View (3-6 months):
• Upside potential to 2,000-2,200 levels
• Sector rotation could benefit the stock
• Infrastructure spending cycle supporting fundamentals
Long-term View (6-12 months):
• Structural growth story intact
• Market leadership position strengthening
• Potential for significant value creation
Keep in the Watchlist.
NO RECO. For Buy/Sell.
📌Thank you for exploring my idea! I hope you found it valuable.
🙏FOLLOW for more
👍BOOST if you found it useful.
✍️COMMENT below with your views.
Meanwhile, check out my other stock ideas on the right side until this trade is activated. I would love your feedback.
Disclaimer: "I am not a SEBI REGISTERED RESEARCH ANALYST AND INVESTMENT ADVISER."
This analysis is intended solely for informational and educational purposes and should not be interpreted as financial advice. It is advisable to consult a qualified financial advisor or conduct thorough research before making investment decisions.
JP Power: Breaking Out After 6-Month ConsolidationNSE:JPPOWER : Breaking Out After 6-Month Consolidation
Price Action Analysis:
• Long-term Trend: Stock has been in a prolonged downtrend from highs of ₹23.77, finding support around ₹12.36
• Recent Pattern: Clear consolidation phase from December 2024 to May 2025 within a rectangular range
• Current Movement: Sharp breakout from consolidation with strong volume confirmation
• Momentum: Bullish momentum building with gap-up opening and sustained buying
Volume Analysis:
• Volume Pattern: Significant volume spike during current breakout session
• Volume Confirmation: Current volume of 195.09M vs average of 41.29M indicates strong institutional participation
• Historical Volume: Notable volume spikes during previous breakout attempts in October 2024
• Volume Quality: Expansion on up-moves and contraction during consolidation phases
Key Technical Levels:
Support Levels:
• Immediate Support: ₹16.35 (previous resistance turned support)
• Strong Support: ₹15.50-16.00 (consolidation base)
• Critical Support: ₹12.36 (52-week low and major support zone)
• Long-term Support: ₹12.00-12.50 (multiple bounce zone)
Resistance Levels:
• Immediate Resistance: ₹18.50-19.00 (previous swing high zone)
• Major Resistance: ₹20.00-20.50 (psychological level and previous rejection zone)
• Target Resistance: ₹22.00-23.00 (measured move target)
• Ultimate Resistance: ₹23.77 (52-week high)
Base Formation:
• Base Type: Rectangular consolidation base
• Base Duration: Approximately 6 months (December 2024 to May 2025)
• Base Range: ₹12.36 to ₹16.35
• Base Depth: Approximately 25% from highs
• Base Quality: Well-defined with multiple tests of support and resistance
Technical Patterns Identified:
Primary Pattern:
• Pattern: Rectangle/Box Consolidation with Breakout
• Formation Period: December 2024 to May 2025
• Breakout Confirmation: Volume-backed breakout above ₹16.35
• Pattern Reliability: High, given the extended consolidation period
Trade Setup:
Entry Strategy:
• Primary Entry: ₹17.50-17.80 (current levels with momentum)
• Pullback Entry: ₹16.50-17.00 (if stock retraces to test breakout level)
• Aggressive Entry: ₹18.00+ (breakout continuation trade)
• Conservative Entry: Wait for weekly close above ₹17.50 for confirmation
Exit Levels:
• Target 1: ₹19.50-20.00 (10-12% upside, resistance zone)
• Target 2: ₹22.00-22.50 (25-27% upside, measured move)
• Target 3: ₹24.00+ (35%+ upside, extension target)
• Trail Stop: Use a 15-20% trailing stop once the first target is achieved.
Stop Loss Strategy:
• Initial Stop Loss: ₹15.50 (below consolidation base)
• Risk: 12-15% from current levels
• Tight Stop: ₹16.00 (for aggressive traders)
• Weekly Close Stop: Below ₹15.80 on weekly closing basis
Position Sizing & Risk Management:
Position Sizing Guidelines:
• Conservative Approach: 2-3% of portfolio (given sector risks)
• Moderate Approach: 3-5% of portfolio
• Aggressive Approach: 5-7% of portfolio (only for risk-tolerant investors)
• Maximum Allocation: Not more than 10% due to sector concentration risk
Risk Management Framework:
• Risk per Trade: Limit to 1-2% of total capital
• Reward-to-Risk Ratio: Minimum 1:2, targeting 1:3
• Portfolio Heat: Consider correlation with other power/infrastructure stocks
• Sector Exposure: Monitor total exposure to the power sector
Sectoral Backdrop:
Power Sector Overview:
• Sector Trend: Power sector showing signs of revival with government's focus on renewable energy
• Policy Support: Government initiatives for power infrastructure development
• Demand Scenario: Growing power demand with industrial recovery
• Investment Climate: Increased capex allocation for power infrastructure
Industry Dynamics:
• Renewable Push: Shift towards renewable energy, creating opportunities
• Transmission Focus: Grid strengthening and transmission line expansion
• Financial Health: Gradual improvement in power sector financials
• Regulatory Environment: Supportive policies for power sector growth
Fundamental Backdrop:
Company Profile:
• Business: Power generation, transmission, and infrastructure development
• Promoter Group: Jaiprakash Associates Group
• Market Cap: Mid-cap power sector player
• Operational Status: Multiple power projects across different states
Key Fundamental Factors:
• Debt Levels: High debt burden remains a key concern
• Asset Quality: Mix of operational and under-construction assets
• Revenue Visibility: Power purchase agreements providing revenue stability
• Execution Risk: Project completion and commissioning risks
• Financial Stress: Historical financial challenges and restructuring efforts
Recent Developments:
• Debt Resolution: Ongoing efforts for debt restructuring and resolution
• Project Status: Updates on project commissioning and operations
• Regulatory Approvals: Progress on pending regulatory clearances
• Strategic Initiatives: Focus on operational efficiency and cost optimization
Risk Factors:
Technical Risks:
• False Breakout: Risk of failure at higher resistance levels
• Volume Sustainability: Need for sustained volume support
• Market Sentiment: Dependency on overall market conditions
• Sector Rotation: Risk of sector-specific selling pressure
Fundamental Risks:
• High Leverage: Elevated debt levels impacting financial flexibility
• Execution Risk: Project execution and commissioning challenges
• Regulatory Risk: Changes in power sector policies
• Liquidity Risk: Working capital and cash flow management issues
My Take:
My Technical Outlook:
• Short-term: Bullish momentum with breakout confirmation
• Medium-term: Potential for 25-30% upside if breakout sustains
• Long-term: Dependent on fundamental improvements and sector revival
My Investment Recommendation:
• Recommendation: Cautious Buy for technical traders
• Time Horizon: 3-6 months for technical targets
• Suitability: Risk-tolerant investors with sector understanding
• Monitoring: Close watch on volume patterns and sector developments
This analysis is based on technical patterns and should be combined with thorough fundamental research and professional advice before making investment decisions.
Keep in the Watchlist.
NO RECO. For Buy/Sell.
📌Thank you for exploring my idea! I hope you found it valuable.
🙏FOLLOW for more
👍BOOST if you found it useful.
✍️COMMENT below with your views.
Meanwhile, check out my other stock ideas on the right side until this trade is activated. I would love your feedback.
Disclaimer: "I am not a SEBI REGISTERED RESEARCH ANALYST AND INVESTMENT ADVISER."
This analysis is intended solely for informational and educational purposes and should not be interpreted as financial advice. It is advisable to consult a qualified financial advisor or conduct thorough research before making investment decisions.

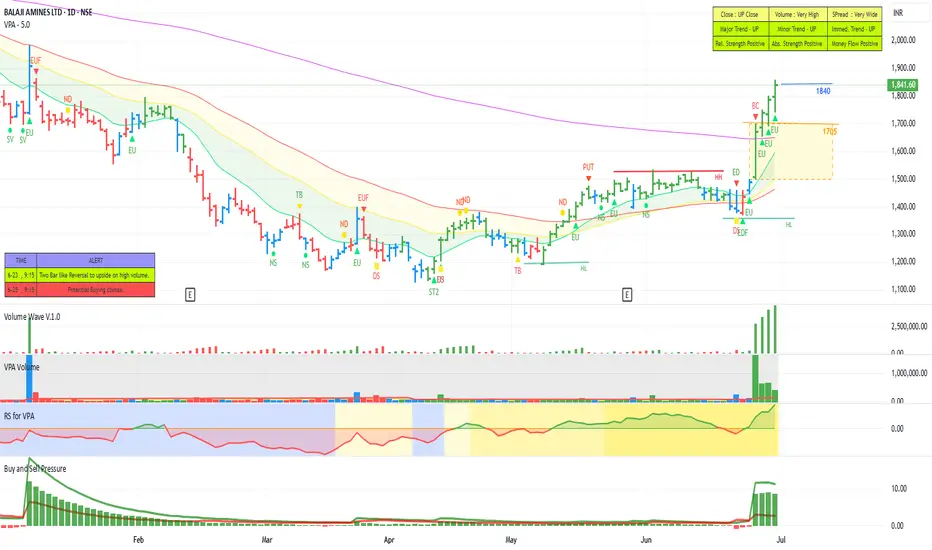
BALAJI AMINES - STEPPING INTO STAGE 2 ?The leading amine manufacturing company stocks had seen a huge down move of 50 to 60 percent. Of late many of these stocks have seen smart recovering. Leading stocks like alkyl amine, Vinati organics etc. crossed above the short-term moving averages. 200 DMA and moving up. Another stock in the group Balaji Amines has also started moving up now. After making a bottom it is now started making higher highs and Higher Lows. It also crossed above the short-term moving averages. The last few sessions we saw a huge momentum coming in with a huge Buy Wave pushing the stock above the 200 DMA. We can see that the relative strength and the absolute strength are also positive with the money also flowing into the stock. Now it is safely out above the 200 DMA with all other parameters looking positive. There is also good committed buying seen looking at the delivery volumes. The current momentum is likely to push up the stock further along in line with the other main amine manufacturing stocks.
RattanIndia: Next New-Age Multi-Bagger Play ? Chart of the WeekWhy NSE:RTNINDIA Could Be Your Next Multi-Bagger Play, let's analyse my "Chart of the Week" Idea.
Price Action:
• Multiple base formations visible across the timeline from 2021-2025
• Classic cup and handle pattern formation during the 2023-2024 consolidation phase
• Rectangle consolidation pattern between ₹35-40 levels during Early 2025
• Strong breakout from multi-year resistance around the ₹75-80 zone
• Current pullback to retest breakout levels around the ₹47-50 range
Key Supports and Resistance Levels:
• Primary Support: ₹47-50 (previous resistance turned support)
• Secondary Support: ₹35-40 (rectangle pattern base)
• Major Support: ₹25-30 (long-term base level)
• Immediate Resistance: ₹65-70 (previous consolidation zone)
• Major Resistance: ₹75-80 (breakout level)
• Target Resistance: ₹94-95 (measured move projection)
Base Analysis:
• Stage 1 Base: ₹10-25 range from 2021-2022 (Accumulation phase)
• Stage 2 Base: ₹35-45 range during 2023-2024 (Re-accumulation)
• Current Base: ₹47-50 retest zone (Healthy pullback after breakout)
Volume Spread Analysis:
Volume Characteristics:
• Massive volume spike during recent breakout (300+ million shares)
• Above-average volume during consolidation phases
• Volume expansion on upward price movements
• Volume contraction during pullback phases indicates a healthy correction
• Volume profile shows strong institutional participation
Volume Patterns:
• Accumulation is visible during base formation periods
• Distribution avoided during recent highs
• Current pullback on lower volume suggests buying interest at support
Trade Setup:
Entry Strategy:
• Primary Entry: ₹48-50 (current support retest)
• Secondary Entry: ₹52-55 (breakout reconfirmation)
• Aggressive Entry: ₹45-47 (deeper pullback opportunity)
Exit Levels:
• Target 1: ₹65-70 (38% upside from ₹50)
• Target 2: ₹80-85 (65% upside from ₹50)
• Target 3: ₹95-100 (90% upside from ₹50)
Stop Loss Levels:
• Conservative: ₹42-43 (below rectangle support)
• Moderate: ₹45-46 (below recent lows)
• Tight: ₹47-48 (below immediate support)
Risk Management:
Position Sizing:
• Risk 1-2% of portfolio capital per trade
• Use a 2-3% position size for a conservative approach
• Maximum 5% allocation for aggressive traders
Risk-Reward Ratios:
• Entry at ₹50 with ₹45 stop: Risk-Reward of 1:3 to 1:9
• Entry at ₹52 with ₹47 stop: Risk-Reward of 1:2.6 to 1:8.6
Portfolio Allocation:
• Small-cap allocation: 10-15% maximum
• Individual stock limit: 2-5% of total portfolio
• Sector diversification recommended
Sectoral and Fundamental Backdrop:
Business Overview:
• NSE:RTNINDIA comprises of tech-focused new age businesses, including e-commerce, electric vehicles, and drones
• The company is completely focused on providing world-class electric mobility products that are affordable and accessible to every Indian
• Multi-business model spanning fintech, e-commerce, and drone technology
Sector Dynamics:
• The electric vehicle sector is experiencing government policy support
• The e-commerce segment is benefiting from the Digital India initiatives
• Drone technology is gaining traction in commercial applications
• Tech-focused businesses aligned with India's digital transformation
Financial Highlights:
• Market cap of RattanIndia Enterprises Ltd stood at Rs. 8,263 Cr
• RattanIndia Enterprises Ltd's net Sales rose by 22% since the same period last year to ₹ 6,866 Cr in the FY2025
• The company is in a growth investment phase with expanding business verticals.
Investment Thesis:
• Diversified exposure to high-growth sectors
• Potential beneficiary of India's transition to electric mobility
• Strong technical setup after multi-year base formation
• Early-stage company with significant scaling potential ahead
Risk Factors:
Technical Risks:
• Small-cap volatility and liquidity concerns
• Dependence on broader market sentiment
• Potential for gap-down moves in adverse conditions
Fundamental Risks:
• Current losses and cash burn in the growth phase
• Execution risk across multiple business verticals
• Competition in the electric vehicle and e-commerce segments
• Regulatory changes affecting drone and fintech operations
My Take:
This technical setup presents a compelling opportunity with the stock breaking out of a well-defined pattern, supported by decent enough fundamentals in the Growth Sectors of New Age Company and favourable sector dynamics. The risk-reward profile appears attractive for traders and investors willing to manage position size appropriately.
Keep in the Watchlist.
NO RECO. For Buy/Sell.
📌Thank you for exploring my idea! I hope you found it valuable.
🙏FOLLOW for more
👍BOOST if you found it useful.
✍️COMMENT below with your views.
Meanwhile, check out my other stock ideas on the right side until this trade is activated. I would love your feedback.
Disclaimer: "I am not a SEBI REGISTERED RESEARCH ANALYST AND INVESTMENT ADVISER."
This analysis is intended solely for informational and educational purposes and should not be interpreted as financial advice. It is advisable to consult a qualified financial advisor or conduct thorough research before making investment decisions.
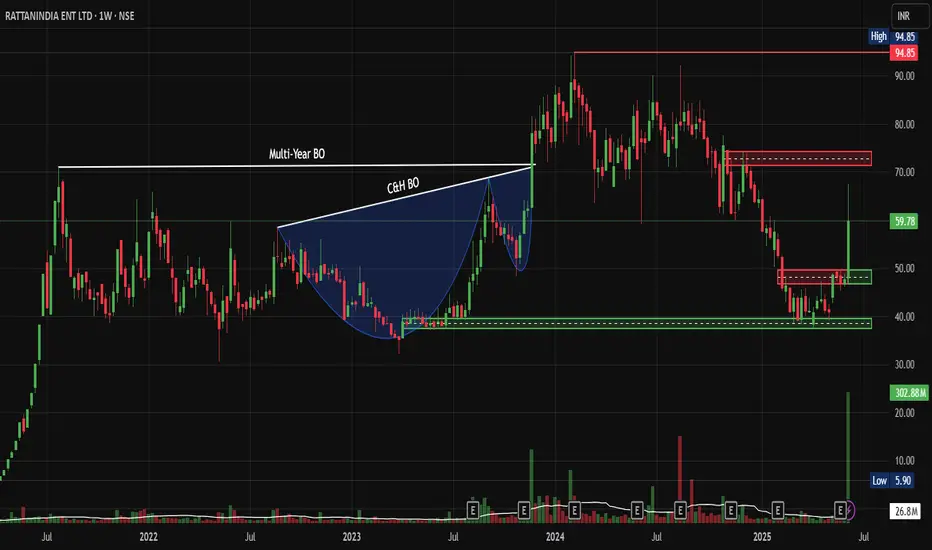
Supreme Power Equipment: Technically Strong, Chart of the MonthNSE:SUPREMEPWR Technically Strong Momentum is my pick in this month's "Chart of the Month"
Price Action Analsis:
- Stock currently trading at ₹227.50, up 21.35 (+10.36%), showing strong bullish momentum
- Recent breakout from a prolonged Correction phase that lasted from July 2024 to May 2025
- Price has successfully cleared multiple resistance levels and is now approaching previous highs
- Strong recovery from the March 2025 lows around ₹95-100 levels
Volume Spread Analysis:
- Current volume at 324.68K shares, significantly higher than the 20-day average
- Volume spike during the recent breakout confirms institutional participation
- Volume pattern shows accumulation during the consolidation phase
- Strong volume support during the current upward move validates the breakout
Key Technical Levels:
Support Levels:
- Immediate support: ₹210-215 (recent breakout level)
- Secondary support: ₹190-195 (previous resistance turned support)
- Major support: ₹160-170 (consolidation zone)
- Critical support: ₹120-130 (long-term moving average zone)
Resistance Levels:
- Immediate resistance: ₹240-250 (previous high zone)
- Major resistance: ₹280-290 (historical resistance)
- Ultimate target: ₹350-370 (measured move from base)
Base Formation:
- Clear accumulation base formed between ₹120-250 from July 2024 to May 2025
- Base depth of approximately 130 points provides a strong foundation
- Base duration of 10+ months indicates strong institutional accumulation
- Recent breakout from this base suggests potential for significant upward move
Technical Patterns:
- The cup and Handle pattern formation is visible on the monthly timeframe
- The ascending triangle breakout pattern recently completed
- Moving average convergence suggesting trend reversal
- RSI is likely showing bullish divergence from the March lows
Trade Setup:
Entry Strategy:
- Primary entry: ₹225-230 on any pullback to the breakout level
- Aggressive entry: Current market price ₹227.50 for momentum traders
- Conservative entry: Wait for retest of ₹210-215 support zone
- Scale-in approach: 50% at current levels, 50% on any dip to ₹215
Exit Levels:
- Target 1: ₹280 (24% upside) - Previous resistance zone
- Target 2: ₹320 (41% upside) - Measured move target
- Target 3: ₹370 (63% upside) - Ultimate breakout target
- Trailing stop: Use a 10% trailing stop once Target 1 is achieved
Stop-Loss:
- Initial stop-loss: ₹195 (14% downside risk)
- Breakeven stop: Move to ₹230 once price reaches ₹260
- Trailing stop: 8-10% below recent swing high
Position Sizing:
- Conservative investors: 2-3% of portfolio
- Moderate risk tolerance: 3-5% of portfolio
- Aggressive traders: 5-7% of portfolio (with tight stops)
- Maximum exposure: Not more than 7% given single stock concentration risk
Risk Management:
- Risk-reward ratio: 1:2 minimum for all positions
- Never risk more than 2% of the total portfolio on this single trade
- Use position sizing calculators to determine the exact share quantity
- Consider partial profit booking at each target level
- Monitor sector rotation and overall market conditions
Sectoral Backdrop:
Power Equipment Sector Overview:
- India's power sector is undergoing a massive transformation with a renewable energy push
- The government's target of 500 GW of renewable capacity by 2030 is driving equipment demand
- Infrastructure spending and rural electrification programs supporting sector growth
- PLI scheme for manufacturing provides additional tailwinds
Sector Challenges:
- Raw material cost inflation is impacting margins
- Supply chain disruptions affecting delivery timelines
- Intense competition from Chinese manufacturers
- Regulatory changes and policy uncertainties
Sector Opportunities:
- Make in India initiative favours domestic manufacturers
- Rising power demand from industrial and commercial sectors
- Smart grid implementation creating new revenue streams
- Export opportunities in emerging markets
Fundamental Backdrop:
Company Strengths:
- Established player in power transmission and distribution equipment
- Strong order book providing revenue visibility
- Diversified product portfolio, reducing concentration risk
- Experienced management team with industry expertise
Financial Health:
- Need to verify recent quarterly results for revenue and profit trends
- Debt levels and interest coverage ratios require monitoring
- Cash flow generation capability is important for sustained growth
- Return on equity and asset turnover metrics need evaluation
Growth Catalysts:
- Government infrastructure spending on the power sector
- Rural electrification and grid modernization projects
- Renewable energy integration requires specialized equipment
- Potential for export market expansion
Risk Factors:
- Dependence on government orders and policy changes
- Working capital-intensive business model
- Competition from larger players and imports
- Raw material price volatility affecting margins
My Take:
NSE:SUPREMEPWR exhibits a strong technical setup, characterised by a clear breakout from a well-formed base. The combination of volume confirmation, sector tailwinds, and government policy support creates a favourable risk-reward scenario. However, traders should maintain disciplined risk management and avoid overexposure to this single position.
Honourable Mentions:
Other stocks that have a good Setup
NSE:KIRLOSBROS , NSE:CGCL , NSE:SUNDRMFAST
Keep in the Watchlist.
NO RECO. For Buy/Sell.
📌Thank you for exploring my idea! I hope you found it valuable.
🙏FOLLOW for more
👍BOOST if you found it useful.
✍️COMMENT below with your views.
Meanwhile, check out my other stock ideas on the right side until this trade is activated. I would love your feedback.
Disclaimer: "I am not a SEBI REGISTERED RESEARCH ANALYST AND INVESTMENT ADVISER."
This analysis is intended solely for informational and educational purposes and should not be interpreted as financial advice. It is advisable to consult a qualified financial advisor or conduct thorough research before making investment decisions.
Shivalik Bimetal Controls Breaks Out Flag & Pole Pattern NSE:SBCL Breaks Out: Flag Pattern Signals Bullish Momentum in Speciality Metals Space
Price Action Analysis:
- Current Price: ₹526.40 (as of June 26, 2025)
- Daily Gain: +29.05 (+5.84%)
- 52-Week High: ₹639.75
- 52-Week Low: ₹342.00
- Trading Volume: 306.84K (compared to 20-day average of 81.39K)
Volume Spread Analysis:
- Breakout Volume: 306.84K (nearly 4x the 20-day average)
- Volume Confirmation: Strong volume surge supports genuine breakout
- Volume Pattern: Declining volume during flag formation, followed by expansion on breakout
Base Formation:
- Consolidation Base: Formed between April-May 2025 around ₹400-450 levels
- Duration: Approximately 6-8 weeks of sideways movement
- Characteristics: Healthy consolidation after initial rally from ₹375 lows
Chart Pattern Analysis:
- Primary Pattern: Bull Flag & Pole Breakout
- Flag Formation: Formed between May and June 2025 in the ₹475-500 range
- Pole Height: Approximately ₹125 (from ₹375 to ₹500)
- Breakout Confirmation: Stock broke above ₹500 resistance with strong volume
- Target Projection: ₹625-650 based on flag pole measurement
Key Technical Levels:
Support Levels:
- Immediate Support: ₹500 (previous resistance turned support)
- Secondary Support: ₹475 (flag pattern lower boundary)
- Major Support: ₹400 (psychological level and previous consolidation zone)
Resistance Levels:
- Immediate Resistance: ₹550-560 (short-term target)
- Major Resistance: ₹625-650 (flag pattern target)
- All-Time High: ₹639.75 (to be watched closely)
Trade Setup Analysis:
Long Position Setup:
- Entry Strategy: Breakout above ₹500 with volume confirmation
- Risk-Reward Ratio: 1:3 (favourable setup)
- Time Horizon: 3-6 months for target achievement
- Pattern Reliability: High (bull flag patterns have 70%+ success rate)
Entry Levels:
- Aggressive Entry: ₹526-530 (current market price)
- Conservative Entry: ₹510-515 (on pullback to breakout level)
- Accumulation Zone: ₹500-520 (for larger positions)
Exit Levels:
- Target 1: ₹580-590 (intermediate target - 15% upside)
- Target 2: ₹625-640 (pattern target - 22-25% upside)
- Final Target: ₹650-670 (extended target based on momentum)
Stop-Loss Strategy:
- Initial Stop-Loss: ₹475 (below flag pattern support)
- Trailing Stop: Implement an 8-10% trailing stop after 15% gains
- Conservative Stop: ₹490 (closer stop for risk-averse traders)
Position Sizing Recommendations:
- Conservative Allocation: 2-3% of portfolio
- Moderate Allocation: 4-5% of portfolio
- Aggressive Allocation: 6-8% of portfolio (for high-risk tolerance)
Risk Management Framework:
Risk Assessment:
- Pattern Risk: 25-30% (typical bull flag failure rate)
- Market Risk: Consider broader market conditions
- Sector Risk: Speciality metals and electronics component sector exposure
- Liquidity Risk: Moderate (average daily volume of 81.39K)
Risk Mitigation Strategies:
- Diversification across multiple positions
- Gradual position building rather than lump sum entry
- Regular monitoring of volume and price action
- Adherence to predetermined stop-loss levels
- Profit booking at intermediate targets
Money Management Rules:
- Maximum loss per trade: 2-3% of portfolio
- Position sizing based on stop-loss distance
- Avoid averaging down on losing positions
- Scale out profits at predetermined levels
Fundamental Backdrop:
Company Overview:
- Business Focus: Manufacturing and sales of Thermostatic Bimetal/Trimetal strips, Current Sense Metal Strip Shunts/Resistors, and electron beam welded products
- Operating Since: Commercial production since October 1986
- Headquarters: New Delhi, India
Financial Performance:
- Market Capitalization: ₹3,027 crores
- Annual Revenue: ₹508.35 crores (TTM)
- Pre-tax Margin: 20% (considered great)
- Return on Equity: 20.6% (exceptional performance)
- Debt-to-Equity: 0.08 (healthy balance sheet)
Recent Quarterly Results:
- Q4 FY2025 Revenue: ₹132 crores
- Q4 FY2025 Net Profit: ₹21 crores
- Q3 FY2025 Net Profit Growth: 7.55% YoY to ₹18 crores
Promoter Holding Concerns:
- Current Promoter Holding: 33.18% (considered low)
- 3-Year Trend: Decreased by 27.4% over the last 3 years
Sectoral Analysis:
Industry Positioning:
- Sector: Speciality Metals and Electronic Components
- Niche Market: Thermostatic bimetal strips for temperature control applications
- End Markets: Electronics, automotive, appliances, and industrial equipment
- Market Position: Established player with specialized manufacturing capabilities
Sector Outlook:
- Growing demand for temperature control solutions in electronics
- Increasing automation in the automotive and industrial sectors
- Focus on energy efficiency, driving demand for precision components
- Import substitution opportunities in specialised metal products
Competitive Advantages:
- Financial Stability: Appears financially stable compared to competitors
- Specialized manufacturing expertise in electron beam welding
- Established customer relationships since 1986
- Low debt levels provide financial flexibility
Technical Indicators Summary:
Momentum Indicators:
- RSI: In overbought territory post-breakout (monitor for divergence)
- MACD: Bullish crossover expected on breakout
- Volume: Strong confirmation of breakout validity
Trend Indicators:
- Moving Averages: Stock trading above key moving averages
- Trend Direction: Bullish short to medium term
- Support Levels: Well-defined support structure
Risk Indicators:
- Volatility: Moderate to high given recent breakout
- Liquidity: Adequate for position sizes recommended
- Market Correlation: Monitor broader market trends
My Take:
The technical setup for NSE:SBCL presents a compelling bull flag breakout opportunity with strong volume confirmation. The pattern projects targets of ₹625-650, representing potential upside of 22-25% from current levels. However, the declining promoter holding and moderate liquidity require careful position sizing and risk management.
Recommended approach is to enter on any pullback to ₹510-515 levels with a stop-loss at ₹475, targeting ₹580-590 for the first leg of the move. The company's strong financial metrics and niche market positioning support the technical breakout, making this an attractive medium-term opportunity for technically oriented investors.
Keep in the Watchlist.
NO RECO. For Buy/Sell.
📌Thank you for exploring my idea! I hope you found it valuable.
🙏FOLLOW for more
👍BOOST if you found it useful.
✍️COMMENT below with your views.
Meanwhile, check out my other stock ideas on the right side until this trade is activated. I would love your feedback.
Disclaimer: "I am not a SEBI REGISTERED RESEARCH ANALYST AND INVESTMENT ADVISER."
This analysis is intended solely for informational and educational purposes and should not be interpreted as financial advice. It is advisable to consult a qualified financial advisor or conduct thorough research before making investment decisions.
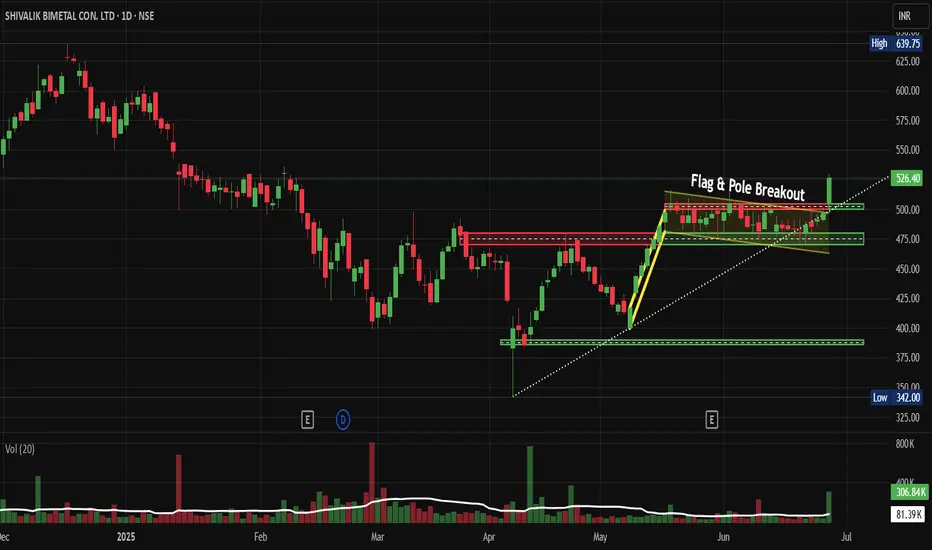
Titan: Cup & Handle Pattern Signals Major Uptrend ContinuationNSE:TITAN Cup & Handle Pattern Signals Major Uptrend Continuation after Macquarie sees Q1 growth on jewellery demand
Price Action Analysis:
• Stock has formed a classic Cup & Handle pattern over an 8-month period from February 2025 to June 2025
• Cup formation shows a rounded bottom with depth of approximately 800 points (3,700 to 2,900 levels)
• Handle formation displays controlled consolidation with lower volatility, indicating institutional accumulation
• Price action demonstrates strong momentum with a 3.58% daily gain and healthy volume expansion
Volume Spread Analysis:
• Volume pattern confirms the Cup & Handle formation with classic volume characteristics
• During cup formation, volume contracted during the decline and expanded during recovery
• Handle formation shows diminishing volume, indicating reduced selling pressure
• Recent breakout accompanied by significant volume spike (2.7M vs average), confirming institutional participation
• Volume-price correlation remains positive, supporting the bullish breakout thesis
Key Technical Levels:
Support Levels:
• Primary Support: 3,500
• Secondary Support: 3,400
• Major Support: 3,200
Resistance Levels:
• Immediate Resistance: 3,700 (Previous highs and psychological level)
• Major Resistance: 3,867 (52 Week high marked on chart)
• Extended Target: 4,200 (Cup & Handle measured move target)
Technical Patterns Identified:
• Cup & Handle Pattern: Primary bullish continuation pattern spanning 5 months
• Ascending Triangle: Within the handle formation, showing higher lows
• Volume Accumulation Pattern: Consistent with institutional buying during consolidation phases
Trade Setup:
Entry Strategy:
• Primary Entry: 3,650-3,680 (Current levels on any minor pullback)
• Secondary Entry: 3,580-3,620
• Aggressive Entry: Market price for momentum traders
Exit Levels:
• Target 1: 3,800 (Near-term resistance, book 30% profits)
• Target 2: 3,950 (Previous highs breach, book 40% profits)
• Target 3: 4,200 (Cup & Handle measured move, remaining 30%)
Risk Management:
• Stop Loss: 3,480 (Below handle low with 5% buffer)
• Risk-Reward Ratio: 1:3 (Risk of 170 points vs reward of 500+ points to first major target)
• Maximum Risk per Trade: 2% of portfolio capital
Position Sizing:
• Conservative Approach: 1-1.5% of portfolio given the strong setup
• Moderate Approach: 2-2.5% for traders comfortable with mid-cap volatility
• Scale-in Strategy: 50% on initial entry, 30% on any dip to secondary entry, 20% on momentum confirmation
Sectoral and Fundamental Backdrop:
Sector Analysis:
• Consumer Discretionary sector showing resilience amid economic recovery
• Jewellery and watches segment benefiting from the wedding season demand and festival purchases
• Luxury consumption trends supporting the premium positioning of Titan's brands
• Rural demand recovery provides an additional growth catalyst for the company
Fundamental Highlights:
• Strong brand portfolio including Tanishq, Titan, Fastrack, and Sonata
• Consistent market share gains in the organised jewellery retail segment
• Digital transformation initiatives are improving operational efficiency
• Expansion in tier-2 and tier-3 cities driving geographical diversification
Macroeconomic Factors:
• Favourable gold price trends supporting jewellery business margins
• Rising disposable income in Indian households is boosting luxury spending
• The government's focus on organized retail supporting compliant players like Titan
• Wedding season and festival demand provide seasonal tailwinds
Key Risks to Monitor:
• Gold price volatility is impacting raw material costs and consumer demand
• Competition from online jewellery platforms and regional players
• Economic slowdown potentially affecting discretionary spending
• Regulatory changes in gold import duties or GST rates
My Take:
This technical setup presents a compelling risk-reward opportunity with the Cup & Handle pattern completion, strong volume confirmation, and favourable sectoral backdrop supporting the bullish thesis for Titan Company.
Keep in the Watchlist.
NO RECO. For Buy/Sell.
📌Thank you for exploring my idea! I hope you found it valuable.
🙏FOLLOW for more
👍BOOST if you found it useful.
✍️COMMENT below with your views.
Meanwhile, check out my other stock ideas on the right side until this trade is activated. I would love your feedback.
Disclaimer: "I am not a SEBI REGISTERED RESEARCH ANALYST AND INVESTMENT ADVISER."
This analysis is intended solely for informational and educational purposes and should not be interpreted as financial advice. It is advisable to consult a qualified financial advisor or conduct thorough research before making investment decisions.
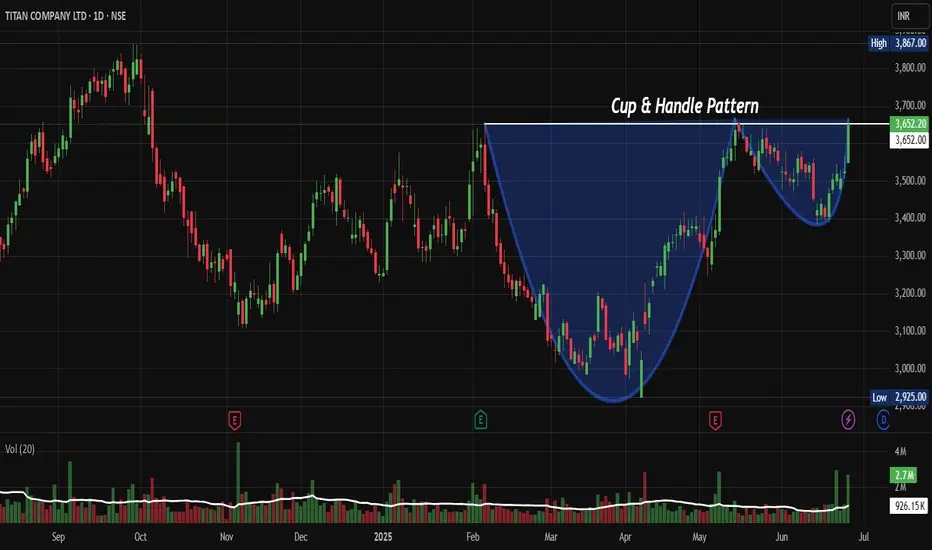
Indian Metals & Ferro Alloy: Flag & Pole BONSE:IMFA Breaks out of the Flag & Pole Pattern with Huge Volumes today.
Price Action Analysis:
- Stock experienced a significant decline from highs around 998.80 to lows near 549.80, representing approximately a 45% correction
- Recent breakout above 720 levels shows strong momentum reversal
- Current price at 772.50 (+ 7.77%) indicates bullish sentiment returning
- Higher highs and higher lows pattern emerging on the right side of the chart
Volume Spread Analysis:
- Volume spike coinciding with recent breakout confirms genuine buying interest
- Volume of 202.22K appears elevated compared to previous months
- Green volume bars during the recent rally suggest an accumulation phase
- Low volume during the consolidation phase indicates smart money positioning
Key Technical Levels:
Support Levels
- Primary Support: 720-730 (recent breakout zone)
- Secondary Support: 680-690 (previous resistance turned support)
- Major Support: 600-620 (previous consolidation zone)
Resistance Levels:
- Immediate Resistance: 800-820
- Major Resistance: 880-900
- Long-term Resistance: 950-998 (previous highs)
Base Formation:
- Cup and Handle pattern visible with base formation between 550-680 levels
- Duration of base: Approximately 4-5 months (February to June 2025)
- Handle formation in the May-June period before the breakout
- Flag & Pole Pattern Broke today
Technical Patterns Identified:
Primary Pattern: Cup and Handle
- Well-defined cup formation with rounded bottom
- Handle shows controlled pullback with lower volume
- Breakout above handle resistance confirms pattern completion
- Target projection: 950+ levels based on pattern height
Secondary Patterns:
- Descending trendline resistance tested today
- Double bottom formation around 550-580 levels
- Bullish flag formation post-breakout
Trade Setup Recommendations:
Entry Strategy:
- Aggressive Entry: Current levels 770-775 on any minor dip
- Conservative Entry: 720-730 on pullback to breakout zone
- Momentum Entry: Above 800 for trend continuation
Exit Strategy:
- Target 1: 850 (10% upside from current levels)
- Target 2: 920 (19% upside potential)
- Target 3: 980 (27% upside to retest previous highs)
Stop-Loss Levels:
- For aggressive entries: 720 (7% risk)
- For conservative entries: 680 (6% risk from 720 entry)
- Trailing stop: 8-10% below recent swing lows
Risk Management Framework:
Position Sizing:
- Risk per trade: Maximum 2% of portfolio
- Position size calculation: Portfolio value × 2% ÷ stop-loss distance
- For ₹1 lakh portfolio with 7% stop: ₹2,000 ÷ 0.07 = ₹28,571 position size
Risk Controls:
- Maximum exposure to single stock: 5% of portfolio
- Sector concentration limit: 15% in the metals sector
- Use of position sizing calculator mandatory
- Weekly portfolio review and rebalancing
Sectoral Backdrop Analysis:
Metals Sector Dynamics:
- Global steel demand recovery supporting Indian metal stocks
- Infrastructure spending by the government boosts domestic demand
- Raw material cost stabilization improves margins
- Export opportunities are increasing with global supply chain shifts
Industry Tailwinds:
- The government's focus on infrastructure development
- PLI schemes supporting the manufacturing sector
- Green energy transition requiring metal inputs
- Automotive sector recovery driving steel demand
Fundamental Considerations:
Company Specific Factors:
- Debt reduction initiatives improving balance sheet strength
- Capacity expansion plans supporting long-term growth
- Technology upgrades enhancing operational efficiency
- ESG compliance improving institutional investor interest
Macroeconomic Factors:
- Rupee stability supporting import-dependent operations
- Interest rate environment favourable for the capital-intensive sector
- Government policy support for domestic manufacturing
- Global commodity cycle showing signs of recovery
Trading Psychology Notes:
Behavioural Considerations:
- Stock showing classic accumulation after major decline
- Institutional buying is likely during the base formation period
- Retail sentiment improving with breakout confirmation
- FOMO factor may drive further momentum
Market Sentiment Indicators:
- Relative strength improving against the broader market
- Sector rotation favours cyclical stocks
- Technical breakout attracting momentum traders
- Long-term investors find value after the correction
My take:
This technical setup presents a compelling risk-reward opportunity with clearly defined entry, exit, and risk management parameters. The combination of a strong technical breakout and improving sectoral fundamentals creates a favourable environment for potential gains.
Keep in the Watchlist.
NO RECO. For Buy/Sell.
📌Thank you for exploring my idea! I hope you found it valuable.
🙏FOLLOW for more
👍BOOST if you found it useful.
✍️COMMENT below with your views.
Meanwhile, check out my other stock ideas on the right side until this trade is activated. I would love your feedback.
Disclaimer: "I am not a SEBI REGISTERED RESEARCH ANALYST AND INVESTMENT ADVISER."
This analysis is intended solely for informational and educational purposes and should not be interpreted as financial advice. It is advisable to consult a qualified financial advisor or conduct thorough research before making investment decisions.

Midhani: Breaks Out of Consolidation: Ready for Lift-Off ?NSE:MIDHANI Breaks Out of Consolidation: A Technical Powerhouse Ready for Lift-Off ?
Price Action Analysis:
- Current Price: ₹463.60 (as of June 23, 2025)
- Price Movement: +20.30 points (+4.58%) on the day
- The stock has demonstrated a spectacular breakout from a lengthy consolidation phase
- Sharp vertical surge from ₹340 levels to current highs of ₹463.60
- Strong momentum evident with substantial volume expansion
Volume Spread Analysis:
- Current Volume: 6.03M shares (significantly elevated)
- Average Volume: 2.36M shares
- Volume surge of approximately 155% above average indicates strong institutional participation
- Volume spike during breakout confirms genuine buying interest
- The previous consolidation period showed declining volume, typical of accumulation phases
Key Technical Levels:
Base Formation:
- Primary Base: ₹220-₹340 range (March 2025 to May 2025)
- Base Duration: Approximately 3 months
- Base Type: Cup and Handle pattern with rectangular consolidation
- Base Depth: From ₹463 high to ₹220 low (52.5% correction)
- Quality: High-quality base with proper volume characteristics
Support Levels:
- Immediate Support: ₹420-₹440 (previous resistance turned support)
- Secondary Support: ₹380-₹400 (50% retracement of recent move)
- Major Support: ₹340-₹360 (breakout point and upper base boundary)
- Ultimate Support: ₹280-₹300 (middle of base formation)
Resistance Levels:
- Immediate Resistance: ₹480-₹500 (psychological round numbers)
- Next Resistance: ₹520-₹540 (measured move from base)
- Major Resistance: ₹580-₹600 (long-term projection target)
Technical Patterns Identified:
Primary Pattern:
- Cup and Handle Formation: Completed with successful breakout
- Handle Formation: Tight consolidation between ₹320-₹340 levels
- Breakout Volume: Exceptional with 155% above average volume
Secondary Patterns:
- Ascending Triangle: Formed during the handle phase
- Flag Pattern: Brief consolidation after initial breakout surge
- Higher Lows: Consistent pattern throughout base formation
Trend Analysis:
- Primary Trend: Strongly Bullish (breakout confirmed)
- Intermediate Trend: Bullish momentum accelerating
- Short-term Trend: Overbought but maintaining strength
Trade Setup and Strategy:
Entry Levels:
- Aggressive Entry: ₹445-₹460 (current levels on minor pullbacks)
- Conservative Entry: ₹420-₹440 (on deeper retracement to support)
- Breakout Entry: ₹350-₹360 (for those who missed the initial move)
Exit Levels:
- Target 1: ₹500 (near-term psychological resistance)
- Target 2: ₹540 (measured move from base)
- Target 3: ₹600 (extended target based on base width)
Stop-Loss Strategy:
- Tight Stop: ₹420 (for aggressive entries)
- Standard Stop: ₹380 (below key support zone)
- Conservative Stop: ₹340 (below breakout point)
Position Sizing and Risk Management:
Position Sizing Guidelines:
- Conservative Allocation: 2-3% of portfolio
- Moderate Allocation: 3-5% of portfolio
- Aggressive Allocation: 5-7% of portfolio (for high-risk tolerance)
Risk Management Framework:
- Maximum Risk per Trade: 2% of total capital
- Risk-Reward Ratio: Minimum 1:3 for all entries
- Scaling Strategy: Add positions on pullbacks to support levels
- Profit Booking: Book 30% at Target 1, 40% at Target 2, 30% at Target 3
Portfolio Considerations:
- Sector Allocation: Limit defence/aerospace exposure to 10-15% of portfolio
- Correlation Risk: Monitor other defence stocks for overexposure
- Market Timing: Consider broader market conditions before position sizing
Sectoral and Fundamental Backdrop:
Defence and Aerospace Sector Overview:
- India's defence budget targeting ₹1.75 lakh crore turnover by 2025
- The government focus on Atmanirbharta (self-reliance) in defence manufacturing
- The global aerospace and defence market is showing a strong growth trajectory
- Space economy growing at 7.4% year-over-year globally
Company Fundamentals:
- Market Cap: ₹8,693 crore
- Revenue: ₹1,074 crore (FY2025)
- Net Profit: ₹110 crore with 21.28% growth in Q4 FY2025
- Promoter Holding: 74% (strong management confidence)
- Specialisation: High-grade alloys, aerospace materials, defence components
Recent Developments:
- Strong presence at Aero India 2025 with indigenous aerospace materials
- Launch of High-Temperature Nickel Alloy Billets and Superni 41 Plates
- Strategic partnerships with HAL, GTRE, ADA, and the Indian Air Force
- Focus on critical materials for defence and aerospace applications
Industry Catalysts:
- Increasing defence procurement by the Indian government
- Export opportunities in aerospace components
- Technological advancement in the space and defence sectors
- The government push for indigenous manufacturing capabilities
Risk Factors and Considerations:
Technical Risks:
- Overbought conditions in the near term may lead to consolidation
- High volatility expected due to recent breakout
- Potential for profit booking at psychological resistance levels
Fundamental Risks:
- Dependence on government orders and policy changes
- Competition from private sector players
- Raw material cost fluctuations
- Execution risks in scaling up production
Market Risks:
- Broader market correction could impact momentum
- Sector rotation away from defence stocks
- Geopolitical factors affecting defence spending
- Interest rate environment impacting valuations
My Take:
NSE:MIDHANI presents a compelling technical setup with a successful breakout from a well-formed base pattern. The combination of strong volume confirmation, favourable sector dynamics, and improving fundamentals creates an attractive investment opportunity. However, investors should be mindful of the recent sharp move and consider appropriate position sizing and risk management strategies.
The stock appears well-positioned to benefit from India's growing defence and aerospace sector, supported by government initiatives and increasing focus on indigenous manufacturing capabilities. Technical indicators suggest further upside potential, making it suitable for both momentum and growth-oriented investment strategies.
Keep in the Watchlist.
NO RECO. For Buy/Sell.
📌Thank you for exploring my idea! I hope you found it valuable.
🙏FOLLOW for more
👍BOOST if you found it useful.
✍️COMMENT below with your views.
Meanwhile, check out my other stock ideas on the right side until this trade is activated. I would love your feedback.
Disclaimer: "I am not a SEBI REGISTERED RESEARCH ANALYST AND INVESTMENT ADVISER."
This analysis is intended solely for informational and educational purposes and should not be interpreted as financial advice. It is advisable to consult a qualified financial advisor or conduct thorough research before making investment decisions.

BEML: Breaks Multi-Month Resistance: Perfect Cup & Handle SetupNSE:BEML Breaks Multi-Month Resistance: Perfect Cup and Handle Setup Signals Major Upside Potential
Price Action Analysis:
Current Price Movement:
-Current Price: ₹4,291.50 (as of June 20, 2025)
-Daily Change: +₹351.70 (+8.20%) - Strong bullish momentum
-High: ₹4,728.40 | Low: ₹4,261.00
-Opening: ₹4,291.50 | Volume: 1.57M shares
Key Price Action Points:
Phase 1: Initial Decline (Sep 2024 - Dec 2024)
-Price Range: 4,400 to 3,600 levels
-Characteristics: Controlled selling with no panic dumping
-Volume: Moderate selling pressure
-Significance: Formation of the cup's left rim
Phase 2: Deep Correction (Dec 2024 - Feb 2025)
-Price Range: 3,600 to 2,350 (Cup Bottom)
-Characteristics: Capitulation phase with heavy selling
-Volume: High volume during the decline indicates washout
-Key Level: 2,350 marked the absolute low and cup base
Phase 3: Recovery Rally (Feb 2025 - Apr 2025)
-Price Range: 2,350 to 3,400 levels
-Characteristics: Strong bounce from cup bottom with increasing volume
-Price Action: Higher lows formation indicating accumulation
-Recovery Strength: 45% bounce from lows
Phase 4: Handle Formation (Apr 2025 - May 2025)
-Price Range: 3,400 to 3,000 levels (shallow pullback)
-Characteristics: Light volume decline, healthy consolidation
-Duration: Approximately 4-6 weeks of sideways action
-Volume Pattern: Drying up volume during pullback - classic handle behaviour
Phase 5: Breakout Phase (May 2025 - Current)
-Breakout Level: Above 3,400-3,500 resistance
-Price Acceleration: From 3,000 to the current 4,639 levels
-Volume Confirmation: Massive volume surge during breakout
-Momentum: 43% rally from handle lows in just 6-8 weeks
Candlestick Patterns and Price Behaviour
-Recent Action: Large green candles with minimal upper shadows indicating strong buying pressure
-Volume-Price Relationship: Price advancing on expanding volume - healthy trend
-Pullback Quality: Any pullbacks have been shallow with quick recoveries
-Support Holding: Price consistently holding above key moving averages
Price Structure Analysis:
-Higher Highs: Consistent pattern of higher peaks since February 2025
-Higher Lows: Each pullback finds support at higher levels
-Trend Strength: Steep angle of ascent indicates strong institutional buying
-Momentum Characteristics: Price moving in strong trending phases rather than choppy action
Critical Price Levels Based on Price Action:
-Breakout Confirmation: 3,500 level successfully held as support after breakout
-Momentum Continuation: 4,000 psychological level cleared with ease
-Current Resistance Test: Approaching the 4,800 level with strong momentum
-Volume at Key Levels: Each significant level break is accompanied by volume expansion
Chart Patterns:
-Cup and Handle Formation: The chart displays a classic cup and handle pattern spanning from late 2024 to mid-2025, with the cup formation completing around June 2025 at approximately 4,639 levels
-Breakout Confirmation: Stock has successfully broken above the handle resistance levels with strong volume confirmation
-Time Frame: The pattern has developed over approximately 9 months, indicating strong institutional accumulation
Support and Resistance Levels:
Major Support Levels:
-Immediate Support: 4,000-4,100 (psychological and technical level)
-Primary Support: 3,800-3,900 (previous resistance turned support)
-Secondary Support: 3,400-3,500 (breakout level)
-Long-term Support: 2,800-3,000 (cup base formation)
Resistance Levels:
-Immediate Resistance: 4,800-4,900 (current test level)
-Major Resistance: 5,200-5,400 (projected target based on cup depth)
-Extended Target: 5,800-6,000 (long-term projection)
Volume Spread Analysis:
-Breakout Volume: Significant volume spike observed during the recent breakout from handle formation
-Volume Confirmation: Above-average volume during the entire cup formation phase indicates institutional interest
-Current Volume: 1.57M shares showing continued institutional participation
-Volume Trend: Consistent volume buildup supporting price advancement
Base Formation Analysis:
Primary Base Characteristics:
-Base Type: Cup and Handle pattern with 7-month consolidation
-Base Depth: Approximately 47% correction from highs of 4,400 to lows of 2,350
-Base Duration: Extended consolidation period allowing for proper shake-out of weak hands
-Base Quality: Clean consolidation with clear support and resistance levels
Trade Setup Analysis:
Entry Strategy:
-Primary Entry: 4,100-4,200 (on pullback to support zone)
-Aggressive Entry: Current market price around 4,300 with tight stop-loss
-Conservative Entry: Wait for retest of 3,800-4,000 support levels
Exit Levels:
Target 1: 5,200 (21% upside from current levels)
Target 2: 5,600 (30% upside potential)
Target 3: 6,000 (40% upside - long-term target)
Stop-Loss Management:
Initial Stop-Loss: 3,800 (below key support)
Trailing Stop: Move to 4,000 once Target 1 is achieved
Risk-Reward Ratio: 1:2.5 (favourable risk-reward setup)
Position Sizing Recommendations:
-Conservative Approach: 2-3% of portfolio allocation
-Moderate Risk: 3-5% allocation for growth-oriented portfolios
-Risk Management: Maximum 5% position size due to single stock concentration risk
Risk Management Framework:
Key Risk Factors:
Market Risk: Overall market volatility can impact individual stock performance
Sector Risk: Defence and infrastructure sector cyclicality
Execution Risk: Pattern failure if stock breaks below 3,800 support
Risk Mitigation Strategies:
Diversification: Avoid over-concentration in a single position
Stop-Loss Discipline: Strict adherence to predetermined exit levels
Position Monitoring: Regular review of technical and fundamental developments
Sectoral and Fundamental Backdrop:
Business Verticals:
-BEML operates across Defence, Rail, Power, Mining and Infrastructure sectors, serving India's core industries BemlindiaBemlindia
-The company manufactures heavy earthmoving equipment for mining and construction, defence vehicles, and coaches for metro and Indian Railways, Bharat Earth Movers Limited
Financial Performance:
-Market Cap: ₹19,324 Crore with revenue of ₹4,022 Cr and profit of ₹293 Cr
-Promoter holding stands at 54.0%, indicating strong government backing.
-The board has recommended a final dividend of ₹1.20 per share for FY25, reflecting confidence in financial performance.
Growth Drivers:
-Company targeting ₹30bn annual opportunity in the mining sector with state-of-the-art equipment.
-Defence projects, including DATRAN prototypes, are expected to be completed by mid-2025
-The company has grown from ₹5 Cr turnover in 1965 to over ₹4,300 Cr currently.
Sector Outlook:
-Defence Modernization: Beneficiary of India's defence modernization and Make in India initiatives
-Infrastructure Push: The Government's focus on infrastructure development supports mining and construction equipment demand
-Railway Expansion: Metro and railway coach manufacturing aligned with India's transportation infrastructure growth
Investment Thesis:
-PSU Re-rating: Part of the broader PSU re-rating theme in Indian markets
-Diversified Revenue: Multi-sector exposure provides revenue stability
-Government Support: Strong backing from the Ministry of Defence ensures policy support
-Technical Breakout: Pattern completion suggests an institutional accumulation phase
My Take:
The combination of strong price action momentum with improving fundamental backdrop makes BEML an attractive investment opportunity for medium to long-term investors, with the cup and handle breakout providing clear entry and exit parameters for risk management.
Keep in the Watchlist.
NO RECO. For Buy/Sell.
📌Thank you for exploring my idea! I hope you found it valuable.
🙏FOLLOW for more
👍BOOST if you found it useful.
✍️COMMENT below with your views.
Meanwhile, check out my other stock ideas on the right side until this trade is activated. I would love your feedback.
Disclaimer: "I am not a SEBI REGISTERED RESEARCH ANALYST AND INVESTMENT ADVISER."
This analysis is intended solely for informational and educational purposes and should not be interpreted as financial advice. It is advisable to consult a qualified financial advisor or conduct thorough research before making investment decisions.
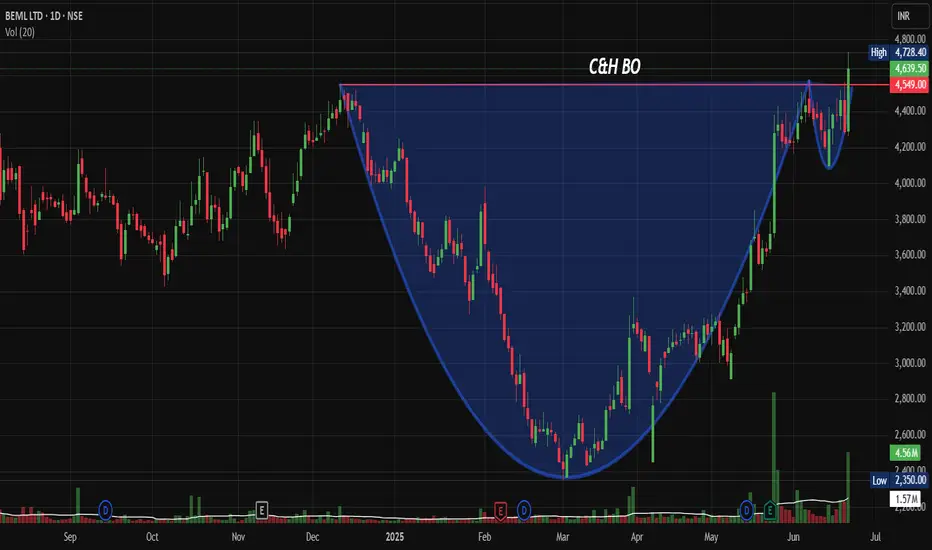
Sterlite Tech: From Despair to Breakout – A Textbook Turnaround NSE:STLTECH : From Despair to Breakout – A Textbook Turnaround Story in the Making. It makes it to my chart of the week Idea after breaking out with good volumes.
Price Action Analysis:
-Recent Action: Strong green candle with significant body suggesting institutional accumulation
-Candle Structure: Minimal upper shadow indicates buying pressure throughout the session
-Previous Action: Series of consolidation candles around ₹85-95 showing accumulation phase
-Breakout Candle: Wide-range bar breaking above downtrend resistance with conviction
Price Swing Analysis:
-Higher Highs/Higher Lows: Recent price action shows initial signs of trend reversal
-Momentum Shift: Price moving from range-bound to trending behaviour
-Gap Analysis: No significant gaps visible, suggesting organic price discovery
Volume Spread Analysis (VSA):
Current Weekly Bar Analysis:
-Volume: 302.33M (Exceptionally high - 12x average volume)
-Spread: Wide range bar with substantial price movement
-Close Position: Closing in the upper 75% of the range
-VSA Interpretation: Professional Money Accumulation - High volume with wide spread and strong close
Volume-Price Relationship Breakdown:
Phase 1 (2022-2023): Distribution & Selling Climax
-High volume on down bars during the initial decline
-Volume spikes coinciding with major price drops
-Classic distribution pattern with professional selling
Phase 2 (2023-2024): Accumulation Phase
-No Supply Bars: Low volume on down bars indicates selling exhaustion
-Testing for Supply: Multiple tests of the ₹50-60 zone with reducing volume
-Background Volume: Consistently low volume, suggesting minimal selling pressure
Phase 3 (Late 2024-2025): Mark-up Beginning
-Effort vs Result: Increasing volume with improving price action
-Spring Action: False break below support, followed by quick recovery
-Current Bar: Classic "Upthrust After Accumulation" with massive volume
Volume Spread Analysis Summary:
Key VSA Signals Identified:
-Selling Climax: Evident in 2022 with high volume and wide down bars
-No Supply: Consistent pattern during 2023-2024 base formation
-Spring/Shakeout: Brief dip below ₹58 with immediate recovery
-Effort to Rise: Current massive volume surge on breakout attempt
-Professional Interest: Volume pattern suggests smart money accumulation
Chart Structure Breakdown:
-Base Formation: Classic Multi-Year Cup Base spanning approximately 3 years (2022-2025)
-Base Duration & Depth: 36+ months with a devastating 85% decline from peak (₹318 to ₹50 lows)
Volume Characteristics:
- Volume dried up significantly during the base formation phase
- Massive volume surge (302.33M vs 24.45M average) accompanying the recent breakout attempt
- Classic accumulation pattern with low volume during decline and high volume on breakout
Key Levels:
Support Levels:
- Primary Support: ₹58-60 (recent low and base formation floor)
- Secondary Support: ₹75-80 (previous resistance turned support)
Resistance Levels:
- Immediate Resistance: ₹125-130 (downtrend line resistance)
- Major Resistance: ₹193-200 (previous significant level)
- Ultimate Resistance: ₹242-250 (prior consolidation zone)
- Breakout Zone: ₹108-112 (current breakout level with volume confirmation)
Price Patterns:
-Primary Pattern: Multi-year Cup Base with potential Handle formation
-Current Action: Breakout from 3-year downtrend line with explosive volume
-Volume Confirmation: 12x volume surge validates the breakout authenticity
-Pattern Reliability: High probability setup given the extended base duration and volume characteristics
Trade Setup:
Entry Strategy:
Primary Entry: ₹110-112 on sustained breakout with volume above 50M
Add-on Entry: ₹115-118 on momentum continuation or successful retest of breakout zone
Early Entry: ₹105-107 for aggressive traders betting on breakout confirmation
Exit Strategy:
Initial Target: ₹140-145 (measured move from base depth)
Secondary Target: ₹175-180 (intermediate resistance zone)
Ultimate Target: ₹200+ (major resistance retest)
Trail SL: Use a 20% trailing stop once the initial target is achieved
Stop-Loss and Risk Management:
Ideal Stop-Loss: ₹95-98 (below breakout zone invalidation)
Conservative SL: ₹88-90 (below recent swing low with buffer)
Position Sizing: Risk 1.5-2% of portfolio capital given the high-conviction setup
Risk-Reward: Attractive 1:3 to 1:4 ratio to initial targets
Sectoral and Fundamental Backdrop:
Sector Outlook:
Sector: Telecom Infrastructure & Optical Fiber - benefiting from 5G rollout momentum
Relative Strength: Telecom capex cycle turning positive with the government's digital infrastructure push
Peer Performance: Optical fiber and telecom equipment stocks showing renewed interest
Stock Fundamentals:
Business Turnaround: The Company has been restructuring operations and reducing its debt burden
Growth Catalyst: 5G infrastructure deployment and the government's Digital India initiatives provide tailwinds
Financial Health: Improving operational efficiency, though still in recovery phase
Technical-Fundamental Alignment: Multi-year base formation coincides with business restructuring completion
Overall Trade Summary:
Reward-to-Risk Ratio: 3.5:1 to initial target, extending to 5:1+ for swing targets
Conviction Level: High- Textbook cup base with volume confirmation.
Ideal Trader Profile:
- Swing Traders: 4-8 week holding period for initial targets
- Positional Traders: 6-12 month horizon for major resistance retest
- Momentum Players: Quick 15-20% moves on breakout continuation
Key Insight: "After 3 years of pain, Sterlite Tech is displaying all the hallmarks of a classic turnaround story - the kind that can deliver multi-bagger returns for patient capital."
Key VSA Insight: "The 12x volume surge represents the moment when smart money stops accumulating and starts marking up - a classic VSA signal for trend initiation."
My Take:
Trade Thesis: This represents a high-probability, low-risk entry into a fundamentally improving story at a technically optimal juncture. The combination of multi-year base, volume breakout, and sector tailwinds creates a compelling risk-adjusted opportunity.
Keep in the Watchlist.
NO RECO. For Buy/Sell.
📌Thank you for exploring my idea! I hope you found it valuable.
🙏FOLLOW for more
👍BOOST if you found it useful.
✍️COMMENT below with your views.
Meanwhile, check out my other stock ideas on the right side until this trade is activated. I would love your feedback.
Disclaimer: "I am not a SEBI REGISTERED RESEARCH ANALYST AND INVESTMENT ADVISER."
This analysis is intended solely for informational and educational purposes and should not be interpreted as financial advice. It is advisable to consult a qualified financial advisor or conduct thorough research before making investment decisions.