NRB Bearing - Cup & Handle PatternNRB Bearing after a downfall has made a cup & handle pattern and is looking to move upward. Other factors:
1. Last few quarters growth rate was not good because of fire in a major factory, which now has been rectified, and capacity has reached at same levels.
2. Capacity expansion of 200 crores
3. Promoter has un-pledged all shares, showing strong financial position
4. Cup & Handle with good volumes.
Keep following @Cleaneasycharts as we provide Right Stock at Right Time at Right Price.
Cheers!!
Volume

IDFC FIRST BANKIDFCFIRSTBANK.
Anything above 112 should be part of euphoria that may extend upto 164.17 (if sentiment allows); corrective 5th may end around 50-53 and then final thrust towards new high (5th) should begin. (If , moves past 80-83 without 5th correction , corrective wave count will be invalid).
Labelling of counts can be wrong in this, but you get the idea.

MCX Silver Analysis – Technical OutlookHere’s my latest view on MCX Silver📃
🎯 Silver recently broke out and has given a great move for the bulls above ₹1,00,000, giving almost a 9,000 points rally, confirming a strong bullish structure for the time being.
🎯 After hitting a local top range around ₹1,08,000 to ₹1,09,500 range, price is now pulling back toward a key liquidity zone (~₹98,000 to ₹99,000).
🎯 This demand zone also aligns with a high-volume zone — giving a strong indication that buyers may look to accumulate here.
🎯 RSI is cooling off into neutral territory, allowing for more upside potential.
Plan:
If Silver retraces into the ₹98,000-99,000 zone and holds, I’ll look for long setups targeting a move toward ₹1,20,000 in the coming months.
💡Always wait for bullish confirmation near the demand zone before entering.

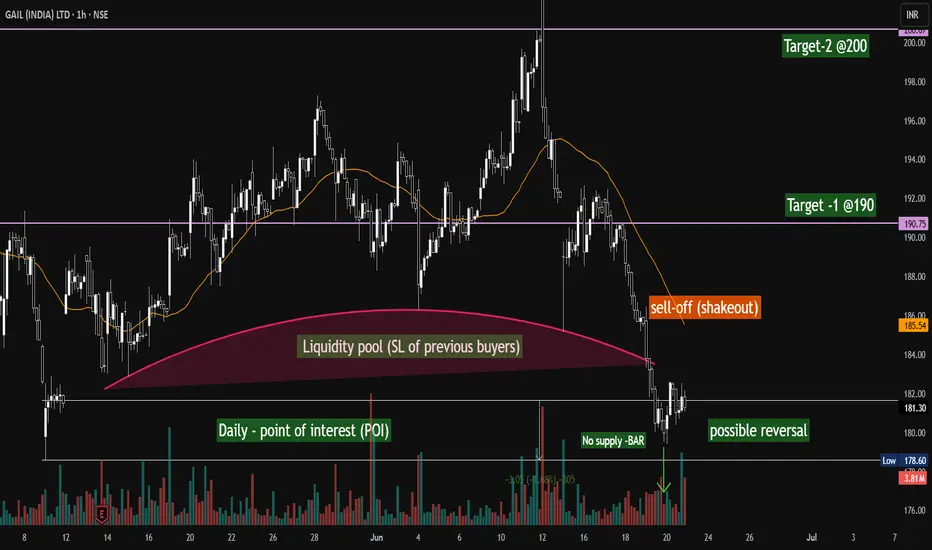
GAIL (INDIA) - Possible Reversal on the corner...GAIL (India) Ltd – 1H Chart Analysis (NSE) | June 21, 2025
Spotted a potential setup with key institutional footprints on the 1H chart:
🟥 Liquidity Pool Grab: Price dipped into the liquidity zone (SL sweep of previous buyers), potentially clearing weak hands.
📉 Shakeout Sell-Off: A sharp decline hints at a textbook shakeout—classic Wyckoff-style distribution at work.
✅ Daily POI + No Supply Bar: Price tapped into a higher timeframe (Daily) Point of Interest, accompanied by a low-volume no-supply bar—suggesting buyer strength.
🔁 Possible Reversal Brewing: Early signs of bullish intent emerging. Watching this zone for confirmation.
🎯 Targets in Sight:
Target 1: ₹190
Target 2: ₹200
Patience pays !!! —waiting for a break of structure and strength to follow through.
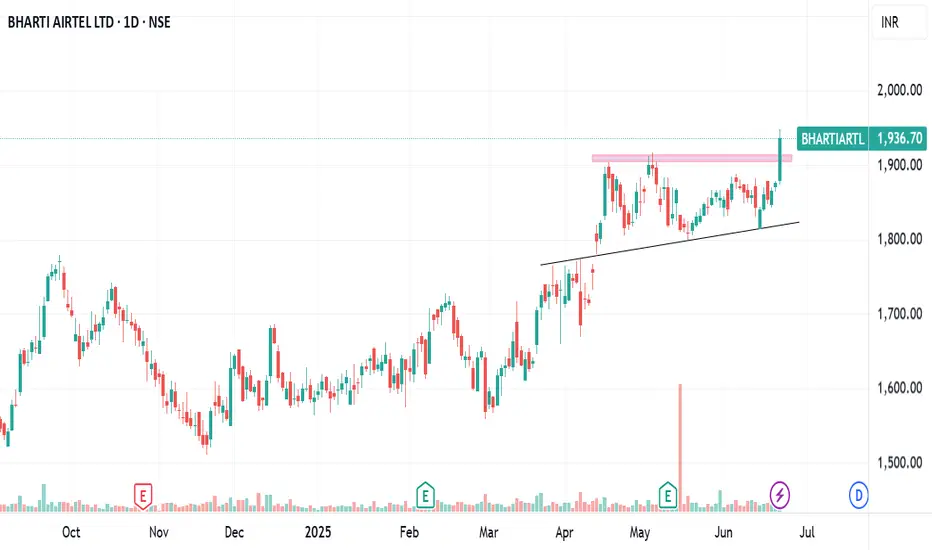
BHARTIAIRTEL ASCENDING TRIANGEL BREAKOUTBhartiAirtel breaking ascending triangel pattern
with huge volume,bullish RSI
macd crossover done
trading at ATH
reteslevel 1900,sl 1800
use ur sl as per ur risk level
NO BUY/SELL RECOMENDATION
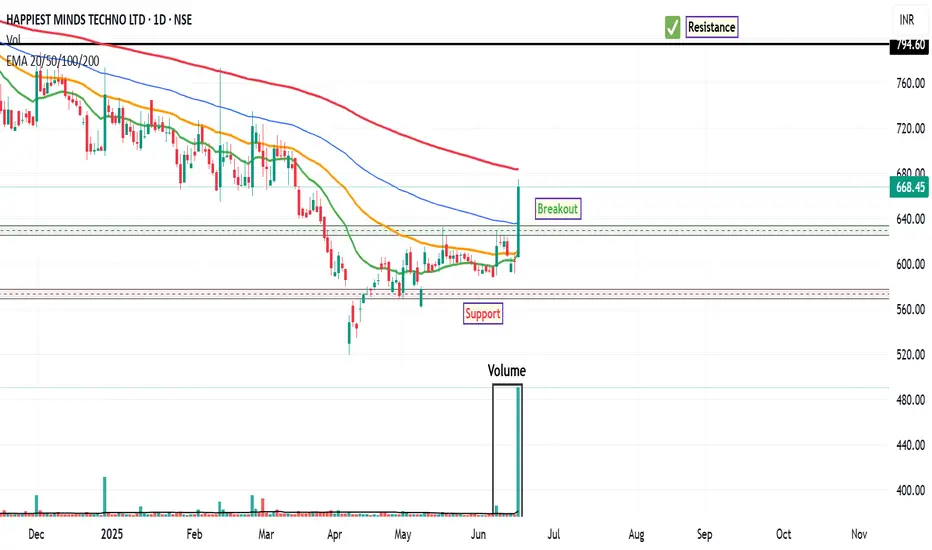
HAPPSTMND: Analysing the Bullish BreakoutHappiest Minds Technologies ( HAPPSTMND ) has recently exhibited a significant shift in market dynamics, marking a potential end to its prolonged downtrend that commenced in July 2024 . In a recent trading session, the stock registered an impressive 11% gain in single trading session signaling a resurgence of buyer interest.
This notable price appreciation was accompanied by a substantial surge in trading volume, with approximately 25M shares changing hands. This volume figure represents nearly 15 times the 20 MA volume, indicating a robust influx of buying conviction and significant market participation behind the upward move. Such a volumetric anomaly often provides strong confirmation for price breakouts or reversals.
From a momentum perspective, the technical indicators are also aligning to support a more constructive outlook. The MACD indicator on the weekly timeframe executed a bullish crossover several weeks ago, a development that typically precedes or accompanies long-term upward trends. Furthermore, the RSI has now advanced to the 54 level . While not yet in overbought territory, this move above the 50-mark suggests increasing bullish momentum and a healthy strengthening of the trend. This confluence of weekly MACD signals and improving daily RSI readings points towards a potentially strong long-term bullish movement.
Considering these technical observations, the stock may face a significant long-term resistance level around ₹794 . This level could present a crucial test for the prevailing bullish momentum, where a sustained breakout might pave the way for further upside. Conversely, for risk management purposes, traders may identify a suggested stop-loss zone and a breakout zone as illustrated on the accompanying chart, which would serve as key areas to monitor for potential shifts in price action or to define risk parameters.
Disclaimer: The information provided in this technical analysis is for informational and educational purposes only and should not be construed as financial advice. It is based on observations from historical price and volume data, and commonly used technical indicators. Market conditions can change rapidly, and past performance is not indicative of future results. All trading and investment decisions involve inherent risks, and losses can exceed initial investments. Always conduct your own comprehensive due diligence and consult with a qualified financial advisor before making any investment decisions.
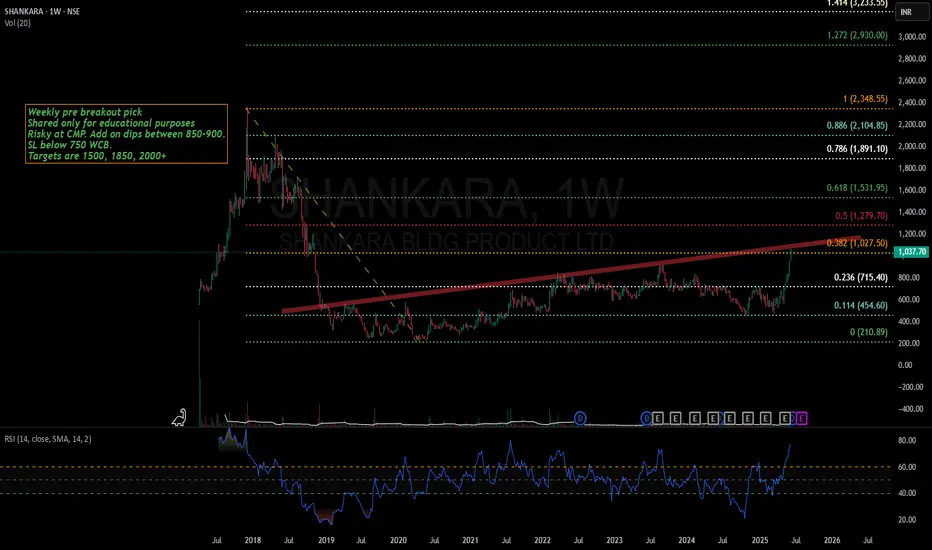
Shankara- U-turn pick for probable 2x returnsShankara has been in a accumulation phases since past 5+ years but has recently given a big breakout.
Stock has potential to fly more as it is just a start of stage 2
Stock can be kept in watchlist for big returns as a positional pick.
It is small cap stock and comes with high risk with high returns.
Please trade wisely and with proper SL.
Please note that this idea is not a recommendation and is for you to learn how stage 2 breakouts can be explosive.
Wockhardt-Bad fundamentals, Strong technicals!Wockhardt is an age old Indian pharma company which has been in loss since few years.
Stock has bounced from strong support and also gave inverted head & shoulders breakout.
Stock is consolidating post breakout.Not my usual technofunda pick but a very attractive technical breakout. Please know that risk is more with such ideas.

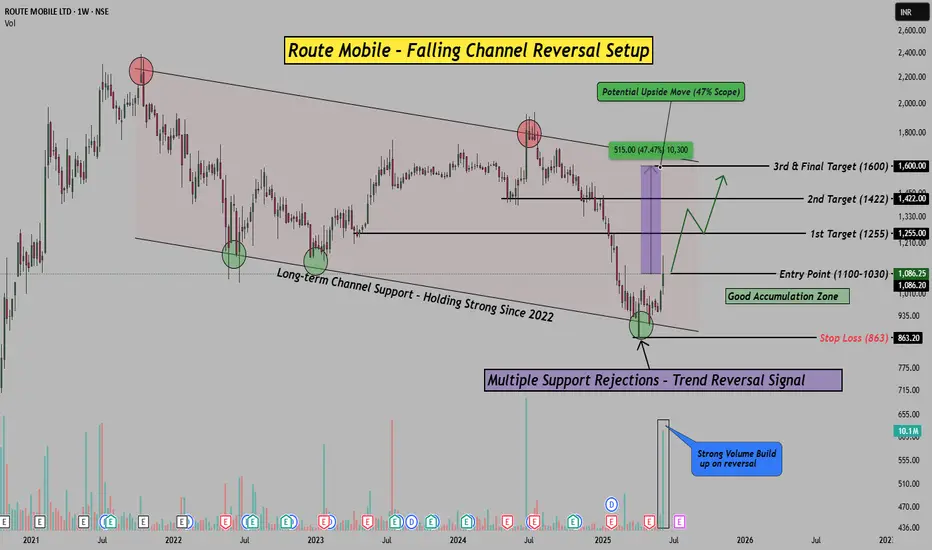
47% Potential Upside in Route Mobile? Channel Reversal Analysis!Hello Everyone, i hope you all will be doing good in your life and your trading as well! In today's post, i have brought a very interesting reversal setup on Route Mobile Ltd.
After spending over 2 years inside a falling channel , the stock has recently shown a sharp bounce right from the long-term channel support , which has held strong since 2022. Not just that, this bounce came with a strong volume spike , hinting at fresh buying interest.
The current price action structure is clearly indicating a potential trend reversal from the lows. I have marked a Good Accumulation Zone between (1100-1030) , where smart money seems to have stepped in. If this setup works out, I am looking we can see good spike in coming few weeks, Please check chart above to know about the targets.
To manage risk, I have kept a safe Stop Loss at 863 , which is approx 12% downside , while potential upside is over 47% . That gives us a solid risk-reward structure for positional traders.
Technicals Match Fundamentals:
Route Mobile is a strong player in global cloud communications, working with big names across the world. Long-term fundamentals remain stable, and the chart now supports a technical reversal.
If you enjoy such chart-based trade setups backed by structure and logic, don’t forget to LIKE & FOLLOW for more.
Disclaimer: This idea is purely educational. Please consult your advisor before investing.
Pfizer: supply zone breakout-A simple supply zone breakout
-My entry is at 5800, with a stop loss of 5599
-there has been a volume uptick of late with some interesting developments in the cancer and other fields including expansion in China by the parent company
-Covid resurgence also increases the demand of the vaccine which may again improve the top and bottom line

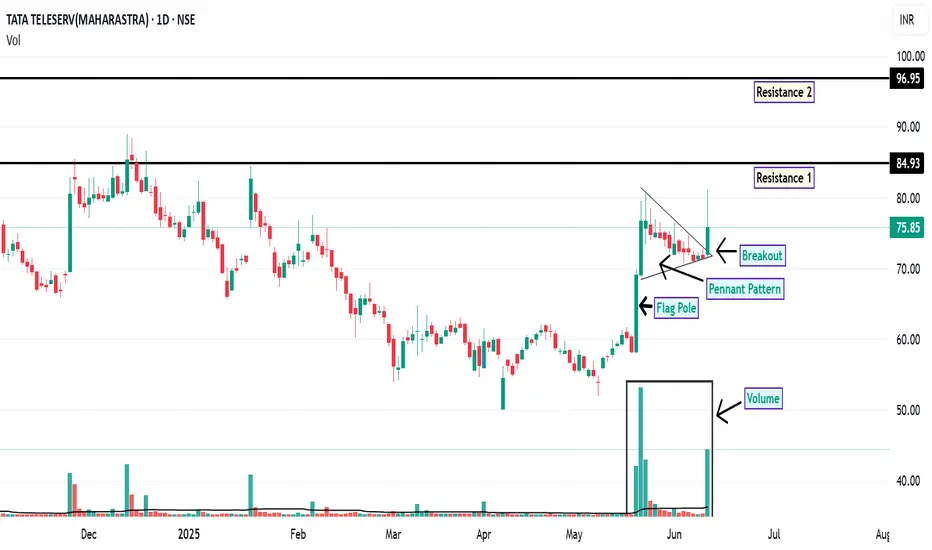
TTML: Pennant Breakout Signals Potential Upside
On the daily chart, TTML has recently exhibited a breakout from a pennant formation , a pattern often associated with potential continuation of the prevailing trend. This breakout is accompanied by a notable increase in trading volume, which may indicate growing market interest and participation.
Additionally, the price action has shown support at the 200-day EMA, a widely observed long-term trend indicator. This confluence of technical signals may suggest a strengthening bullish sentiment.
From a momentum perspective, both the RSI and MACD indicators are currently positioned in bullish territory on both the daily and weekly timeframes. This alignment across multiple timeframes can be interpreted as a sign of potential trend continuation.
Looking ahead, the price may revisit the ₹75 level, which could act as a demand zone. Should the stock manage to close and sustain above ₹76.40 , the next potential resistance levels to monitor are around ₹84.93 and ₹96.95 . For risk management, a suggested stop-loss level could be considered below ₹62 , based on recent support structures.
Disclaimer: This analysis is intended solely for informational and educational purposes. It does not constitute investment advice or a recommendation to buy or sell any financial instrument. Market participants are encouraged to conduct their own research or consult with a licensed financial advisor before making any investment decisions.
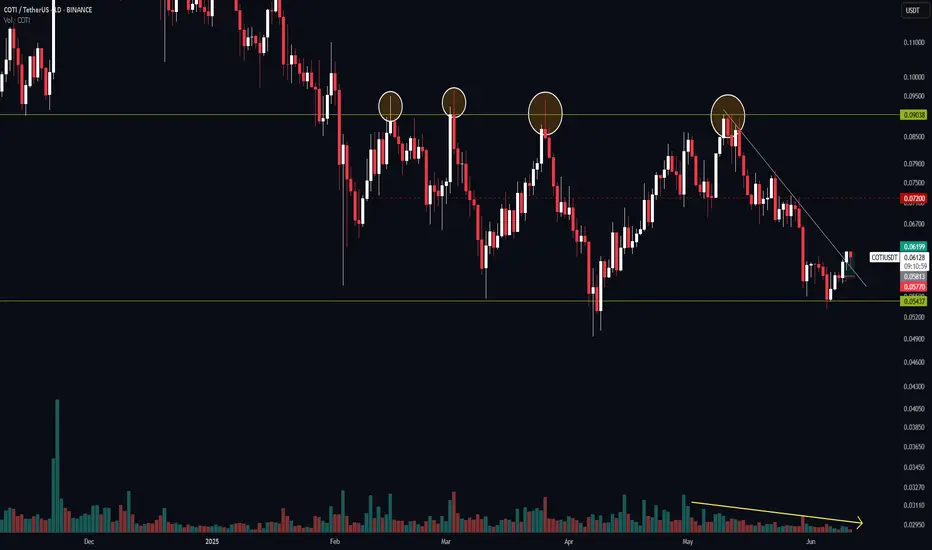
COTI/USDT Daily Timeframe Analysis Cycle Overview:
HWC: Ranging 🔁
MWC: Bearish 🔽
LWC: Bullish 🔼
🧠 Market Structure & Setup:
COTI has broken above its key daily trendline and is currently retesting that zone — a typical pullback setup. This break, combined with a bullish LWC and strong support on the COTI/BTD pair, offers a long-term opportunity, though the setup carries significant risk.
The COTI/BTD pair is still trending downward, but it's sitting right on a strong historical support, which could provide a good entry before a possible breakout of the daily resistance — a level that has seen four strong rejections in the past.
That gives us a clean invalidation and a solid risk-to-reward setup if the breakout follows through.
Another bullish signal: Volume has been decreasing during the recent pullback from the top, indicating a potential exhaustion of sellers — which strengthens the breakout scenario.
🔑 Key Levels:
🔸 Major Resistance: 0.07200 – a strong barrier; if price breaks and holds above this, momentum could accelerate.
🟢 I’m not closing the position yet — waiting to see if price reaches the daily high and breaks out.
🚫 No short position in play.
⚠️ This is a long-term and high-risk setup — not suitable for short-term traders.
⏳ Be aware: holding this trade may take time — patience is required.
💡 Strategy:
No trades while price is inside the current range. I'm waiting for price to reach the trendline.
If the reaction is weak, I’ll keep the position open, expecting a potential breakout due to multiple prior touches.
Traders seeking confirmation can wait for a clean breakout above 0.07200 or the daily high level.
✅ Summary:
Long-term setup with risk
Clear invalidation and logical entry
Volume behavior supports the idea
May require holding the position for an extended period — manage expectations
Not financial advice — for educational purposes only
📌 Got a specific coin in mind? Drop it in the comments and I’ll chart it for you.
⚠️ Without proper risk management, you're just a ticking time bomb.
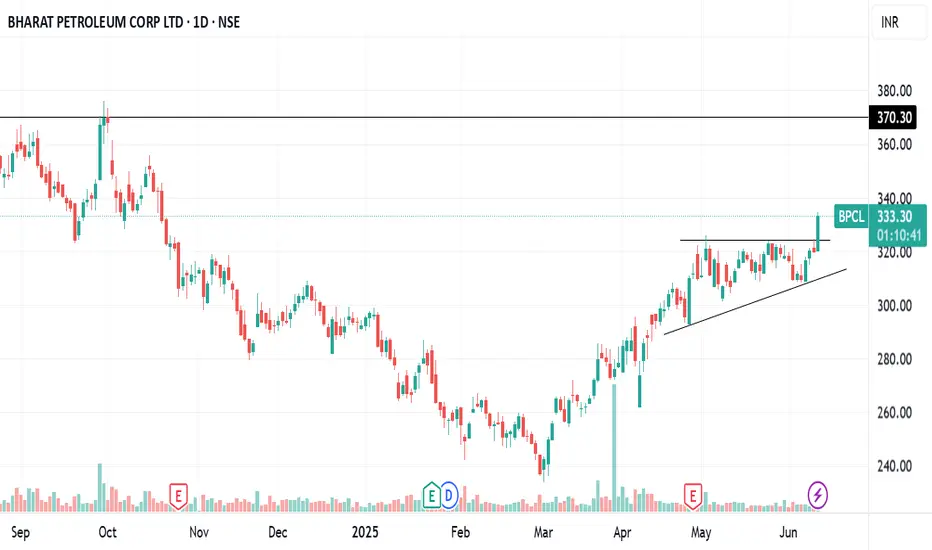
BPCL ASCENDING TRIANGLE BREAKOUTBPCL breaking ascending triangle pattern
bullish RSI ,huge volume
macd crossover done
#target 370
NO BUY/SELL RECOMENDATION
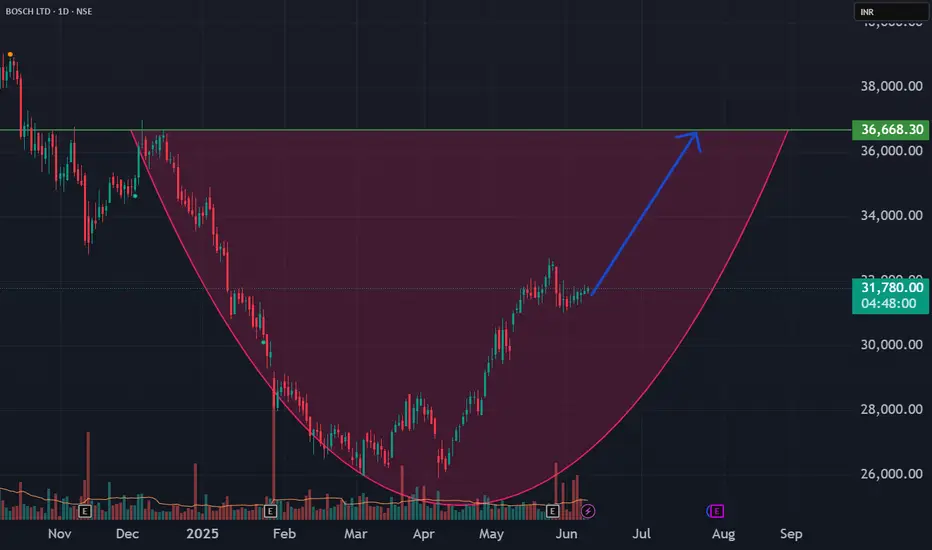
Bosch Ltd still juice pending in this counter looks goodBig share need to go slow and steady can be a good return rounding bottom yet to complete 15% can be archived if next 30 days
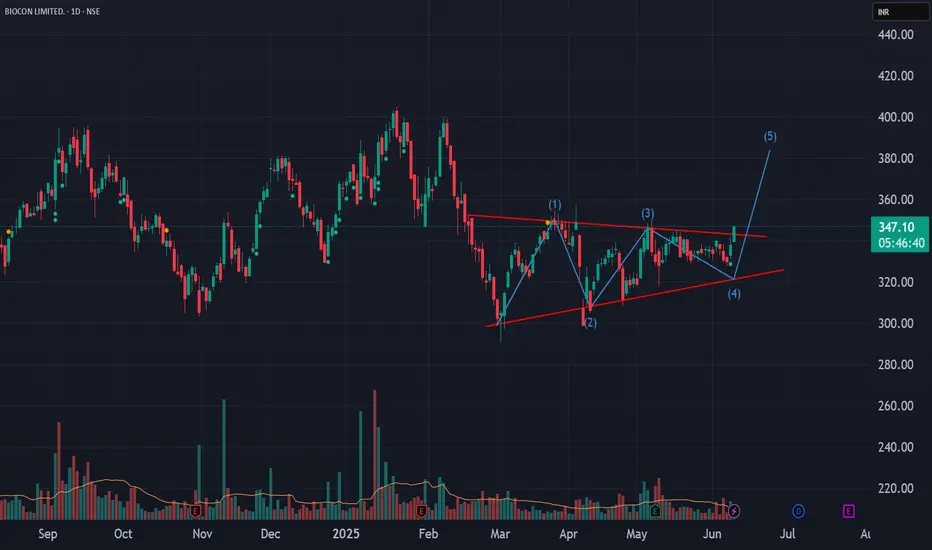
Biocon looking good technically and pattern seems nice
ABCDE pattern and big e possible looing right to me can enter with good targets
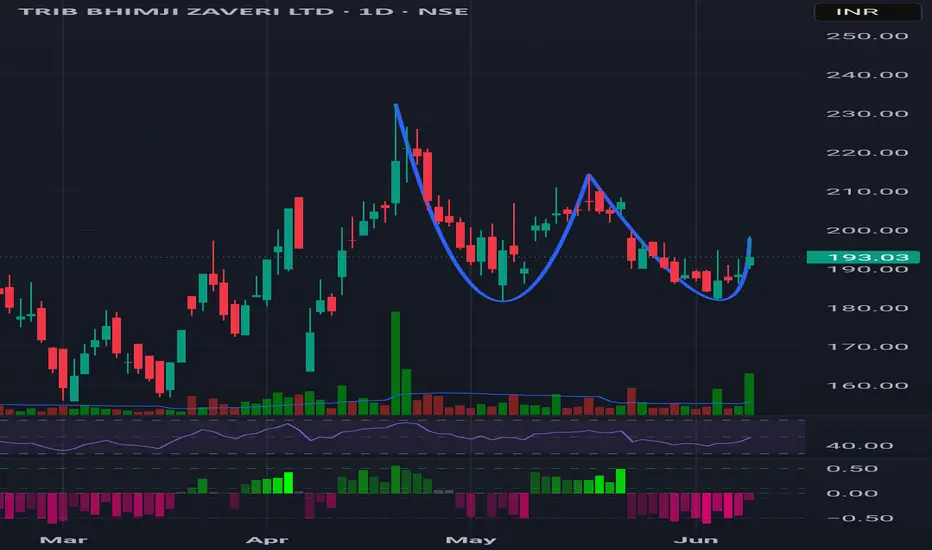
TBZ cup and handle - handle itself is another cup?Tbz volume seen
15% down recently from 214 and coming back up
Seems to be a nice entry point
SERVOTECH: Volume Surge Signals StrengthAn analysis of the weekly chart for SERVOTECH indicates a noteworthy technical development. The security has exhibited a breakout above a key pivot level previously identified around the 148 price zone.
This price action was accompanied by a substantial volume surge. The weekly volume registered approximately 34 million shares, a figure representing a more than five-fold increase compared to its 50W moving average of volume. Such a significant expansion in volume on a breakout can suggest strong institutional interest and conviction behind the move.
Further supporting a bullish outlook of RSI is situated above the 60 level on both the weekly and daily timeframes. A confluence of strong RSI readings across multiple timeframes is often interpreted by market participants as a sign of robust and broad-based upward momentum.
Based on this technical structure, the following price levels may be of interest for observation:
From a strategic standpoint, the stock may present a potential accumulation zone around the 150 level. The 195 level is identifiable as the next area of potential overhead supply, or resistance, where selling pressure might emerge. From a risk management perspective, a breach of the 136 level could challenge the validity of the recent bullish structure and might be monitored accordingly.
Disclaimer: The information provided in this stock analysis is for informational and educational purposes only and should not be construed as financial advice. Always seek the advice of a qualified financial advisor or conduct your own thorough research before making any investment decisions. Market conditions are dynamic, and past performance is not indicative of future results.

SHAKTI PUMP : A text book break out• Stock broke a 4 month long short term trendline on 06th Jun25.
• Taken support from long term trendline.
• Big boys took position for the last 2 months without disturbing the price.
• An increase in volume is the testament of the hypothesis.
• Go long on positional/swing basis.
• Target 1: 1029.5
• Target 2: 1192
• Target 3: 1356.5
• SL for Swing traders: 878
• SL for positional trader: 839
• A RR of 1:4.75. A classical textbook breakout.
• Enjoy the show!!!

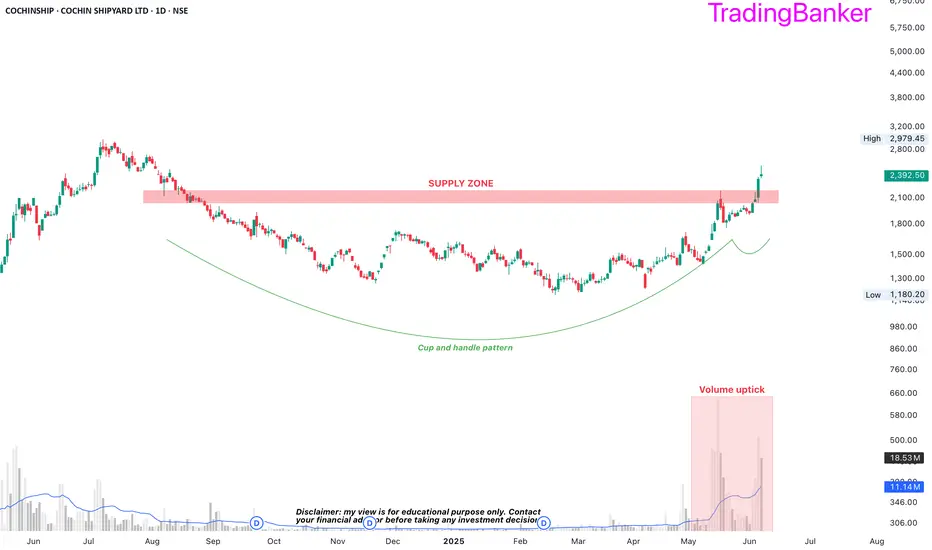
COCHINSHIP: cup and handle breakout🔶𝗜 𝘀𝗰𝗮𝗻𝗻𝗲𝗱 𝘁𝗵𝗿𝗼𝘂𝗴𝗵 𝗵𝘂𝗻𝗱𝗿𝗲𝗱𝘀 𝗼𝗳 𝘀𝘁𝗼𝗰𝗸𝘀 𝘀𝗼 𝘁𝗵𝗮𝘁 𝘆𝗼𝘂 𝗱𝗼𝗻'𝘁 𝗵𝗮𝘃𝗲 𝘁𝗼🔸
Here are My Top 7 Breakout Picks
1. COCHINSHIP
-cup and handle breakout
-had alerted about it
-huge volumes in the recent days
-defence sector is a goto especially in the Make in India theme
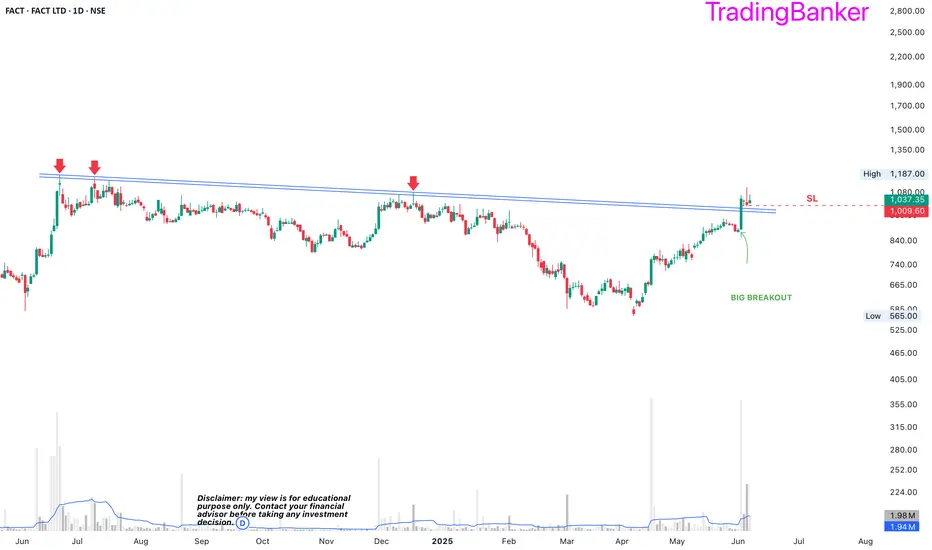
FACT: trendline breakout2. FACT
-strong breakout from the trendline resistance
- stop loss at 1009 giving a great reward to risk ratio
-volume uptick
-chemical sector has been moving recently and it may be a delayed move
ARKADE: supply zone breakout3. ARKADE
-strong breakout through the supply zone
-all time high breakout
-volume uptick in the breakout candle

SIGACHI: supply zone breakout5. SIGACHI
-supply zone breakout in the offing
-weekly volume uptick has been sharp in the last two weeks
-the financial results reflect the highest ever sales in the last fy which may result into a higher profit margin eventually when the company can increase margins

VINCOFE: trendline breakout7. VINCOFE
-trendline breakout in the offing
-sector is showing some increased activity
-volume uptick in the recent days
