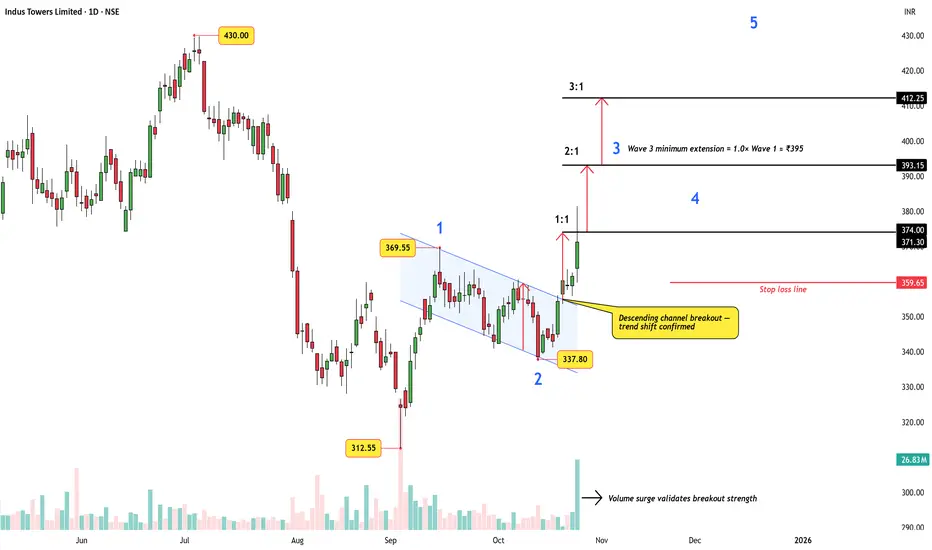
Indus Towers: Channel Breakout Meets Wave TheoryA simple but powerful concept from classical technical analysis — the channel breakout target — plays out beautifully here.
This idea, also discussed by Dr. Sudhir Dixit in his book on breakout signals, gives traders a disciplined way to estimate post-breakout targets.
After a steady five-wave advance from ₹312.55 to ₹369.55, Indus Towers entered a clean descending channel , forming the corrective Wave 2.
The breakout that followed came with a strong volume surge , confirming a clear shift in trend direction.
Concept Recap
In a channel breakout, the target can be derived by measuring the height of the channel (distance between support and resistance) and projecting it upward from the breakout point.
That gives the 1:1 projection , while stronger rallies often stretch toward 2:1 or 3:1 multiples of that range.
Wave Perspective
Elliott Wave traders can interpret this breakout as the early phase of Wave 3 , which typically extends 1.0 to 1.618× Wave 1 .
In this case, the 1.0× projection aligns near ₹395, while higher targets in the ₹412–₹430 zone fit naturally within Wave 3–5 progression.
Key Chart Highlights
Descending channel breakout — trend shift confirmed
Volume surge validates breakout strength
Wave 3 minimum extension ≈ ₹395
Stop-loss below ₹359 keeps the structure intact
Takeaway:
Even without labeling waves, the logic of a channel breakout offers a structured, rule-based method for identifying profit zones.
Combine it with wave theory, and you transform a simple pattern into a roadmap for impulsive rallies.
Disclaimer: This analysis is for educational purposes only and does not constitute investment advice. Please do your own research (DYOR) before making any trading decisions.
Volume
SBI Life (D): Breaks Consolidation, Now Faces All-Time High TestAfter a long consolidation phase that began in May 2025, SBI Life has delivered a decisive breakout. This move signals a potential end to the sideways action and a resumption of the primary uptrend, but it now faces its most significant hurdle.
1. The Breakout from Consolidation
Today's session (Monday, October 27, 2025) was a clear win for the bulls:
- The stock gapped up at the open, clearing the consolidation range's resistance.
- It surged to close with a gain of +3.44% on a solid volume of 2.87 million shares.
This action has propelled the stock to less than 2% below its major long-term resistance level formed by the All-Time High (ATH).
2. The Bullish Undercurrent
The potential for a successful breakout to new highs is strongly supported by a powerful alignment of momentum indicators across all major timeframes (Monthly, Weekly, and Daily):
- Short-Term EMAs: All three timeframes are in a bullish Positive Crossover (PCO) state.
- RSI (Relative Strength Index): The RSI is also in a rising trend on all three timeframes.
This multi-timeframe alignment shows a broad and synchronized bullish momentum building under the key ATH level.
3. A Critical Warning: The "Bull Trap" Scenario
As you've insightfully noted, a breakout to a new high is not automatically a "buy" signal. A critical "what-if" scenario must be monitored closely, as the price is approaching a level that could form a Double Top or Triple Top (a bearish reversal pattern).
Traders should watch for these two warning signs at the ATH level:
1. Bearish Divergence: The price pushes to a new high, but the RSI fails to, creating a lower high. This is a classic sign of weakening momentum.
2. Low Volume: The breakout occurs on low or unconvincing volume, suggesting a lack of genuine conviction from institutional buyers.
If this combination occurs, it would signal a high probability of a "bull trap" and a potential bearish reversal.
Outlook
This is a time for patience and careful observation. The stock has broken its immediate resistance but now faces the final boss. Before any action, the key is to wait for the price-action at the All-Time High.
A failed breakout with divergence would be a bearish signal. A confirmed , high-volume breakout would be the true signal that the uptrend is resuming.

CUMMINSIND ROUNDING BOTTOM BREAKOUTCumminsind breaking rounding bottom weekly
with good volume building up last few week
RSI above 60,trading above 20 ema
q2 result on 6th nov
immediate target 4500
NO BUY/SELL RECOMENDATION

BANCOINDIA Testing Powerful Demand Zone + Breakout Retest 🧠 Understanding the Smart Money Footprints 🧠
Demand and supply zones are not just colorful boxes on a chart — they represent the footprints of smart money . When institutions buy, they don’t enter all their orders at once like retail traders do. Instead, they accumulate positions in parts — leaving behind a visible trail that we can identify on charts through price imbalances. These imbalances structures — form demand and supply zones .
When price returns to these zones, it’s essentially revisiting the footprints of big players — the levels where unfilled institutional orders might still exist.
In BANCOINDIA, we can clearly see this institutional footprint. The stock is now trading near a high-quality demand zone . The structure here is clean and powerful — a perfect Rally–Base–Rally (RBR) formation.
The leg-out candle that formed this demand zone had strong follow-through and even broke past the previous all-time high , confirming intense buying pressure. Now that price is revisiting this zone, it’s showing potential for a fresh upside move.
📉 Traditional Technical Lens 📉
Let’s now analyze BANCOINDIA through the classical technical perspective.
The stock had earlier broken a significant resistance level with massive bullish volume . That breakout confirmed strong demand participation. Now, price is retracing back toward that same level — which, according to the Law of Polarity , should act as new support.
Moreover, the 50 EMA is aligning beautifully beneath the price. The ongoing pullback is approaching both the EMA 50 and the previous resistance — a confluence that further strengthens the bullish bias.
If we observe the volume , we can see that the selling volume is drying up compared to the prior rally. This shows a lack of bearish momentum, increasing the probability of a bounce from current levels.
🎯 Confluence & Trading View 🎯
When we combine both lenses — Demand & Supply Zone Analysis and Traditional Technical Analysis — we find strong confluence:
The stock is sitting inside a powerful Rally–Base–Rally Demand Zone .
The previous resistance has now turned into support (Law of Polarity).
The 50 EMA is acting as an additional support layer.
Volume analysis shows selling pressure drying up.
Together, these signals suggest a high-probability reversal zone. If BANCOINDIA respects this area, we could see the next leg of rally begin soon.
However — as all seasoned traders know — no setup is 100% guaranteed. Risk management is your best friend. Always define your stop loss before thinking about your target. Even the strongest setups can fail, and protecting your capital must come first.
Identify your demand zone and entry level precisely.
Place your stop loss logically below the zone.
Aim for a 1:2 or 1:3 risk-to-reward ratio .
Let the market do the work — not emotions.
"In trading, patience and risk control build fortunes — not predictions."
Lastly, Thank you for your support, your likes & comments. Feel free to ask if you have questions. 🚀
📚 This analysis is purely for educational purposes and is not intended as a trading or investment recommendation. I am not a SEBI registered analyst.

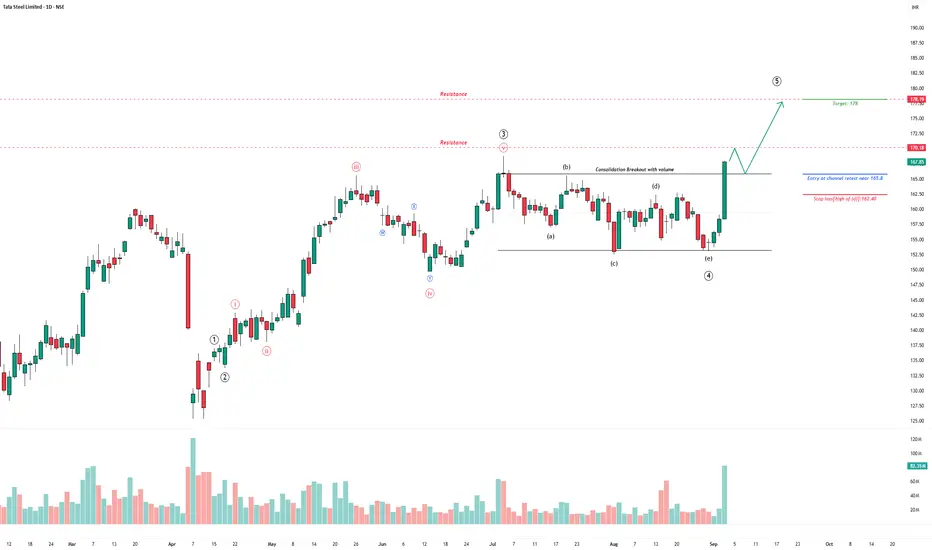
Tata Steel – Consolidation Breakout with VolumeAfter weeks of sideways price action, Tata Steel has broken out of its consolidation phase with a powerful surge in volume.
The breakout candle not only cleared the consolidation range but did so with conviction — volume spiked to multi-week highs, confirming participation. If price holds above the breakout zone, immediate resistances are lined up at ₹170 and ₹178.
Trade Plan
Entry on retest near ₹165.8.
Target: ₹178.
Stop-loss: ₹162.4.
Invalidation
A close below ₹162.4 would weaken the breakout narrative and invalidate this setup.
Disclaimer:
This analysis is for educational purposes only and does not constitute investment advice. Please do your own research and consult a financial advisor before making any trading decisions.
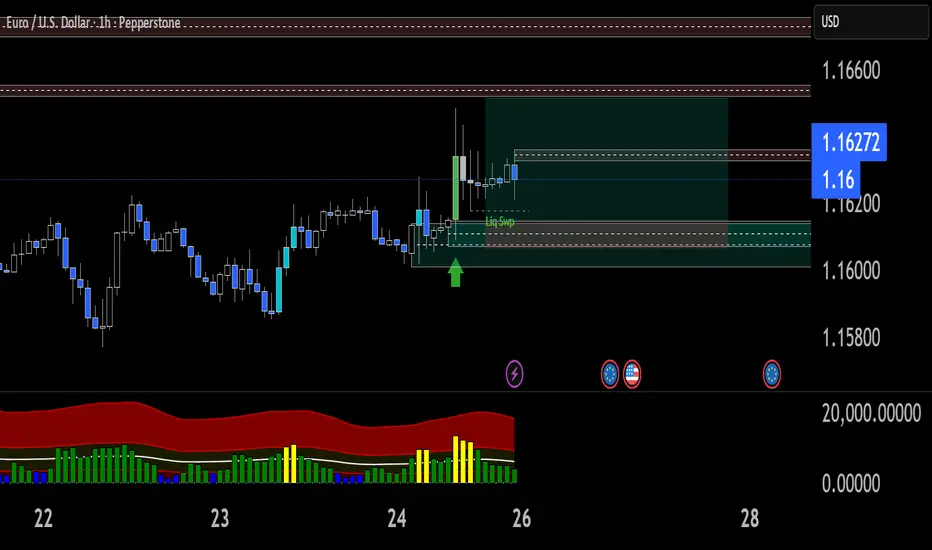
EUR/USD Bullish Setup – Liquidity Sweep & Break of StructureI’m sharing a long trade setup on EUR/USD based on a liquidity sweep and bullish market structure shift.
Price swept liquidity below the recent swing low and immediately showed strong bullish reaction, indicating absorption of sell-side liquidity. Following the sweep, price broke above short-term structure and retested the demand zone, confirming bullish intent.
I entered long at the retest of the demand area, with my stop-loss placed just below the liquidity sweep low to protect against invalidation. The take-profit target aligns with the next major supply zone / equal highs.
Trade Details:
Entry: 1.16147
Stop-Loss: 1.16066 (below liquidity sweep area)
Take-Profit: 1.16515 (major resistance/target zone)
Risk-to-Reward Ratio: 1:4.5+
Why this trade?
Liquidity sweep below previous lows (manipulation phase)
Break of structure to the upside confirming bullish momentum
Retest of demand zone with bullish candle confirmation
Volume spike supporting buyers entering the market
If price holds above the retest zone, I expect continuation to the upside toward the marked target area.
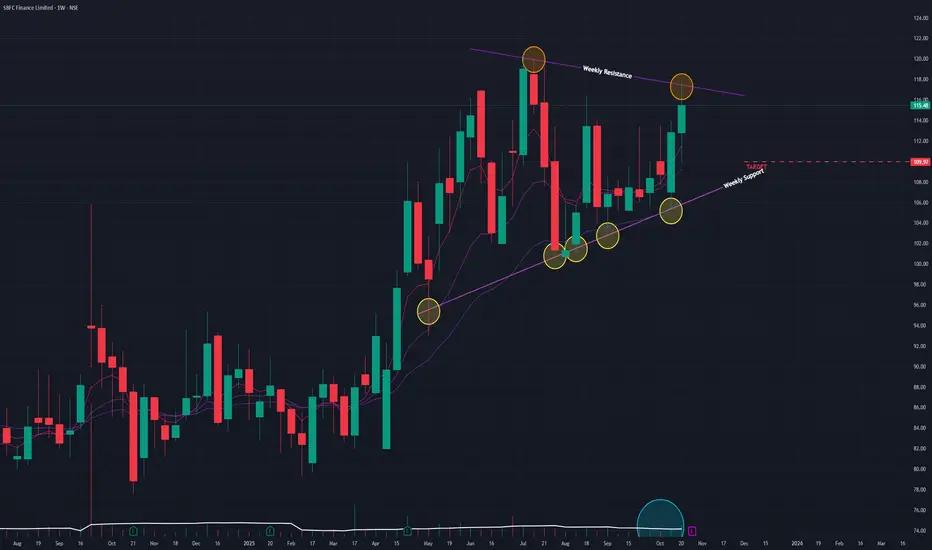
SBFC (W) - Coils in Triangle Pattern, Awaiting a Decisive BreakAfter a post-IPO sideways trend, SBFC has been consolidating within a Triangle Pattern since April 2025. The stock is currently in a state of building tension, with bullish underlying indicators running into a strong, proven resistance.
The Bullish Undertone
The technical indicators on higher timeframes are showing constructive strength, suggesting a bullish bias:
- Strong Momentum: The short-term Exponential Moving Averages (EMAs) are in a bullish Positive Crossover (PCO) state on both the Monthly and Weekly charts.
- Rising Strength: The Relative Strength Index (RSI) is also rising on both the Monthly and Weekly timeframes.
- Volume: Trading volume has remained at an average level, indicating an absence of significant selling pressure during this consolidation.
The Key Resistance
Despite these bullish indicators, the stock remains trapped below the upper resistance trendline of the triangle. The strength of this resistance was confirmed last week , when the stock attempted to break out but failed to close above the trendline , resulting in a "fakeout."
This week's action, a modest surge of +2.35% on 16.77 million in volume, is another attempt to push against this same barrier, but it has not yet succeeded.
Outlook and Key Levels
The stock is at a clear inflection point. A decisive move is required, as the price is being squeezed between rising momentum and a hard ceiling.
- Bullish Scenario: A breakout will only be confirmed with a decisive close above the upper resistance trendline on high volume . If the stock can achieve this and sustain the momentum, the next potential target is the ₹115 level.
- Bearish Scenario: If the stock is rejected from this resistance again and fails to sustain its upward momentum, it will likely fall back with a potential downside to the ₹110 level.
The price action in the coming trading sessions is critical. All eyes should be on the upper trendline of the triangle for either a confirmed breakout or another rejection.
Shipping Corp (W) - Breaks Out on Massive 21% Weekly SurgeAfter a significant downtrend from its July 2024 All-Time High, the Shipping Corporation of India (SCI) has signaled a powerful bullish trend reversal, culminating in a decisive, high-volume breakout this past week.
The Bullish Reversal
The downtrend that began last year found its bottom in March 2025. Since then, the stock has been in a constructive reversal phase, systematically forming a series of Higher Lows . This classic pattern indicated that selling pressure was being absorbed and buyers were becoming more aggressive, setting the stage for a potential breakout.
This Week's Decisive Breakout
This past week (ending Oct 24, 2025), the bullish setup was decisively confirmed:
- Massive Price Surge: The stock exploded by +21.82% for the week.
- Enormous Volume: This move was backed by a huge volume of 107.25 million shares .
- Key Resistance Breach: The surge shattered a key horizontal resistance trendline , and importantly, the stock closed the week above this level , which is a strong sign of confirmation.
This breakout is powerfully supported by the volume pattern: after drying up during the consolidation phase, it has now picked up significantly, validating the move.
Underlying Technical Strength
The breakout is underpinned by strong momentum indicators on the higher timeframes:
- The short-term EMAs are in a bullish Positive Crossover (PCO) state on both the Monthly and Weekly charts.
- The Relative Strength Index (RSI) is also rising on both the Monthly and Weekly charts.
Outlook and Key Levels to Watch
With the resistance now cleared, the path of least resistance has shifted firmly upwards.
- Bullish Target: If this bullish momentum continues, the next logical area of resistance and potential price target is the ₹330 level.
- Critical Support: The recently broken resistance level, around ₹243 , now becomes the most critical new support zone to watch.
The key to watch for next week is follow-through buying or a successful retest of the ₹243 breakout level, which would further confirm the new uptrend.

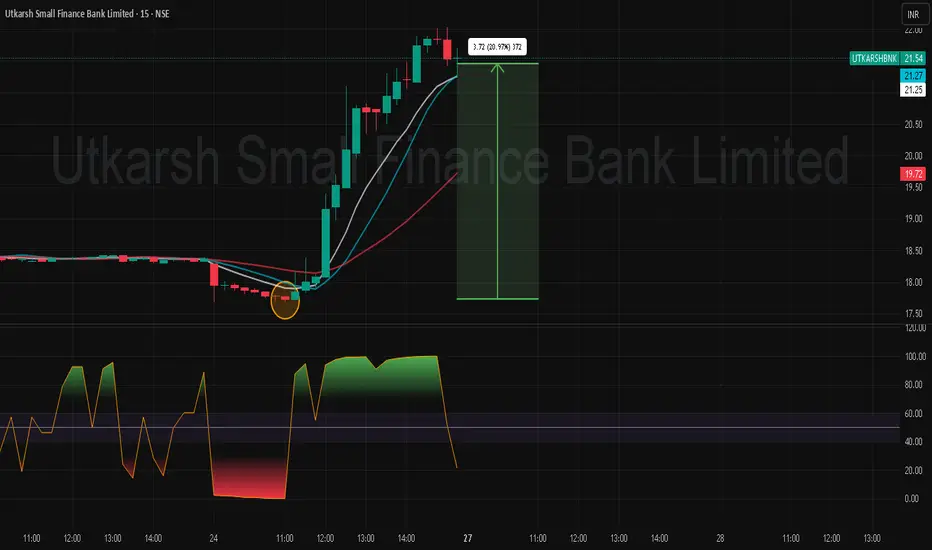
UTKARSHBNK - swing/INtraday Target/Trend analysis VOlumeSpike
149.07 million in single day
What is going on...
Utkarsh SFB shares rally 20% after lender allots 5.7 crore shares to Madhusudan Kela's fund house
Madhusudan Kela is making stock living GOLD
Insane Volume spike
Utkarsh Small Finance Bank Ltd
can see a long call after a little health distribution's or profit booking.
IDFC First (D) - High-Volume Breakout Confirms Bullish ReversalAfter a significant downtrend from its All-Time High in September 2023, IDFC First Bank has been in a clear trend reversal since April 2025. This new uptrend has just been powerfully confirmed by a high-volume breakout, signaling strong buyer commitment.
This Week's Decisive Breakout
The past week has been pivotal for the stock, culminating in a decisive technical event:
- Massive Weekly Volume: The stock has surged +9.85% so far this week, supported by an enormous total volume of 207.92 million shares .
- Today's Confirmation: Today's session (Thursday, October 23, 2025) saw a +2.85% gain on a massive 94.12 million shares, confirming the bullish conviction.
- Key Resistance Breach: Most importantly, the stock broke out and closed above a key short-term horizontal resistance trendline that had been in place since July 2025.
Broad-Based Technical Strength
This bullish price action is strongly underpinned by a powerful alignment of momentum indicators across all major timeframes (Monthly, Weekly, and Daily):
- Short-Term EMAs: All three timeframes are in a bullish Positive Crossover (PCO) state.
- RSI (Relative Strength Index): The RSI is also in a rising trend on all three timeframes.
This multi-timeframe alignment indicates that the bullish momentum is broad, synchronized, and strengthening.
Outlook and Key Levels to Watch
With the resistance now cleared, the path of least resistance has shifted upwards.
- Bullish Target: If this bullish momentum continues, the next logical area of resistance and potential target is the ₹90 level.
- Critical Support: The recently broken resistance now becomes the most critical new support level. A successful retest of this level would be a strong sign, while a failure to hold it would be a warning. A deeper support level exists at ₹70 , but the immediate focus should be on the new breakout zone.

JK Tyre (D) - Bullish Reversal Coils for Breakout AttemptAfter a significant downtrend from its All-Time High in February 2024, JK Tyre has successfully reversed its trend. Since March 2025, the stock has been establishing a constructive pattern of Higher Lows , indicating a clear and systematic shift from selling pressure to accumulation.
Current Standoff: Coiled Below Resistance
The stock is currently trading just below a significant overhead resistance level. This horizontal barrier is the primary hurdle that needs to be cleared to confirm the next leg of the uptrend.
Notably, the trading volume has been moderate , which is not a negative sign in this context. It is often characteristic of a "coiled spring" or an accumulation phase just before a decisive breakout, as selling pressure diminishes.
Powerful Underlying Strength
The bullish case is strongly supported by a powerful alignment of momentum indicators across all major timeframes (Monthly, Weekly, and Daily):
- Short-Term EMAs: All three timeframes are in a bullish Positive Crossover (PCO) state.
- RSI (Relative Strength Index): The RSI is also in a rising trend on all three timeframes.
This multi-timeframe alignment indicates that the bullish momentum is broad, synchronized, and strengthening, suggesting that an attempt to break the overhead resistance is likely.
Outlook and Key Levels to Watch
The stock is at a clear inflection point. The resolution of the battle at this resistance level will likely determine the next major move.
- Bullish Scenario: A decisive close above the resistance on high volume would confirm the breakout. This would signal a continuation of the new uptrend, with a potential next target of ₹485 .
- Bearish Scenario: If the stock fails to breach the resistance and momentum fades, it could be rejected and pull back to test levels around ₹370 .

Can Fin Homes: Fifth Wave Ignites with Volume BoostAfter completing the third wave advance up to ₹817 and a corrective Wave (4) near ₹708, Can Fin Homes has broken past the prior swing high with a clean volume expansion.
Wave Structure
Impulse sequence from ₹615 (Wave 2) to ₹817 (Wave 3), followed by a deep yet proportional Wave 4.
The current move looks like Wave (5) unfolding with minor waves 1-2-3 already visible.
Price has cleared the swing barrier at ₹826 — watch for a healthy retest near ₹826–₹830 before Wave 4 of (5) and a final push higher.
Momentum Check
The volume spike adds conviction to the breakout, signaling genuine demand rather than a one-day pop.
Targets
Fibonacci projection 1.618 ≈ ₹932 marks the next logical resistance zone.
Invalidation
A sustained drop back below ₹817 would question the breakout and delay the fifth-wave progression.
Strategy
Stay bullish, but don’t chase — let price retest the breakout zone before fresh entries.
Disclaimer : This analysis is for educational purposes only and does not constitute investment advice. Please do your own research (DYOR) before making any trading decisions.

HDFC Bank: Expanded Flat Unfolding Near Double-Top ZoneAfter a clean five-wave advance from ₹681.80 to ₹1,018.85, HDFC Bank appears to be tracing a textbook expanded flat correction.
Wave Structure
Wave 4 unfolded as a triangle, setting the stage for a channeled Wave 5 that topped at ₹1,018.85.
The subsequent decline to ₹940 formed Wave A, and the sharp rebound to ₹1,020 marks a classic B-wave retest of the prior high — effectively a double-top zone.
Wave C could now stretch toward the 0.5–0.618 retracement cluster (₹850–₹810) — an area also highlighted by the Visible Range Volume Profile (VRVP) as the highest liquidity pocket.
Volume Check & Market Tone
The VRVP shows thinning participation above ₹940 and a heavy node between ₹850–₹810 — implying that the real acceptance zone lies lower. This adds weight to the bearish bias for Wave C.
Fundamental Backdrop
Interestingly, the company reported a 10 % rise in Q2 profit, yet the stock closed flat near ₹1,003. While the headline looked positive, reported EPS (₹6.82) missed analyst expectations (₹11.29) by a wide margin, tempering sentiment. The price action reflects that disconnect — optimism capped by underwhelming earnings quality.
Summary
Expanded flat unfolding near a double-top zone, with price likely gravitating toward the ₹850–₹810 confluence before any meaningful base formation.
Disclaimer: This analysis is for educational purposes only and does not constitute investment advice. Please do your own research (DYOR) before making any trading decisions.

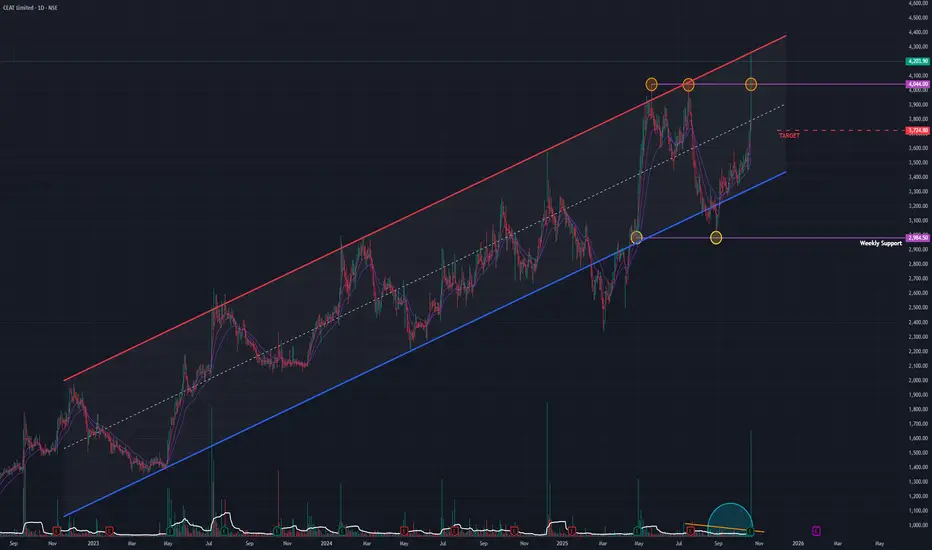
CEAT (D) - Critical Crossroads: Breakout vs. Channel ReversalAfter a multi-year uptrend, CEAT Ltd has arrived at a major inflection point. While it has broken a key horizontal resistance and hit a new all-time high, it has also run into the upper boundary of a long-term channel, a point that has historically marked a reversal. This creates a classic standoff between two powerful technical signals.
The Bullish Case: The Breakout
The primary argument for the bulls is the recent show of strength and the clearing of a significant hurdle:
- New All-Time High (ATH): The stock has successfully pushed into new territory, which is an inherently bullish sign.
- Horizontal Breakout: It has decisively broken out and closed above the horizontal resistance line formed by both the previous ATH and the upper limit of its recent consolidation phase.
- Consolidation & Dry Volume: Prior to this move, the stock was in a healthy consolidation phase since April 2025, during which volume was drying up . This is a classic sign that selling pressure was diminishing, often setting the stage for an upward move.
The Bearish Case: The Channel Resistance
Despite the breakout, the stock is still operating within the rules of a much larger, long-term pattern:
- The Parallel Channel: Since April 2020, the stock has been trading within a well-defined ascending parallel channel . It has consistently respected the upper trendline as a point of strong resistance and the lower trendline as support.
- Rejection at the Top: Today, by hitting its new ATH, the stock has also simultaneously hit the upper resistance trendline of this channel . Historically, every time the price has reached this boundary, it has reversed and trended back down towards the channel's support.
Conclusion and Key Scenarios to Watch
The price action in the next few trading sessions is critical and will likely resolve this technical conflict.
- Bullish Breakout Scenario: For the uptrend to accelerate, the stock must do something it has never done: achieve a decisive, high-volume close above the upper trendline of the parallel channel . If this occurs, it would invalidate the channel pattern and could signal a powerful new leg up, with a potential target of ₹5,100 .
- Bearish Reversal Scenario: If history repeats itself and the channel resistance holds, the stock will likely be rejected from this level. A failure to stay above the recent horizontal breakout would be the first sign of weakness, potentially leading to a reversal back down to the channel's median, around the ₹3,725 level.
In short, the market is at a "prove it" moment. The bulls have broken a minor resistance, but the bears are defending a major long-term boundary. The winner of this battle will likely dictate the trend for the coming months.
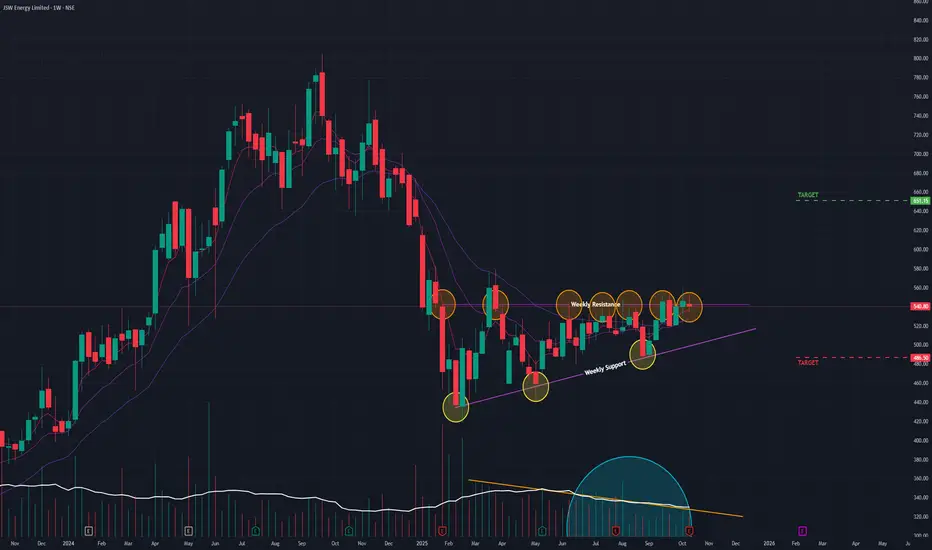
JSW Energy (W) - Coils in Bullish Triangle, Awaiting BreakoutAfter a prolonged downtrend from its September 2024 peak, JSW Energy is showing clear signs of a potential trend reversal, as it meticulously forms a classic bullish pattern. The stock is now approaching a critical decision point.
The Setup: An Ascending Triangle
Since February 2025, the stock has been forming a classic Ascending Triangle . This bullish pattern is characterized by:
- A series of Higher Lows , indicating that buyers are becoming more aggressive on each pullback.
- A flat horizontal resistance of Equal Highs , which has rejected several breakout attempts in recent weeks.
Crucially, as is typical for this type of consolidation pattern, trading volume has been noticeably drying up . This suggests that selling pressure is diminishing and energy is being stored for a potential significant move.
A Nuanced Technical Picture
The technical indicators suggest a trend that is in the process of turning bullish but has not yet received full confirmation across all timeframes:
- EMA: The short-term Exponential Moving Averages (EMAs) show a bullish crossover on the Weekly chart, but the longer-term Monthly chart is still awaiting this signal.
- RSI: The Monthly RSI is already rising (a positive long-term sign), but the Weekly RSI has yet to follow suit with a definitive upward trend.
This mix indicates that while medium-term strength is building, a decisive breakout is needed to align all timeframes and confirm a new, sustained uptrend.
Outlook and Key Triggers to Watch
The resolution of this triangle will likely dictate the stock's next major move.
- Bullish Breakout Scenario: A decisive close above the horizontal resistance on a surge of volume would confirm the breakout. This would signal the start of a new uptrend, with a potential next target of ₹650 .
- Bearish Scenario: If the stock loses momentum and fails to break out, it could fall back to test the rising support trendline of the triangle. The key support level to watch in this case is ₹485 .
The price action in the coming week will be critical. The focus should be on whether the bulls can finally generate the momentum needed to break through the overhead resistance and complete this bullish reversal pattern.
Whirlpool (W) - A Bullish Reversal Faces Its First Major testAfter a significant downtrend, Whirlpool of India is now exhibiting strong signs of a bullish reversal, highlighted by a classic candlestick pattern and a powerful weekly surge. However, it has now arrived at a formidable resistance level that will determine if this new momentum can be sustained.
The Bullish Reversal Signals
The foundation for this potential turnaround has been building systematically:
- Higher Lows: The stock has begun forming a pattern of Higher Lows , indicating that selling pressure is abating and buyers are stepping in at progressively higher prices.
- Morning Star Pattern: Crucially, a Morning Star candlestick pattern recently formed at a key support trendline. This is a classic and reliable three-candle bullish reversal signal.
Last Week's Explosive Confirmation
The bullish reversal signal was powerfully confirmed by last week's price action:
- The stock surged by an impressive +18.38% for the week.
- This move was supported by a high volume of 14.62 million shares .
- This single week's advance erased the losses of the previous five weeks , signaling a dramatic and decisive shift in market sentiment.
This renewed strength is supported by a rising Relative Strength Index (RSI) on both the Monthly and Weekly timeframes.
The Key Hurdle Ahead
The primary obstacle for the bulls is a strong horizontal resistance trendline that has been in place since May 2025. This level has successfully rejected several previous rally attempts, making it a proven barrier.
Outlook and Key Levels to Watch
The price action in the coming week will be critical, as it will reveal the outcome of the battle between the new bullish momentum and the established resistance.
- Bullish Scenario: A decisive breakout above the horizontal resistance on high volume would confirm the reversal and clear the path for a potential move towards the ₹1,700 level.
- Bearish Scenario: If the stock fails to breach this resistance and momentum fades, it could be rejected and pull back to test its primary support at ₹1,146.
In conclusion, while all signs point to a powerful bullish reversal, confirmation now requires a successful break of the key overhead resistance.

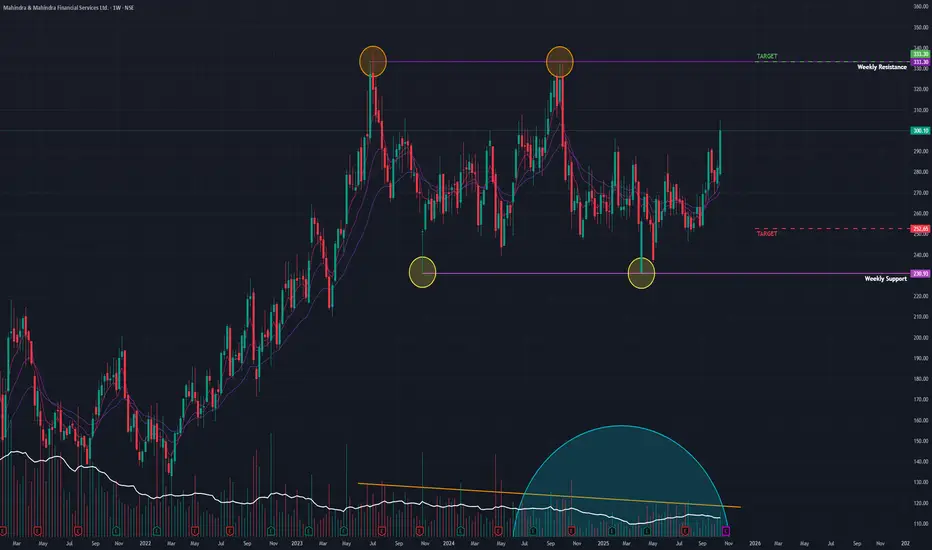
M&M Fin (W) - Renewed Strength within a Multi-Year ConsolidationAfter more than two years of trading in a sideways range, M&M Financial Services is showing strong signs of renewed buyer interest, suggesting a potential move towards the top of its long-term consolidation channel.
The Big Picture: A Prolonged Consolidation
Since reaching its All-Time High (ATH) in July 2023, the stock has been locked in a wide consolidation or sideways trend. A classic and often bullish sign during this phase has been the gradual drying up of trading volume , which typically indicates that selling pressure is diminishing.
Recent Bullish Action
The past week marked a significant shift in activity, signaling that bulls are becoming active again:
- The stock surged by +6.38% for the week.
- This move was supported by a strong volume of 15.49 million shares , indicating conviction behind the buying.
This renewed interest is supported by the underlying strength seen in higher timeframe indicators. Both the short-term Exponential Moving Averages (EMAs) and the Relative Strength Index (RSI) are in a bullish state on the *Monthly and Weekly charts.
Outlook and Key Levels
While the ultimate goal for bulls is a breakout above the distant ATH, the immediate battleground is the established trading range.
- Upside Target: The primary target in the near term is the upper limit of the consolidation range, around the ₹333 level. A breakout above this would be the next major bullish signal.
- Key Support: If this recent momentum fades, the stock is likely to find strong support at the lower boundary of its range, near the ₹250 level.
In conclusion, last week's strong performance suggests M&M Financial is preparing to challenge the top of its long-term range. The key now is to watch if this momentum can be sustained for a move towards the ₹333 resistance.
Bharti Airtel (W) - Parabolic Rally Pauses, Coils for New HighsAfter a historic, multi-year parabolic run, Bharti Airtel has entered a healthy consolidation phase right at its all-time high. The stock now appears to be gathering energy for its next potential move, with the upcoming week being critical for confirmation.
The Big Picture: A 716% Parabolic Uptrend
Since November 2018, Bharti Airtel has been in a massive parabolic uptrend, rewarding long-term investors with an incredible gain of 716% . Following such a powerful advance, a period of sideways consolidation is a normal and often bullish development as the market absorbs the gains.
The Current Setup: Consolidation at the Peak
The stock has recently been consolidating in a sideways range, during which trading volume has been noticeably drying up—a classic sign of accumulation before a potential breakout.
The past week saw a re-emergence of buying interest, with the stock surging +3.72% on a solid volume of 22.02 million shares . This move has pushed the price directly against the short-term resistance created by its recent All-Time High (ATH).
Underlying Technical Strength
The primary trend remains firmly bullish. This is confirmed by key momentum indicators on the higher timeframes:
- The short-term Exponential Moving Averages (EMAs) are in a positive crossover state on both the Monthly and Weekly charts.
- The Relative Strength Index (RSI) is also in a rising trend on the Monthly and Weekly charts.
Outlook and Key Triggers to Watch
The price action in the coming week is crucial and will be dictated by its interaction with the ATH resistance.
- Bullish Scenario: The ideal scenario would be a decisive breakout above the ATH resistance on high volume . The strongest confirmation would be a subsequent retest of this breakout level, where it acts as new support, followed by a bounce. This would validate the continuation of the uptrend, with a potential next target of ₹2,240 .
- Bearish Scenario: If the stock fails to sustain momentum and is rejected from the ATH resistance, it could pull back to test the lower boundary of its consolidation range, with the primary support level at ₹1,835 .
In conclusion, the focus is squarely on the all-time high. A confirmed breakout would signal that the bulls are ready to resume this stock's powerful long-term journey upwards.

Nestle India (D) - Breaks Out of Consolidation with ForceAfter a period of sideways consolidation following its September 2024 All-Time High, Nestle India has delivered a decisive breakout, signaling a potential resumption of its primary uptrend.
The Context: A Sideways Pause
Following a brief downtrend from its peak, the stock entered a sideways trading range. A key horizontal resistance level consistently capped any upward movement, keeping the stock in a state of consolidation.
Today's Decisive Breakout
Today's session (Thursday, October 16, 2025) decisively ended this sideways action in favor of the bulls:
- Strong Price Surge: The stock rallied by +4.52% .
- Confirmed Breakout: Crucially, the stock broke out and closed above the key resistance level , a strong positive signal.
- High Volume: The move was supported by a robust volume of 6.92 million shares , adding significant conviction to the breakout.
Broad-Based Technical Strength
This bullish price action is strongly supported by key momentum indicators across all major timeframes (Monthly, Weekly, and Daily). The short-term Exponential Moving Averages (EMAs) are in a positive crossover state, and the Relative Strength Index (RSI) is rising, indicating broad and strengthening momentum.
Outlook and Key Levels to Watch
With the breakout confirmed, the path of least resistance has shifted firmly upwards.
- Bullish Target: If the bullish momentum continues, the next logical area of resistance and potential price target is the ₹1,340 level.
- Critical Support & Confirmation: The former resistance level, around ₹1,241 , now becomes the most critical new support. Watching for the stock to successfully re-test this level and bounce with momentum would provide the strongest confirmation that this breakout is sustainable.
In conclusion, today's high-volume breakout is a powerful bullish event. The key now is for the price to remain above the ₹1,241 support level to validate the start of a new, sustained uptrend.

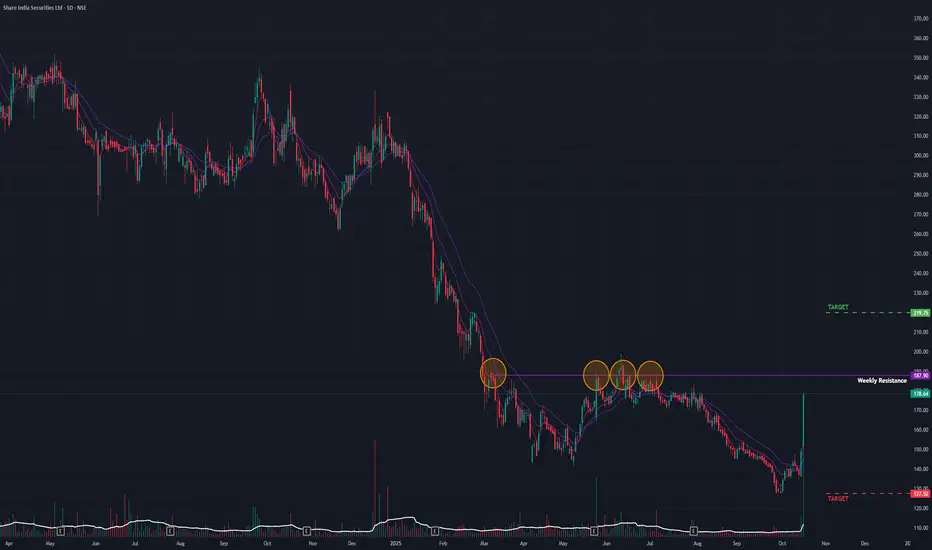
SHAREIND (D) - Explodes 31%, Now Challenges Major ResistanceShare India Securities has shown an incredible burst of strength over the past two sessions, signaling a potential trend reversal. However, this explosive rally has now run directly into a major historical resistance level, setting up a critical test for the bulls.
The Context: A Powerful Reversal Attempt
After a prolonged downtrend from its All-Time High in February 2024, the stock recently began showing signs of life by forming a series of Higher Lows . This subtle shift culminated in an explosive rally over the past two sessions:
- The stock has surged by a massive 31% in just two days.
- Today's session (Thursday, October 16, 2025) saw a gap-up opening and a +19.96% gain on huge volume of 10.5 million shares.
This powerful move has brought the price right up against a key horizontal resistance trendline — a level that has successfully rejected several rally attempts in the past, making it a significant hurdle.
A Nuanced Look at the Indicators
The technical indicators paint a picture of a new, but not yet fully confirmed, uptrend:
- Positives: The Relative Strength Index (RSI) is now rising across the Monthly, Weekly, and Daily timeframes, indicating a broad-based improvement in momentum. The short-term EMAs have also turned bullish on the Daily chart.
- Points of Caution: The short-term EMAs on the longer-term Weekly and Monthly charts have not yet registered a bullish crossover . This suggests that while the short-term trend has reversed, the long-term trend has not yet fully confirmed the move.
Outlook and Key Triggers to Watch
The immediate future of the stock depends entirely on the outcome of the battle at this key resistance.
- Bullish Breakout Scenario: A decisive close above the horizontal resistance on high volume would be a major victory for the bulls. It would confirm the trend reversal and could propel the stock towards the ₹220 level.
- Potential Rejection Scenario: If the stock is unable to breach this strong resistance, the rally may stall, leading to a pullback. In this case, the stock could retrace to the recent support level around ₹125 .
In conclusion, Share India is at a "prove it" moment. While the recent surge is incredibly powerful, it must now overcome a historically significant resistance level to prove that this is the start of a sustainable new uptrend and not just a sharp bear-market rally.
GOKULAGRO – A Strong Demand Zone Meets Classic Breakout Retest 📈 Market Insights 📈
In the world of price action, every rally and pullback leaves behind clues — and supply and demand zones are among the most telling. These zones are the footprints of institutions — areas where large players once entered or exited positions, creating visible imbalances on the chart. When price revisits these zones, it often reacts sharply, as unfilled orders get triggered once again.
🧩 Supply & Demand View 🧩
In the case of GOKULAGRO , we’re witnessing this principle in action. After a powerful rally that pushed the stock to fresh all-time highs, the inevitable profit-booking wave stepped in — giving birth to a clean supply zone near the top. This is where sellers briefly took control, pausing the bullish momentum and cooling off the rally.
Now, what’s particularly interesting is where the price has landed. It’s currently hovering around a strong demand zone — not just any support level, but the very origin of the rally that broke previous resistance barriers and fueled the stock’s breakout run. These areas are historically loaded with pending buy orders, and a return to them often sparks a renewed upward reaction.
Demand Zone Strength: Located at the base of a prior impulse move, signaling prior institutional buying.
Price Reaction Potential: Sharp reversals often emerge from such zones as demand reactivates.
Buyer Interest Area: This zone marks where large players previously entered the market aggressively.
🚀 Classical Chart View 🚀
From a traditional technical standpoint, the broader structure also paints a bullish narrative. The stock recently broke through a significant resistance level — a level that had previously capped price for weeks. The breakout was accompanied by a notable volume surge , suggesting strong conviction behind the move.
What’s unfolding now is a textbook example of “resistance turning into support.” As price revisits this breakout zone, selling pressure has notably declined — reflected in a visible drop in volume during the pullback. This reduced activity indicates that sellers are losing steam, and the correction might simply be a healthy retest rather than a reversal.
Old Resistance → New Support: A classic structural shift confirming bullish continuation.
Volume Behavior: Declining sell volume during the pullback suggests waning bearish momentum.
Zone Confluence: The overlap of the demand zone with this retested level strengthens the bullish setup.
✨ Final Takeaway ✨
Both analytical lenses — supply and demand as well as classical technical — align seamlessly here. GOKULAGRO has already found footing at a high-quality demand zone , one that previously launched a major impulse move. If buyers step in again from this region, the stock could well be gearing up for its next leg higher .
For those observing this setup, keeping a protective stop-loss below ₹162.5 could provide a sensible cushion beneath structural support.
💡 Risk Management Reminder 💡
Even the cleanest patterns can fail — that’s the reality of trading. What separates consistent traders from the rest is discipline . Always size your positions wisely and respect your stop-loss.
“The art of trading is not about being right all the time, but about losing less when you are wrong.”
🔄 Patience, consistency, and emotional control often beat bold predictions in the long run.🔄
Lastly, thank you for your support, your likes & comments. Feel free to ask if you have questions.
⚡ Keep learning, keep analyzing — because every chart tells a story! ⚡
This analysis is purely for educational purposes and should not be considered as trading or investment advice. I am not a SEBI-registered analyst.

Persistent (D) - Surges 7% But Stalls at Key ResistancePersistent Systems showed significant bullish intent today with a powerful, high-volume surge. However, it was ultimately rejected at a key resistance trendline, placing the stock at a critical juncture where a breakout is being fiercely contested.
The Consolidation Pattern: A Triangle
Since reaching its All-Time High (ATH) in December 2024, the stock has been consolidating within a large Triangle Pattern . The upper boundary of this pattern is a descending (angular) resistance trendline that has successfully capped all rally attempts so far.
Today's session (Wednesday, October 15, 2025) was a clear attempt to break this pattern:
- The stock opened with a gap-up and surged by as much as 7.24% .
- The move was supported by huge trading volume .
- Despite this strength, the stock failed to break out and closed below the angular resistance, indicating that sellers are still actively defending this level.
Underlying Bullish Momentum
While the breakout was unsuccessful today, the underlying technical picture remains strong and suggests the bulls may try again. Key momentum indicators, including the short-term Exponential Moving Averages (EMAs) and the Relative Strength Index (RSI), are in a bullish state across the Monthly, Weekly, and Daily timeframes. This indicates that strong momentum is building up just below the point of resistance.
Outlook and Key Levels to Watch
The stock is currently in a "coiled spring" scenario, with building pressure meeting strong resistance.
- Bullish Breakout Trigger: A decisive close above the angular resistance trendline on high volume is needed to confirm a breakout. This would signal a continuation of the uptrend with a potential next target of ₹6,225 .
- Potential Rejection Scenario: If the stock is again rejected from this resistance and is unable to sustain its momentum, it could pull back to find support. The most immediate and significant support level to watch in this case would be ₹5,205 .
In conclusion, the battle at this key trendline is the most critical event to watch in the coming days. The outcome will likely determine the stock's next major directional move.

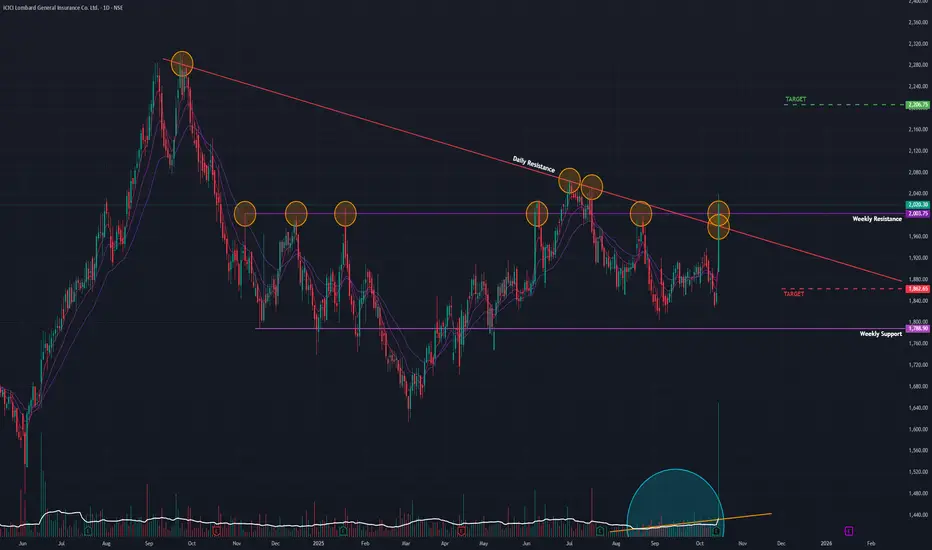
ICICIGI (D) - Powerful Dual-Resistance Breakout Signals UptrendICICI Lombard General Insurance has delivered a powerful bullish signal today, breaking out of a year-long consolidation phase by shattering two distinct resistance levels on massive volume. This decisive action suggests the sideways trend has ended and a new uptrend is likely beginning.
The Context: Consolidation After a New High
After registering its All-Time High (ATH) in September 2024, the stock entered a prolonged sideways consolidation. During this period, its price was capped by a confluence of two major resistance levels : a flat horizontal trendline and a descending angular trendline.
Today's Decisive Breakout
Today's session (Wednesday, October 15, 2025) decisively resolved this consolidation in favor of the bulls:
- Strong Price Surge: The stock rallied by an impressive +8.92% .
- Dual Resistance Breach: In a significant show of strength, the price broke out and closed above both the horizontal and the angular resistance lines.
- Massive Volume: The breakout was supported by huge trading volume , adding strong conviction to the move and indicating significant institutional interest.
This bullish move is further supported by the fact that volume has been gradually increasing over the last few days, suggesting accumulation was already underway.
Underlying Technical Strength
The bullish outlook is confirmed by key momentum indicators across all major timeframes (Monthly, Weekly, and Daily). The short-term Exponential Moving Averages (EMAs) are in a positive crossover state, and the Relative Strength Index (RSI) is rising, indicating broad-based strength.
Outlook and Key Levels
With the consolidation phase now broken, the path of least resistance has shifted upwards.
- Bullish Target: If this strong bullish trend continues, the next logical area of resistance and potential target is the ₹2,200 level.
- Key Support Level: The previous resistance zone, around ₹1,860 , is now expected to act as the new primary support. A failure to hold above this level on a pullback would be a cause for concern.
In conclusion, today's high-volume, dual-resistance breakout is a powerful technical event. The key now is to watch for follow-through buying or a successful retest of the ₹2,003 breakout zone to confirm the start of a sustained new uptrend.