Som distilleries- Can it make a new ATH?Som distilleries has retested a strong support zone and has formed strong bullish pattern in weekly time frame.
If bullishness continues, we can expect 2x returns from this stock in medium term.
Volume

Suryoday Bank- DO NOT MISS!Suryoday has given a good breakout of cup and handle pattern
A weekly closing above 200 can be a good signal that ATH levels can be seen soon.
Stock is available at a very good valuation.
I had seen such breakout in Spandana which had blasted after breakout.Expecting a similar move here.

INDUSTOWER BREAKING LONGTERM RESISTANCE Industower coming out from long term resistance
#target1 400
#target2 485 only after breaking 400
EDUCATIONAL IDEA

Stock Selection Based on ATH/52 Week Stock and Relative strengthHello community
Here I will be talking about the process for picking up the stocks based upon the All Time High (ATH)/52 Week BO Stock and RSI . As this is known to everyone but only few are getting benefited by applying it in real trading. The stock represents strength if it breaks its ATH Level and comes from Weekly BO Base. Most of the gains are made with the stocks breaking its ATH and Coming from Weekly Base BO and once it is combined with the RSI and Price Volume this can do wonders and improve trading style.
In my earlier write up i also talked about the use of RSI with Screener from Tradingview only. Since i used this as my repository so save all my write up here only and can be viewed.(Stock Selection Based on Relative StrengthEDUCATION)
Screener for Stock Selection in Trading View:-
- Go to Stock Screener Tab at bottom in the Tradingview.
- Go to Filters
- Symbol Type - Common Stock
- Select New 52 Week High-
- Select New All Time High
- Select Relative Strength Index (14) >=75
The above will filter out stocks based on ATH and 52 Week High stocks and RSI. You can add more filters according to your requirements and make your stock list more refine and Make a list and look for opportunities.
I use the above filter to filter out stocks every weekend and mix it with Price and Volume to get Maximum Benefit.
As I am a Price Action trader I mix Price/Volume,Trend and ride the momentum.
You can try it and submit your feedback to me. Also, Tell me if you find something else which can be useful to the community. Together we can help each other in Learning and excel in our profession.
Remember: I am a Price Action Trader and use Price and Volume together with different Timeframes, including RSI, and market conditions. To get the best result, always wait for confirmation. Focus on Risk Management and Position sizing.
Treat trading like a business and it will pay you like a business…..!!
Hope this post is helpful to community
Thanks
RastogiG
Disclaimer and Risk Warning.
I am not a Sebi registered analyst. The analysis and discussion provided on in.tradingview.com intended for educational purposes only and should not berelied upon for trading decisions. RastogiG is not an investment adviser andthe information provided here should not be taken as professional investmentadvice. Before buying or selling any investments, securities, or preciousmetals, it is recommended that you conduct your own due diligence. RastogiGdoes not share in your profits and will not take responsibility for any lossesyou may incur. So Please Consult your financial advisor before trading or investing.

Recent high breakoutGood volume build in daily time frame even though the whole index and sector was down.
Breakout of recent high with good volume, wait for retest conformation.
NOTE: i do my analysis, do your before trade.

CDSL RANGE BOX BREAKOUTCDSLbreaking a rectangle on WCB
with good volume building up
strong rsi also
EDUCATIONAL IDEA

3year old breakoutGood volume build in the past few candles in daily time frame.
All time high breakout with good volume than retested on the trendline, can give a good move if high sustains.
NOTE: i do my analysis, do your before trade.

All time high breakoutGood volume buildup in the past few candles both in daily and weekly timeframe.
All time high breakout with good volume, if breaks the high of current candle then good opportunity for long or else wait for retest conformation.
Price has taken support twice from 200EMA, good sign for bullishness.
NOTE: i do my analysis, do your before trade.

Channel patternGood volume build in daily and weekly time frame.
Price trading in between long range channel pattern, if breakout happens.
Then can give good returns.
NOTE: i do my analysis, do your before trade.

HINDCOPPER F&P BREAKOUT WCBHINDCOPPER breaking f&p pattern
on #weekly basis
good volume building up
#target 500 after breaking 400 only
EDUCATIONAL IDEA

Next candle will decide!!!Good volume build up on daily timeframe.
Price trading in the rising wedge pattern and almost at the resistance zone.
Next candle will be very important.
NOTE: i do my analysis, do your before trade.

Cup and handle breakoutGood volume buildup and daily and weekly timeframe.
Formed cup and handle and breakout conformed with good volume.
if breakout out sustains than will be looking very good return.
NOTE: i do my analysis, do yours before trade.

Capacite Infra Project Cmp 303 Rectangle BOCapacite Infra Project Cmp 303 dated 9-4-2024
Weekly Chart
1. Rounding & Rectangle Pattern Bo @ 305
2. Higher Lows
3. RSI Divergence
4. Volume Rise
Buy above 305 target 325-340-355-370-380-400-425 SL 240
Pattern Target 530 SL 210
It is just a view, Please trade at your own risk.

Box pattern breakoutGood volume buildup in daily and weekly timeframe.
Box pattern breakout and price trading in between raising wedge pattern.
NOTE: I do my analysis, do yours before trade.

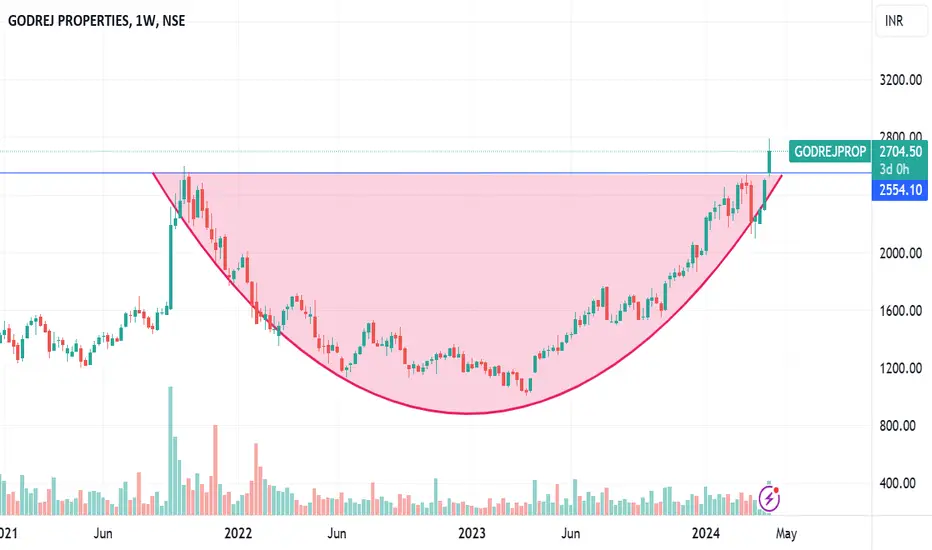
GODREJ PROPERTIES ROUNDING BOTTOM BREAKOUT Godrej properties breaking rounding bottom
good volume building up
#target can be 3800
follow ur sl as per ur risk management
EDUCATIONAL IDEA
SPARC-A spark of a bull run visible!SPARC is a loss making company, hence this is purely a technical pick.
Stock has given beautiful trendline breakout and is in consolidation since breakout.
Above 400, stock can fly to ATH.
Risky traders can enter at CMP for better risk reward.

SBILIFE TRENDLINE BREAKOUTSbilife breaking resistance trendline
with good volume building up
macd crossover seen
#target 1620 only after breaking 1570
EDUCATIONAL IDEA

Balkrishna Inds Cmp 2405 Triangle BOBalkrishna Inds Cmp 2405 dated 5-4-2024
1. Triangle BO @ 2380 (already done)
2. Higher Lows
3. Volume Rise
Buy @ Cmp target 2420-2465-2495-2550 SL 2340
It is just a view, please trade at your own risk.

For Zuari, Bullish view for next few weeksThe chart is making a rounding bottom and in the short time , following a parallel channel.

LIChsgfinance showing reversal signsHousing finance sector is looking very positive considering the tapering effects of recession and inflation data.
PNBHsg finance has already skyrocketed post breakout.
Lichsg finance is a good fundamental stock which is looking a good positional trade. This idea is not a recommendation and is shared only for educational purposes.
You can also study stocks like aptus hsg finance, ibull hsg finance, HUDCO which are showing similar trend.

BSE F&P BREAKOUT WCBBSE breaking f
BSE breaking f&p pattern #weekly basis
good volume building up
with strong rsi
EDUCATIONAL IDEA

MUTHOOT FINANCE C&H BREAKOUT WCBMuthoot finance breaking c&h pattern
weekly basis good volume and rsi
macd crossover
#target 1880 after breaking 1720 only
EDUCATIONAL IDEA

LICI TRENDLINE BREAKOUTLICI breaking a trendline resistance
good volume building up
good rsi and MACD crossover
#target 1170,use ur sl
EDUCATIONAL IDEA
