Motherson Sumi (Daily Timeframe) - A new ATH ??MSumi has broken out of a major resistance trendline today after couple of earlier attempts as indicated. The volume has been exceptionally high since last week. Today as well the volume was huge indicating buyer interest. Short-term EMAs are in PCO state indicating Bullishness. If the momentum continues, we may see the stock making new ATH. Few major resistances to be breached before it can achieve new ATH.
If the stock is able to sustain the momentum, then we may see 67 levels on the upside & if the trend reverses, we may see 40 levels on the downside.
Keep watching!!
Volume

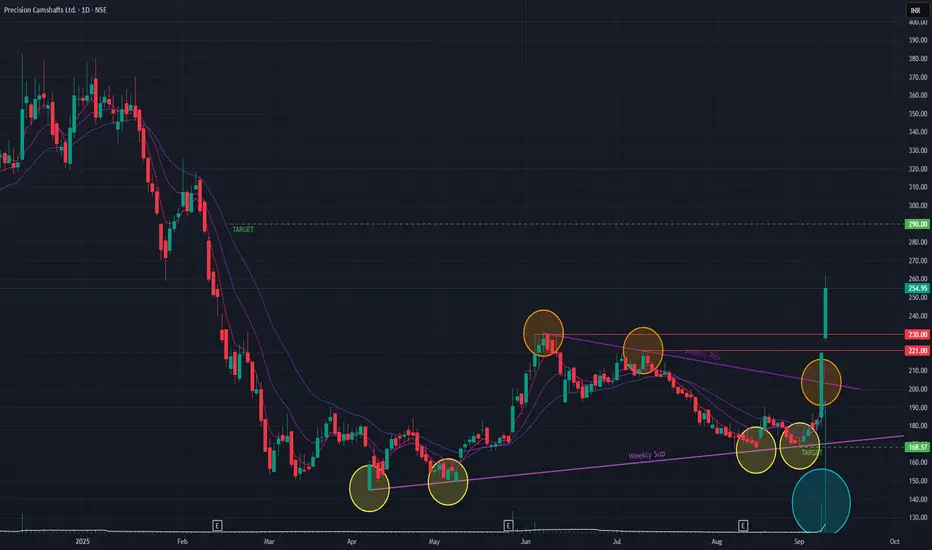
Precision Camshafts (Daily Timeframe) - Momentum Or NotPrecision Camshafts is on a bullish rally since yesterday, gaining +39.29%. Key observations to note are that since the ATH in Dec 2024, the stock was in a downtrend which has reversed since Apr 2025, as the stock been forming Higher Lows. and a Triangle pattern is formed as shown. Since the past two sessions, the stock is able to BreakOut of the Triangle pattern as well as BreakOut of the Daily resistance trendlines with huge volumes, showing buyer interest.
On an upside, if the momentum continues, we may see the stock go to 290 levels. If the stock is unable to sustain the momentum and goes down, we may see 168 levels.
Price-action in the coming days will dictate how the stock goes forward. Keep monitoring !!
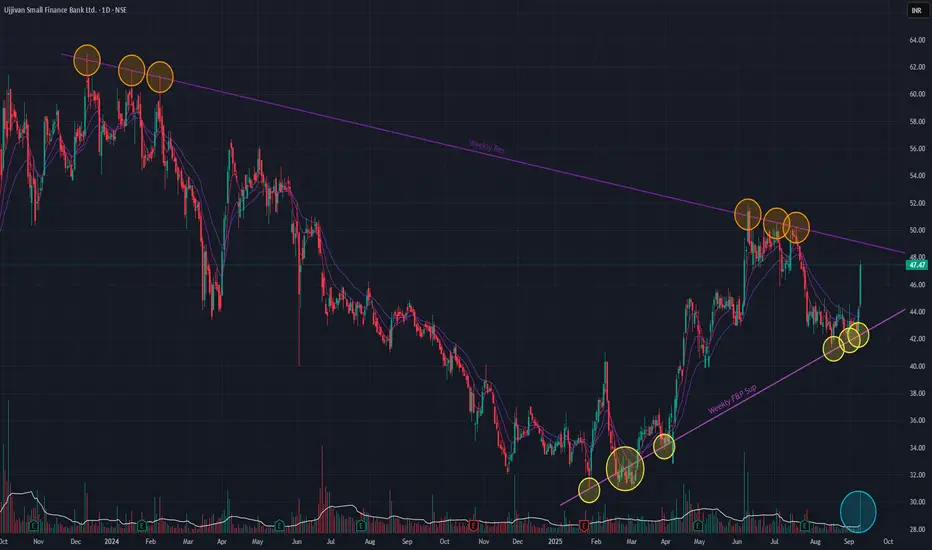
Ujjivan SFB (Daily Timeframe) - Potential BreakOut Candidate ??Ujjivan has been on a downtrend since making the ATH in Dec 2023. Since Feb 2025, there has been a reversal where the stock is making Higher Lows while respecting the support trendline. Since the ATH, the stock has attempted several occasions to BreakOut of the angular resistance trendline, but failed. The past two days there has been a surge in stock price accompanied by huge volume, showing bullishness. Short-term EMAs are also in a PCO state.
Let's wait for the stock to BreakOut of the resistance trendline. Keep monitoring!!
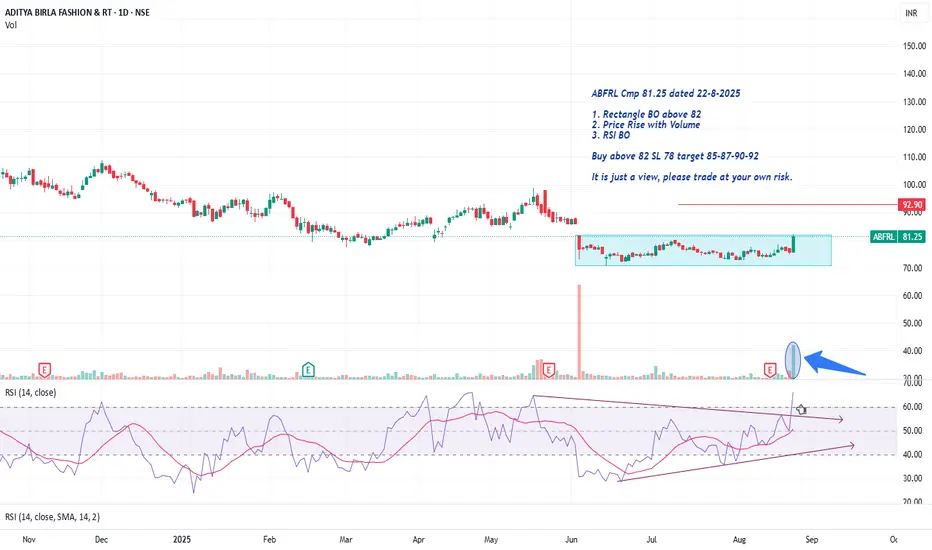
ABFRL Cmp 81.25 Price Rise with VolumeABFRL Cmp 81.25 dated 22-8-2025
1. Rectangle BO above 82
2. Price Rise with Volume
3. RSI BO
Buy above 82 SL 78 target 85-87-90-92
It is just a view, please trade at your own risk.
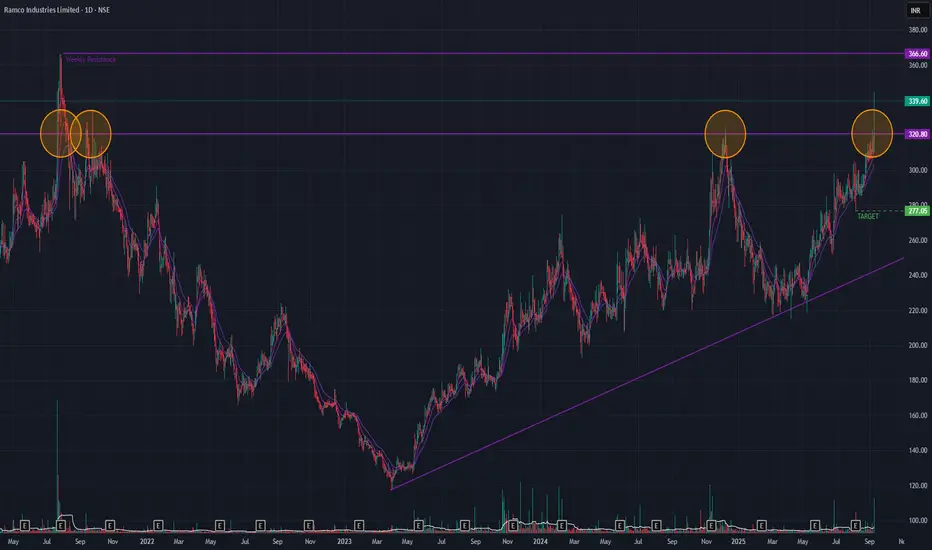
Ramco Ind (Daily Timeframe) - Is this a false BreakOut??Ramco BrokeOut of a multi-year resistance trendline (since 2000) today with huge volume and stock price zooming by 8.03%. The last time it BrokeOut of this trendline was in 2021 which did not sustain but the stock made a new ATH then. Short-term EMAs are in PCO state as well as EMAs & DMAs are in Golden Cross-over state.
On the upside the stock may reach 366 levels & on the downside the stock may reach 277 levels.
The price-action in the coming days will dictate how the stock moves. Keep monitoring.
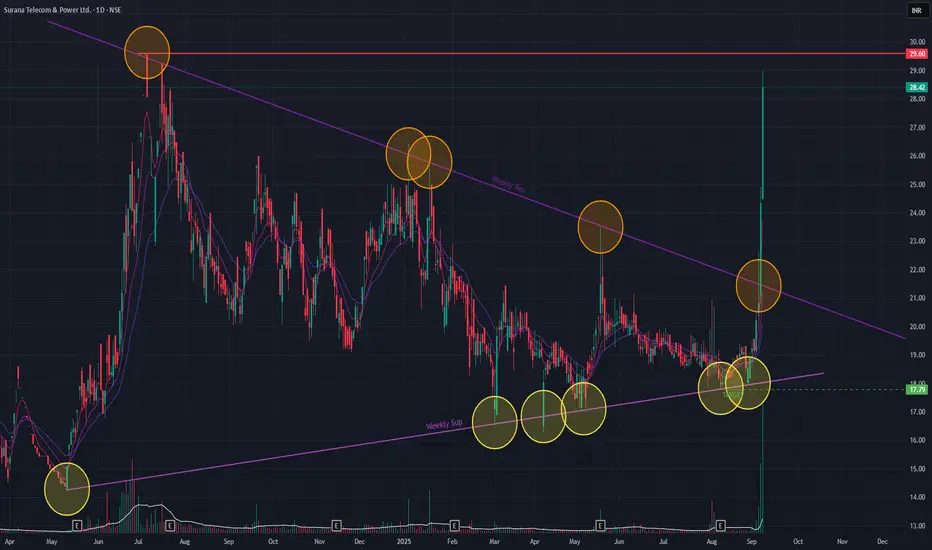
Surana T&P (Daily Timeframe) - Will it make new ATH?Surana has formed a Triangle formation which it Broke-Out last week confirming a bullish momentum. Short-term EMAs are in a PCO state. Today the stock opened Gap-up and formed a strong bullish candle (16.86%) with huge volume. A Golden Cross-over in both EMAs and DMAs may form in the coming days, which is a bullish signal, confirming the momentum.
On upside the stock may reach 37 levels if the momentum continues. If the stock is unable to sustain momentum, then we may see the levels of 17 on the downside.
Price-action is what we need to keep monitoring!!
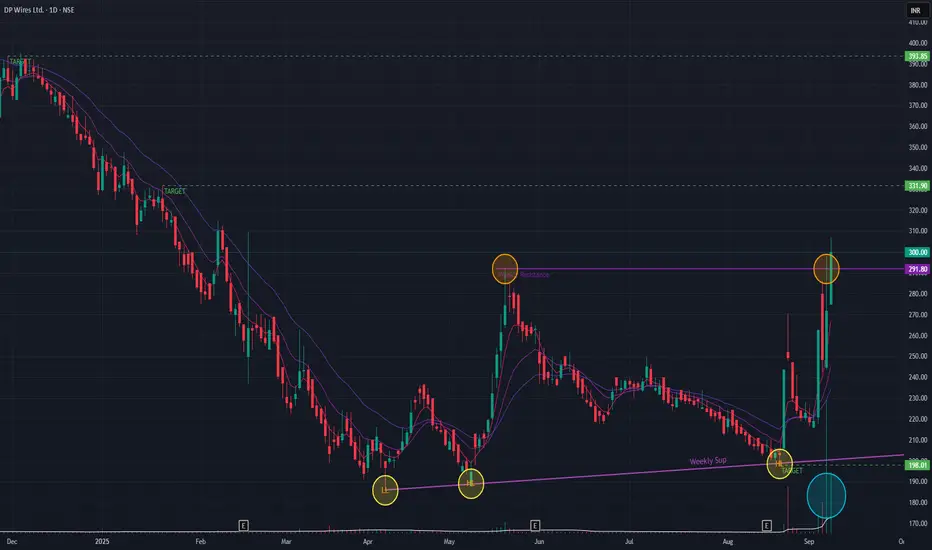
DP Wires (Daily Timeframe) - Can it sustain the momentum??DP Wires has been on a downtrend till Apr 2025 and ever since has been forming Higher Lows which is a bullish signal. Short-term EMAs are in PCO state. With today's bullish candle the stock has broken out of a key resistance trendline with huge volume spike.
The stock may reach 331 levels & thereafter 393 levels if the momentum continues on the upside. We could see levels of 198 if the stock reverses to the downside.
Keep monitoring the price-action!!
M&M FLAG PATTERN BREAKOUTM&M Breaking flag pattern on daily chart
with huge volume,good volume building last week
MACD crossover done
RSI bullish around 70
trading above 20 ema
target1 3600 target2 4000
retest level around 3300,sl 3050
DO YOUR OWN ANALYSIS BEFORE INVESTING

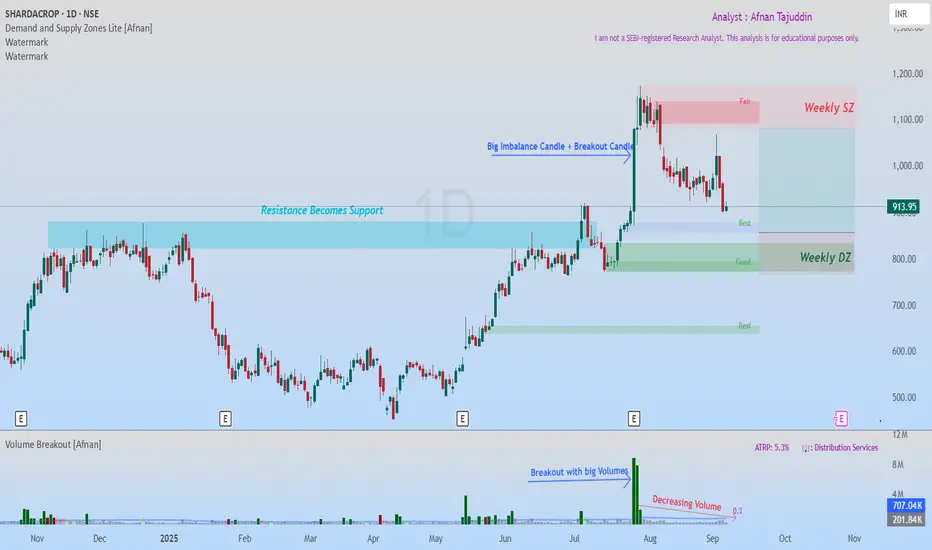
SHARDACROP: Smart Money Demand Zones Align with Classic BreakoutI've been tracking SHARDACROP, and what I'm seeing is honestly one of those setups that doesn't come around too often. There's something brewing here that caught my attention—and it's not just one signal, but two completely different analytical approaches pointing to the exact same conclusion.
Today, I'm breaking down this chart using the modern supply & demand approach that tracks institutional footprints, and the classic technical analysis. When these two methodologies start singing the same tune? That's when you know it's time to pay attention.
What makes this SHARDACROP setup special? Both methods are screaming the same message. And in my experience, that's usually when the big moves happen.
💡 Supply & Demand Analysis - Reading the Smart Money Trail 💡
Let's start with the supply and demand zones. Think of these as crime scenes—they're where the big players left their fingerprints. These aren't random levels; they're areas where massive institutional orders are sitting, waiting to be filled.
🎯 How the Big Players Play 🎯
Here's what most retail traders don't get: when institutions want to buy or sell millions of dollars worth of stock, they can't just hit the market buy button like we do. They'd move the price against themselves instantly. Instead, they layer in orders over time, creating these demand and supply zones.
So when price comes back to test a demand zone, we're betting that the same smart money players who were buying there before still have unfilled orders waiting. It's like they've set a trap—and price is walking right into it.
🔥 What Jumped Out at Me with SHARDACROP 🔥
Solid Weekly Foundation : There's a weekly demand zone that's been acting like a fortress
Stacked Daily Zones : Inside that weekly zone, we've got 1 daily demand zone and another demand zone is latest layered on top of each other.
Leg-out Candle Signature : That leg-out candle? Breaking to new highs, Pure smart money. The size of that imbalance tells me this wasn't retail traders getting excited
📈 The Setup That's Unfolding 📈
Now here's where it gets interesting. Price is drifting back toward our demand zone, and everything's lining up perfectly:
Entry Sweet Spot : Right within that established demand zone
Clean Risk Level : Stop goes below the zone—simple
Clear Target Path : Measured move up to the next supply zone
What I love about this risk-reward setup is the clean path to our 1:2.5 target. There's no major supply zone standing in our way, and the weekly trend is up.
⚡ Traditional Technical Analysis ⚡
Now let's flip the script and look at this through classic technical analysis. And you know what? The story gets even better.
🏗️ The Resistance That Finally Cracked 🏗️
This chart's telling a story I've seen a thousand times, but it never gets old:
The Struggle Phase : Price kept banging its head against the same resistance level, over and over
The Explosion : When it finally broke, it didn't just break—it demolished that level with a massive candle and huge volume
Volume Don't Lie : That breakout volume spike? That's confirmation the move was real
The Polarity Play : Now that old resistance is getting ready to flip into support—textbook price action
📊 Volume Tells the Real Story 📊
What really caught my eye is how volume's behaving on this pullback. As price drifts down toward our support zone, volume's drying up. That's not weakness—that's actually bullish. It means the selling pressure is fading, and when volume contracts like this during a retest, it often sets the stage for the next leg higher.
🎯 When Two Worlds Collide - The Confluence Magic 🎯
Here's where things get really exciting. I'm not just seeing one good setup—I'm seeing two completely different analytical methods pointing to the exact same opportunity:
Supply & Demand Says : Smart money demand zone with layered institutional support
Technical Analysis Says : Classic breakout retest with polarity support and volume confirmation
The Bottom Line : Both methods identify the same zone as the high-probability entry point
When this happens, I call it a "confluence setup." It's like having two different GPS systems both telling you to take the same route—you can be pretty confident you're heading in the right direction.
🌟 Putting It All Together 🌟
SHARDACROP's showing me: institutional footprints perfectly aligned with classic technical patterns. The Multiple Timeframe demand zones, the breakout retest setup, the volume behavior—it's all coming together in a way that makes me sit up and take notice.
But remember, even the best setups can fail. The market doesn't owe us anything, and it certainly doesn't care how confident we are. Trade smart, manage risk, and let the probabilities work in your favor over time.
💪 "The best traders aren't the ones who are right the most—they're the ones who make the most when they're right and lose the least when they're wrong." 📈
Disclaimer: This analysis is purely for educational purposes and isn't meant as trading or investment advice. I'm not a SEBI registered analyst. Always consult with qualified financial advisors before making investment decisions.
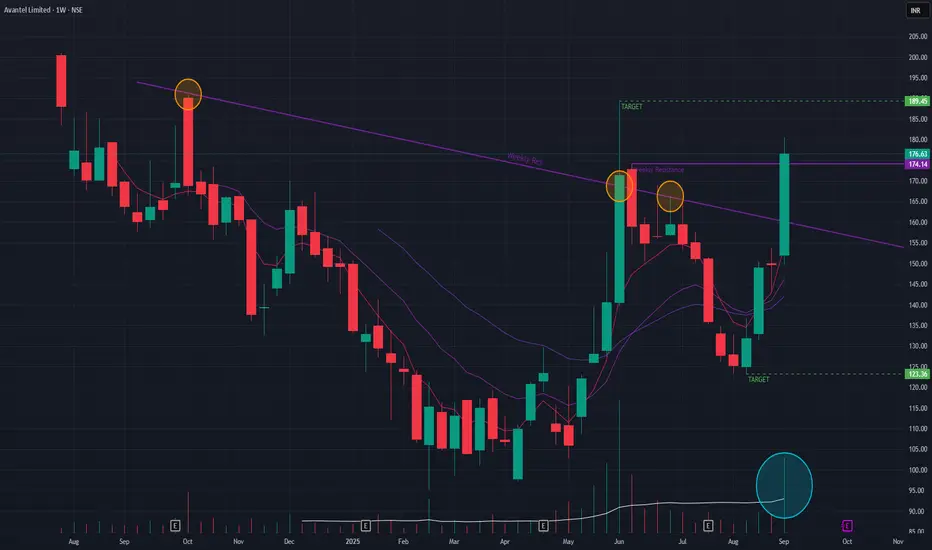
Avantel Ltd (Weekly Timeframe) - Can it sustain the BreakOut??Avantel has been on a downtrend since it's IPO. Since Apr 2025, the stock has been in an uptrend by forming Higher Lows. In the process the stock was able to BreakOut of a key angular resistance as well as a horizontal resistance with a 17.94% surge accompanied with exceptionally huge volume while the short-term EMAs are still in PCO state.
If the momentum continues with some good price-action during the coming week, we may see the stock reach 189 levels. On the downside, we may see the stock reach 123 levels.
Let's watch-out for the price-action during the coming week.
Carysil - Can it sustain the uptrend?Carysil BrokeOut of the horizontal resistance zone and also angular resistance zone with huge volume, last week. The stock surged by 11.59%. Short-term EMAs are still in PCO state which is showing a bullish trend.
With good quarterly earning, the stock may surge further and may reach 1048 levels & thereafter may make new ATHs if the price-action sustains. On the downside, we may see the levels of 768.
Watch-out for next week's price-action.

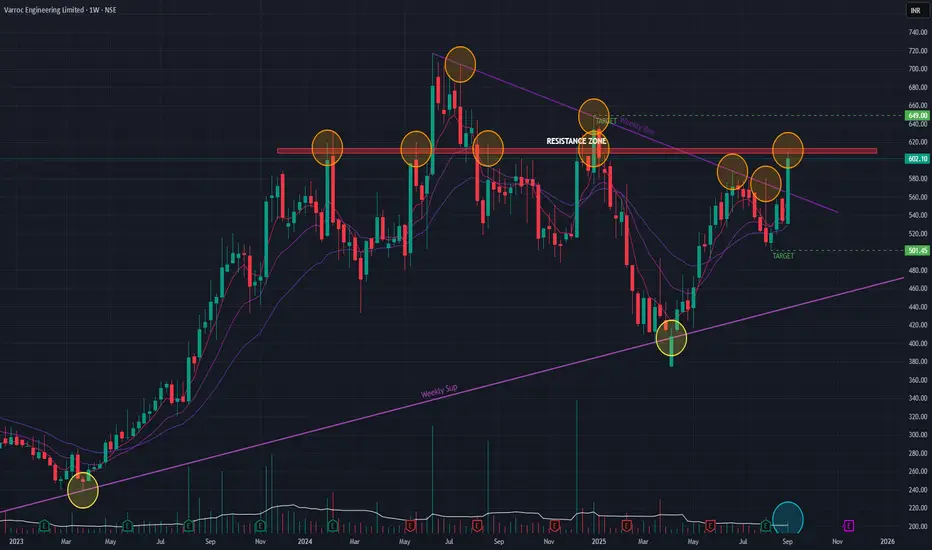
Varroc (Weekly Timeframe) - Potential BreakOut ??Varroc has been mostly in a sideways trend since Dec 2023. Key horizontal resistance zone was brokenout couple of times but that could not be sustained for long. Last week the stock surged by 12.68% with decent volume. With the surge it was able to breakout of a major angular resistance. Short-term EMAs are in PCO state as of last week.
If momentum continues, we may see the stock surge past the resistance zone and may reach 649 levels. On the downside, we may see the stock at 501 levels.
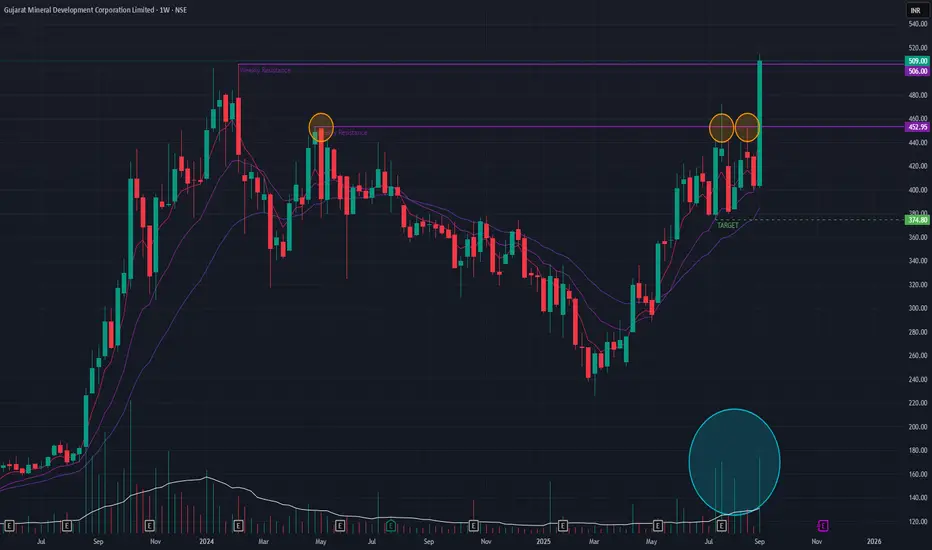
GMDC (Weekly Timeframe) - What next after ATHGMDC was in a short-term downtrend which reversed into an uptrend by Mar 2025. Past few weeks it tried to BreakOut of the horizontal key resistance trendline as indicated. Last week the stock surged by 26.04% with huge volume and made a new ATH. What can we expect after the new ATH, I would expect some profit booking in the coming week.
If the momentum sustains then we may see the stock surge to 640 levels on the upside. On downside, we may see 374 levels. All depending on the coming week's price-action.
To be watched !!
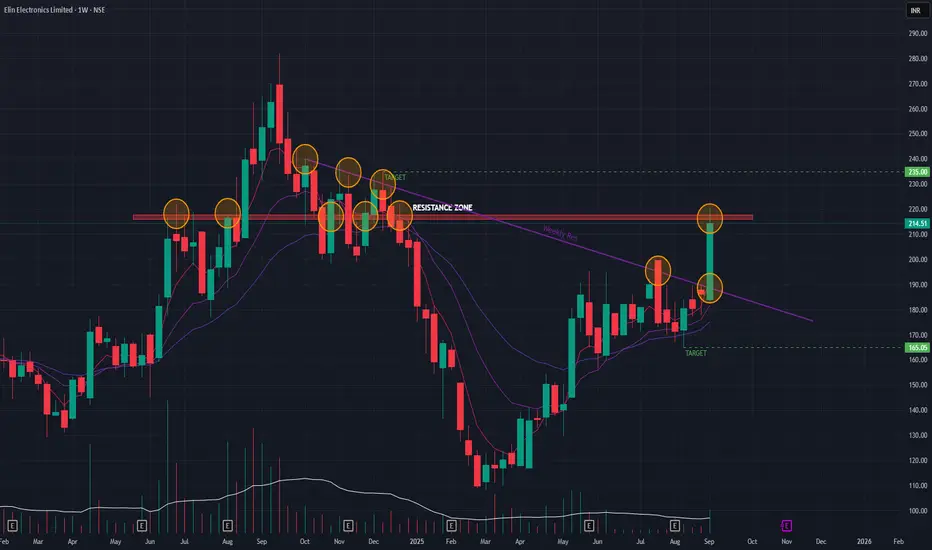
ELIN Electronics (Weekly Timeframe) - Potential BreakOut & ATH??ELIN was at an All-Time High (ATH) in Sept 2024, ever since it has been in a downtrend till Mar 2025. The stock has been on a bullish reversal since then and has broken out of a major angular resistance trendline after several attempts. Last week, it also BrokeOut of a major horizontal resistance zone. The stock surged by 15.19% with above-average volume. The Short-term EMAs are still in a Positive Cross-over state, signaling a bullish trend.
If the stock is able to sustain the uptrend during the coming week, then it may reach 235 levels & thereafter target new ATH. On the downside, it may reach 165 levels considering some profit booking.
Price-action is to be monitored!!!
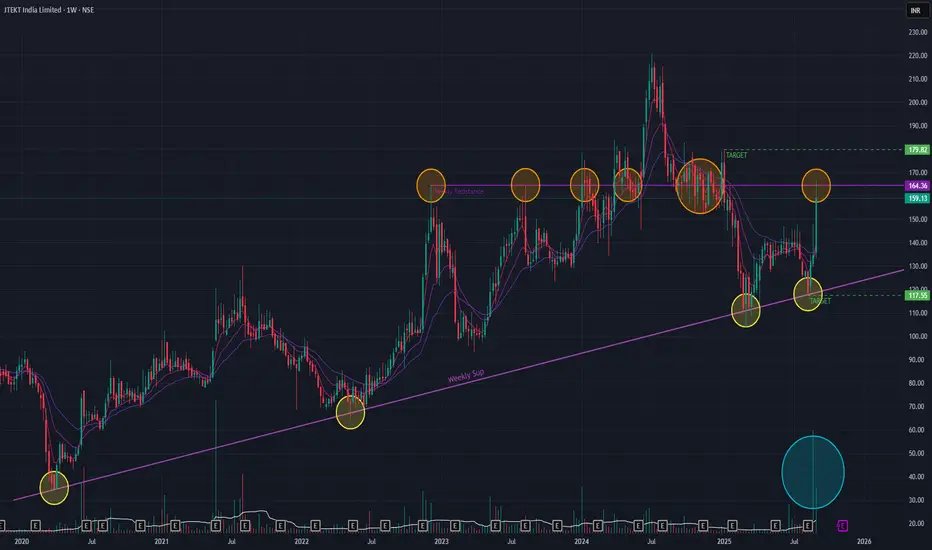
JTEKT India Ltd (Weekly Timeframe) - Potential ATH ??JTEKT is on an uptrend and have been respecting the support trendline as indicated. Since Dec 2022, the stock made several attempts to BreakOut of a major resistance zone and was successful once in Breaking Out and making an All Time High (ATH) in Jun 2024. As of last week the stock surged by 18+ % with huge volume. During this process the short-term EMAs did a positive cross-over. All of these are bullish signals.
During the coming week, if the stock is able to showcase bullish price-action then the stock may reach 179 levels. In a profit booking scenario, we may see the stock go down to 117 levels.
Keep watching for next week's price-action.
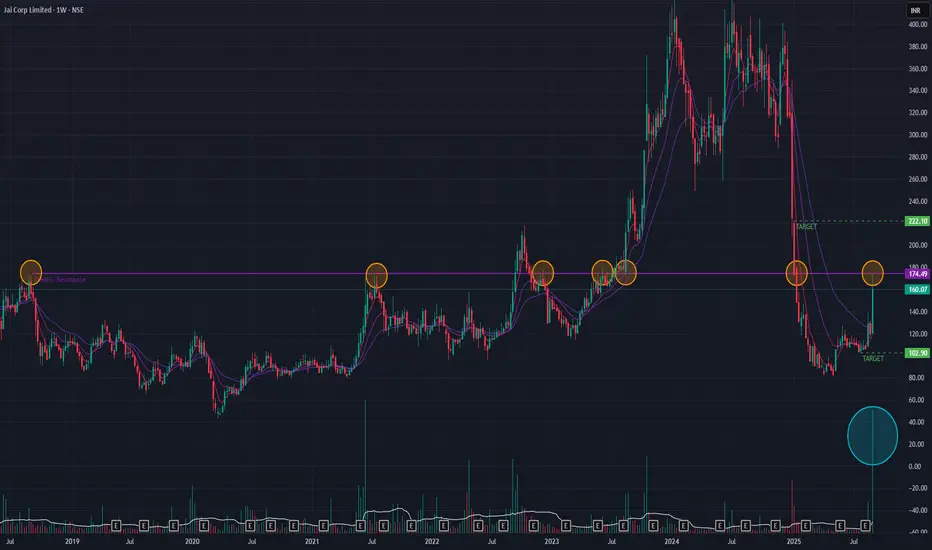
Jai Corp (Weekly Timeframe) - Is Jai on a bullish reversal?Overall the stock is in a sideways trend since 2009. The stock have been trying to Breakout of a major resistance but only succeeded once. Last week's stock spike accompanied with volume spike if sustained next week then it might be able to BreakOut of the resistance. The short-term EMAs are also in a Positive Cross-over state.
If the stock BreaksOut, then the upside target may be in the range of 222. If the stock is unable to BreakOut then on the downside we may expect it to go down to 102 range.
Keep monitoring the price-action during next week!!
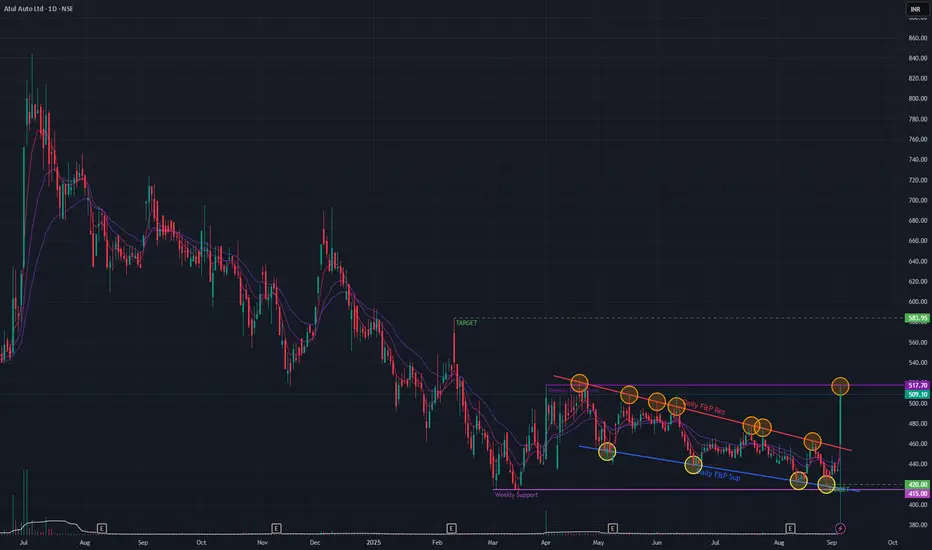
Atul Auto (Daily Timeframe) - Is it the Bullish reversal ??Atul Auto has been in a downtrend since the All Time High. Resistance & Support trendlines in the recent past has been respected well as marked. Today the stock BrokeOut of the angular trendline with a 17% spike and huge volume spurt. Currently the stock is encountering a key resistance.
Overall the stock is in a downtrend but a bullish divergence can be seen along with short-term EMAs in positive cross-over state. Till further positive price action, a bullish trend may not be foreseen.
If the stock moves in an uptrend then we might see the levels of 583 & in case of a downtrend we might see the levels of 420.
Keep monitoring!!
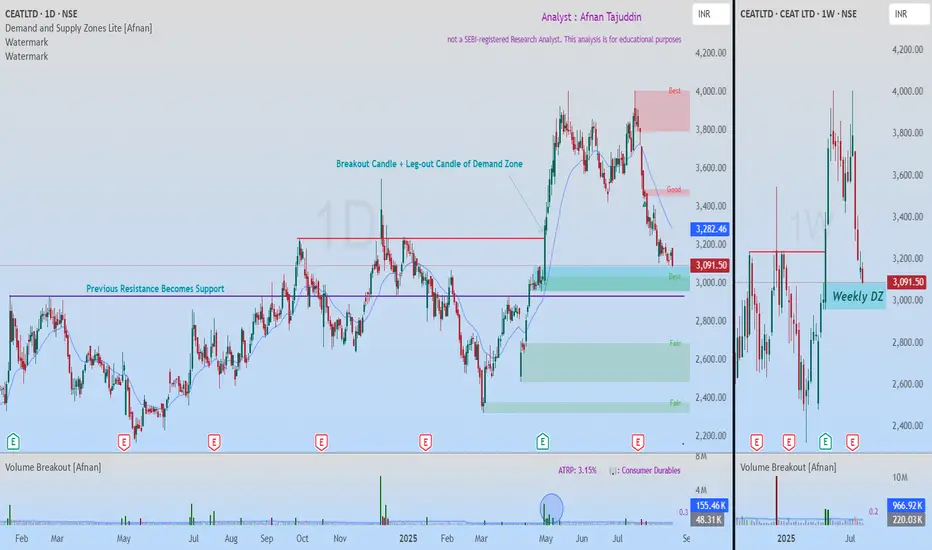
Smart Money Footprint Visible: Ceat Testing Powerful Demand ZoneBack on 24th July , I shared an idea on Ceat. That call didn’t play out and the Stop Loss (SL) got hit . No surprises there—SLs are simply the cost of doing business in this market. hitting SL is part of trading . The key is discipline – once SL is hit, we must exit without hesitation.
Now, Ceat seems to be offering us another opportunity . Let’s break it down.
📊 Why This Demand Zone Stands Out
The stock is approaching a very strong demand zone visible clearly on the weekly & Daily timeframe .
The leg-out candle that created this demand zone was powerful – it broke past previous resistance with a strong bullish move .
Follow-through from that breakout candle even took the stock to all-time highs . This tells us it’s not just an ordinary zone but one with institutional footprints.
Institutions often leave behind pending buy orders in such zones, or they may look to accumulate more here to defend their earlier positions.
This level first acted as resistance , then flipped into support —a classic price-action rotation.
📉 Volume Behavior 📉
On the breakout candle, volume was massive. But now, as price is pulling back, we can see volume exhaustion . To me, that signals a lack of real selling pressure. When supply dries up, it leaves the door open for demand to kick back in.
🔎 Confluences Adding Strength 🔎
Weekly demand zone lining up with a daily demand zone .
Traditional support level overlapping at the same price area.
Volume analysis confirming lack of strong selling.
🎯 Trading Plan 🎯
SL should be placed just below the support level to manage risk.
First target should be the nearest supply zone .
Till first target, the Risk-to-Reward (RR) ratio is about 1:3 , which makes it attractive.
If SL gets hit, simply exit the trade . No second thoughts.
What I find compelling here is the overlap: weekly demand, daily demand, and a long-tested support line all converging. That kind of alignment doesn’t come around every day. The probability of a bounce looks strong—but at the end of the day, risk management is what separates setups from disasters .
“Trading is not about being right every time. It’s about managing risk smartly and surviving long enough to catch the big moves.”
💡 The market will always offer another opportunity—our job is to stay disciplined, manage risk, and be ready when it comes. 🚀📈
⚠️ This analysis is purely for educational purposes only and is not a trading or investment recommendation . I am not a SEBI registered analyst .
Coal India – Breakout or Fakeout at Key Resistance?Chart Context
Coal India has been stuck inside a descending channel, completing what looks like a W–X–Y corrective structure. The recent surge has now brought price face-to-face with the MA100 and MA200 , both acting as strong resistances.
What the Chart Shows
MA100 & MA200: Price is testing these moving averages. Sustained strength above this zone is needed to confirm a real breakout.
Volume: A noticeable spike has supported the latest move, which adds credibility to the attempt.
RSI: Momentum has crossed above 50, shifting the bias, but confirmation requires follow-through.
Neutral Stance
At this stage, the setup can go either way. A clean breakout and hold above the MAs could mark the start of a fresh impulse. Failure to sustain would make this just another bounce inside the corrective structure.
Takeaway
It’s a wait-and-watch situation. Let the next few sessions decide whether this is the start of a new trend — or just a fake breakout.
Disclaimer: This analysis is for educational purposes only and does not constitute investment advice. Please do your own research (DYOR) before making any trading decisions.

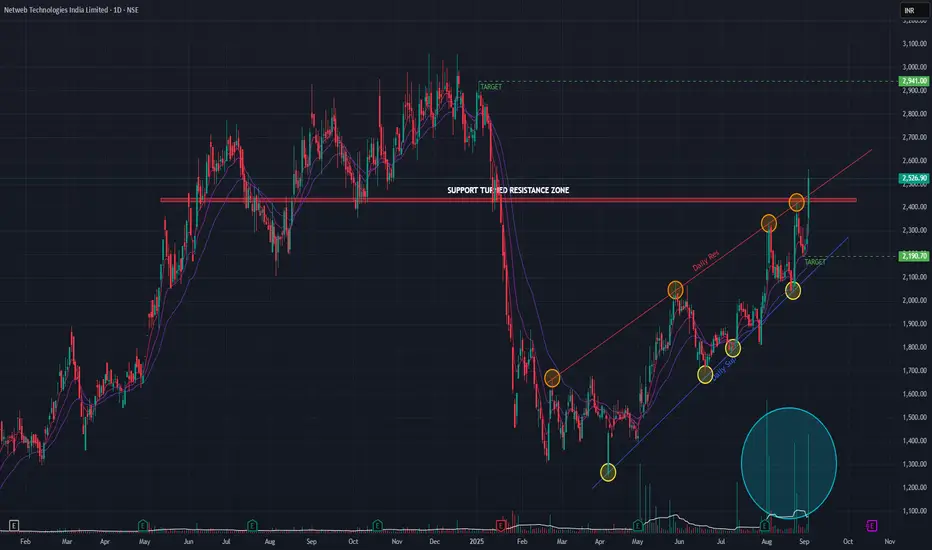
Netweb Tech (Daily Timeframe) - bullish signs ??Netweb has been on an uptrend since Feb 2025 and today it breached a key support turned resistance zone with huge volume. With a +11.48% gain combined with huge volume, the stock also breached the angular resistance trendline as indicated. Short-term EMAs are in positive cross-over state indicating bullish signs.
The recent quarter earnings are also positive for the stock.
If the uptrend momentum continues, then we may see the stock go upto 2940 range. On the downside it may go to 2190 range. The price action on the coming days would be key.
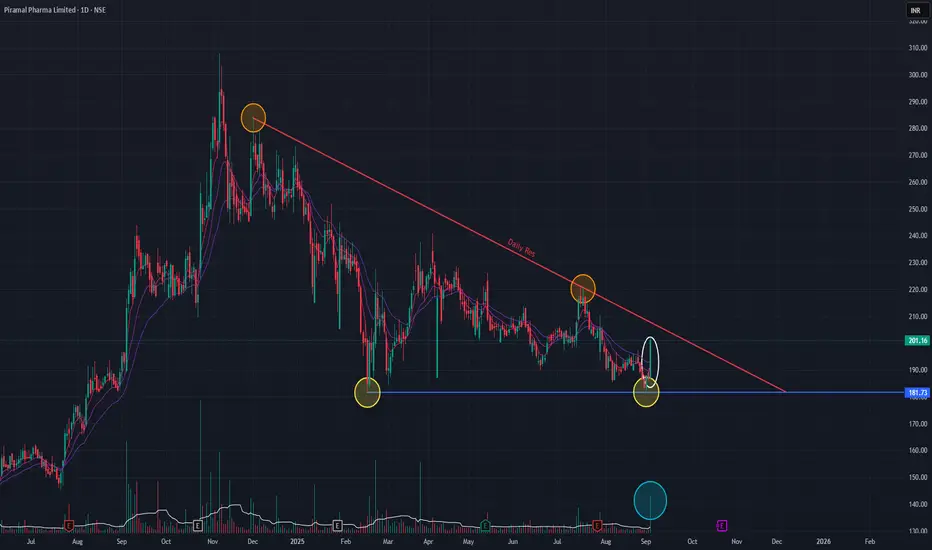
Piramal Pharma (Daily Timeframe) - Potential BreakOutPiramal Pharma, has formed a Double-Bottom chart pattern, indicating Bullish reversal. With today's bullish candle the volume has also spiked. We should watch out for the price action in the coming days. As indicated in the chart, resistance trendline is respected as well as the support trendline. If the stock has to move up, then it has to breach the resistance trendline.
Let's keep a watch on it.
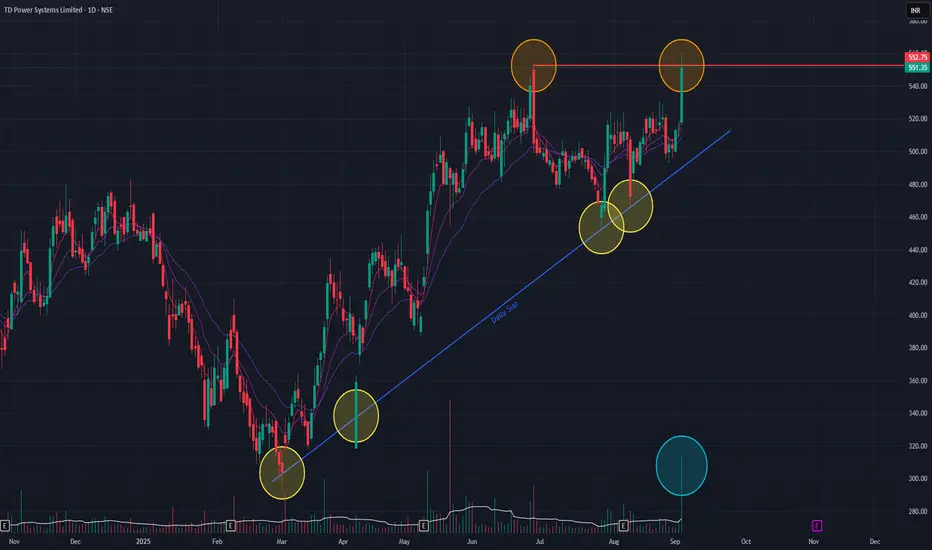
TD Power Systems (Daily Timeframe) - Can it make new ATH ??TD Power made a new All Time High today with huge volume. With that last bullish candle, on daily timeframe, we observe a Double-Top which is a bearish chart pattern. The angular support trendline has been respected as indicated. Short-term EMAs are in positive cross-over state, which is an obvious scenario during Double-Top formation.
We should observe how the price action plays out in the coming days to decide on the possible targets, both upside and downside.
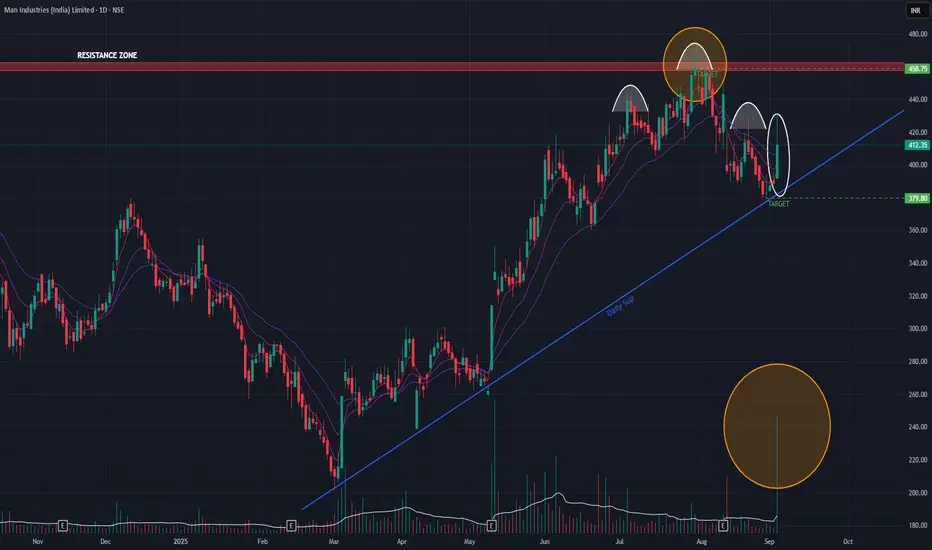
Man Industries (Daily Timeframe) - Upside or Downside??Man industries has been on an uptrend since March 03, 2025 and it tried to BreakOut of the key resistance zone, but invain. Today the stock gained 6% with huge volume. Since March 03, 2025, the stock has been respecting the angular support trendline while making Higher Lows. If we observe carefully, an H&S pattern is formed at the top which indicates a bearish trend. Short-term EMAs are also in Negative Cross-over state.
If the stock gains momentum on the upside, then it may rise to the range of 458. On the downside, the stock may reach the immediate support of 379.
To monitor.