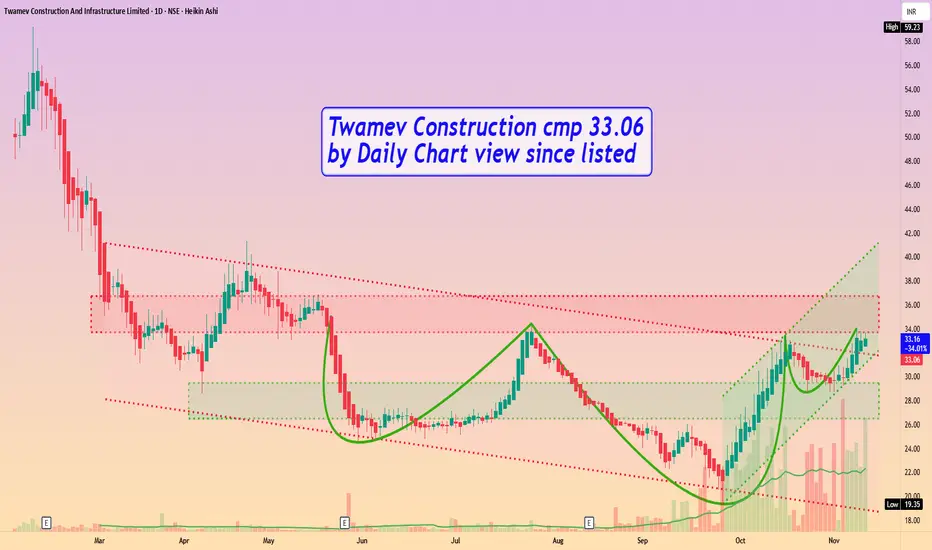
Twamev Construction cmp 33.06 by Daily Chart view since listedTwamev Construction cmp 33.06 by Daily Chart view since listed
- Support Zone 26.50 to 29.50 Price Band
- Resistance Zone 33.75 to 36.75 Price Band
- Back to back Bullish Rounding Bottom patterns
- Strong Uptrend momentum seen with Rising Price Channel
- Falling Price Channel Breakout done by the demand based buying
- Heavy Volumes enabled Breakout attempts observed from Resistance Zone
Volumesurge
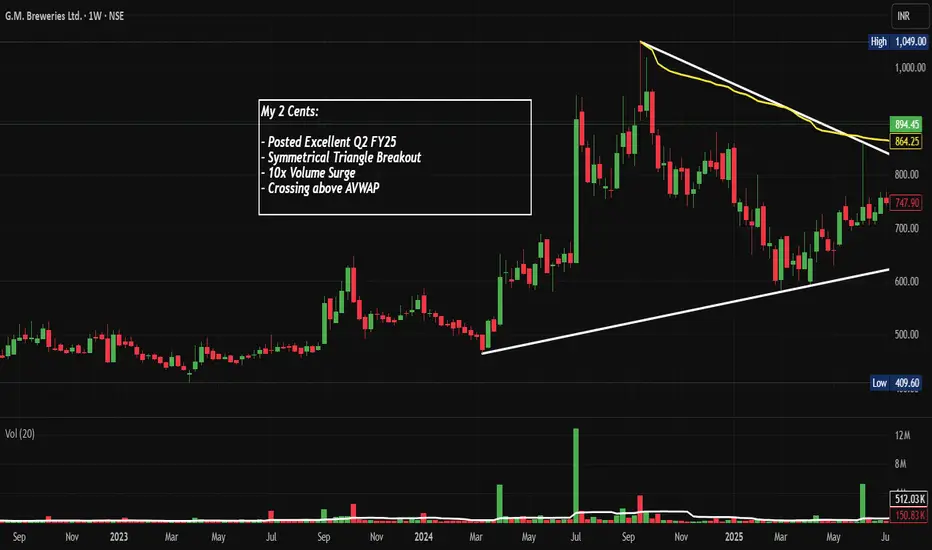
GMBREW: Broke Out Post Q2 FY26 with 10x Vol, Chart of the WeekA Small-Cap Brewery Stock NSE:GMBREW Broke Out With 10x Volume and Posted 61% Profit Growth in Q2 FY26. Let's Analyse in the "Chart of the Week"
As per the Latest SEBI Mandate, this isn't a Trading/Investment RECOMMENDATION nor for Educational Purposes; it is just for Informational purposes only. The chart data used is 3 Months old, as Showing Live Chart Data is not allowed according to the New SEBI Mandate.
Disclaimer: "I am not a SEBI REGISTERED RESEARCH ANALYST AND INVESTMENT ADVISER."
This analysis is intended solely for informational purposes and should not be interpreted as financial advice. It is advisable to consult a qualified financial advisor or conduct thorough research before making investment decisions.
Price Action Analysis:
Trend Structure:
- The stock has been trading in a well-defined ascending triangle pattern from March 2023 to September 2025
- Lower trendline support starts around 500 levels and has been holding consistently
- Upper resistance formed a symmetrical descending trendline from the August 2024 peak near 1,049
- The consolidation phase between 650-750 lasted approximately 12-14 months, indicating strong accumulation
Recent Breakout Dynamics:
- On October 9, 2025, the stock witnessed a powerful breakout above the descending resistance trendline
- The breakout candle closed at 894.45, representing a gain of 22% in a Week
- Price crossed above the Volume Weighted Average Price (VWAP) with conviction
- The breakout occurred exactly at the apex of the symmetrical triangle, a textbook technical setup
Base Formation:
- A solid base was formed between 650-750 levels from June 2024 to September 2025
- This 15-month consolidation created a strong platform for the next leg up
- The base shows higher lows, indicating persistent buying interest
- Multiple tests of the 700 level without breaking down confirmed strong institutional support
Volume Spread Analysis:
Volume Surge Characteristics:
- The breakout day witnessed volume of 11.88 million shares, representing approximately 10x the average Weekly volume
- Prior peak volume was recorded in July 2024 at around 11 million shares during a similar rally
- The volume spike confirms genuine institutional participation rather than retail speculation
- Volume during the consolidation phase remained subdued, typical of healthy base-building
Volume-Price Correlation:
- The recent volume expansion coincided with the Q2 FY25 earnings announcement
- Volume preceded the price breakout, suggesting informed accumulation
- Absence of distribution volume during the decline from 1,049 to 650 indicates strong hands holding positions
Support and Resistance Levels:
Key Support Zones:
- Immediate support: 850-860 (breakout point and previous resistance turned support)
- Secondary support: 780-800 (VWAP zone)
- Major support: 700-720 (top of the consolidation base)
- Critical support: 650 (lower boundary of the triangle pattern)
Key Resistance Levels:
- Immediate resistance: 900-920 (psychological level and minor supply zone)
- Major resistance: 1,000-1,049 (previous 52-week high from August 2024)
- Extended resistance: 1,150-1,200 (measured move from triangle breakout)
- Long-term resistance: 1,300-1,350 (Fibonacci extension based on prior rally)
Technical Pattern Recognition:
Symmetrical Triangle Breakout:
- The pattern took 18 months to form, indicating a significant accumulation phase
- Pattern reliability is high, given the strong volume confirmation
- The apex breakout timing increases the probability of follow-through momentum
Volume Price Analysis (VPA):
- The breakout exhibits classic VPA characteristics: rising prices on expanding volume
- No signs of climactic selling during the base formation
- Professional money accumulation is evident from the volume footprint
- Current setup suggests continuation rather than exhaustion
Sectoral Backdrop and Industry Analysis:
Indian Alcohol Sector Overview:
- The Indian alcohol market is estimated at USD 60.11 billion in 2025 and expected to reach USD 101.10 billion by 2032, exhibiting a CAGR of 7.7%
- India's growing middle class is becoming more affluent, driving increased alcohol consumption as disposable incomes rise
- India's total alcoholic beverage sector is the world's third largest, with yearly sales of $44 billion
- In India, beverage alcohol volumes rose 4% in the first half of 2024, driven by strong demand for premium-plus spirits
Growth Drivers:
- Premiumization trend as consumers upgrade to higher-quality spirits and beer
- Expanding retail distribution channels, including modern trade and e-commerce
- Rising disposable incomes and urbanization are creating a larger addressable market
- Changing social attitudes toward moderate alcohol consumption, especially among younger demographics
- Tourism and hospitality sector recovery post-pandemic, boosting on-premise consumption
Sector Risks and Challenges:
- Heavy regulatory environment with varying state-level policies on alcohol sales
- High taxation is impacting margins and affordability
- Licensing complexities and distribution restrictions in certain states
- Raw material price volatility affecting input costs
- Social stigma and health concerns are potentially limiting market expansion
Fundamental Analysis:
Recent Financial Performance:
- In Q2 FY26, net profit rose 61% year-on-year, with revenue growing 20% to ₹718 crore, while EBITDA margin expanded to 6.25% from 4.62%
- For H1 FY26, total revenue reached ₹1,356 crore, marking 13% growth, with net profit rising 30% to ₹61 crore
- Margins saw healthy growth at 24.9% compared to 18.9% last year
- The strong Q2 results were the primary catalyst for the recent breakout
Company Fundamentals:
- Market capitalization stands at approximately 2,042 crore with annual revenue of 679 crore and profit of 143 crore
- Promoter holding is strong at 74.4%, indicating management confidence
- The company has delivered moderate sales growth of 6.32% over the past five years
- GM Breweries operates with no debt and demonstrates good profit growth
Valuation Metrics:
- As of October 9, 2025, GM Breweries is trading at a discount of 16% based on median intrinsic value estimates
- The stock trades in the small-cap segment with relatively lower liquidity compared to large-cap peers
- Recent earnings surprise has likely re-rated the stock, but valuation remains reasonable relative to growth
- P/E multiple expansion likely as margins improve and profitability accelerates
Competitive Positioning:
- Compared to industry leaders, GM Breweries lacks strong brand value and has limited market coverage
- The company operates primarily in select states, providing regional focus but limiting nationwide presence
- Opportunity exists to expand distribution footprint and invest in brand building
- Focus on operational efficiency and margin expansion differentiates from competitors
Bull Case Arguments:
- Strong earnings momentum with 61% profit growth, indicating operational leverage
- Technical breakout from 18-month base supported by exceptional volume confirms institutional interest
- Favourable industry tailwinds with 7.7% sector CAGR supporting long-term growth
- Debt-free balance sheet provides financial flexibility for expansion
- High promoter holding at 74.4% aligns management interests with shareholders
- Current valuation at 16% discount to intrinsic value offers a margin of safety
Bear Case Considerations:
- Limited brand recognition compared to established industry players
- Restricted geographic presence limits growth potential
- Heavy regulatory oversight and taxation pose ongoing challenges
- Small-cap liquidity concerns may lead to higher volatility
- Dependence on discretionary consumer spending makes business cyclical
- Historical revenue growth of 6.32% over five years is modest
Monitoring and Review Parameters:
Key Metrics to Track:
- Quarterly revenue and profit growth rates versus expectations
- Margin expansion, sustainability and operating leverage
- Volume growth in key markets and product categories
- Market share gains or losses relative to competitors
- Any changes in promoter holding or institutional ownership patterns
Technical Review Points:
- Weekly closing price relative to the breakout level of 850
- Volume sustainability above 3-4 million shares daily average
- Formation of higher highs and higher lows to confirm an uptrend
- Any breakdown below 780 would invalidate the bullish thesis
- RSI and momentum indicators for early signs of exhaustion
Risk Triggers:
- Fundamental: Any quarterly earnings miss or margin compression
- Technical: Weekly close below 780 or breach of major support zones
- Sectoral: Adverse regulatory changes or significant tax increases
- Market: Broader market correction below key support levels affecting risk appetite
- Time-based: If the stock underperforms the sector or broader market for two consecutive quarters
Full Coverage on my Newsletter this Week
Keep in the Watchlist and DOYR.
NO RECO. For Buy/Sell.
📌Thank you for exploring my idea! I hope you found it valuable.
🙏FOLLOW for more
👍BOOST if you found it useful.
✍️COMMENT below with your views.
Meanwhile, check out my other stock ideas on the right side until this trade is activated. I would love your feedback.
As per the Latest SEBI Mandate, this isn't a Trading/Investment RECOMMENDATION nor for Educational Purposes; it is just for Informational purposes only. The chart data used is 3 Months old, as Showing Live Chart Data is not allowed according to the New SEBI Mandate.
Disclaimer: "I am not a SEBI REGISTERED RESEARCH ANALYST AND INVESTMENT ADVISER."
This analysis is intended solely for informational purposes and should not be interpreted as financial advice. It is advisable to consult a qualified financial advisor or conduct thorough research before making investment decisions.
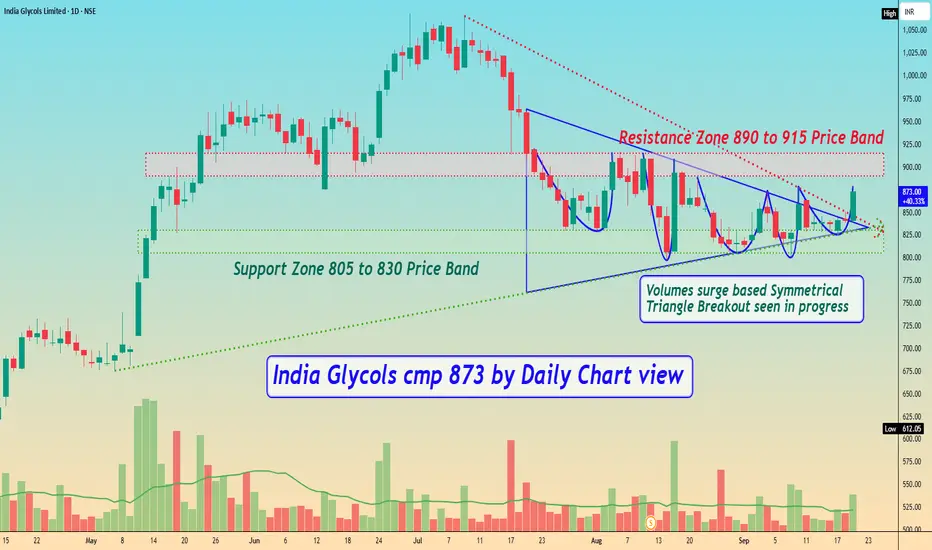
India Glycols cmp 873 by Daily Chart viewIndia Glycols cmp 873 by Daily Chart view
- Support Zone 805 to 830 Price Band
- Resistance Zone 890 to 915 Price Band
- Volumes surge based Symmetrical Triangle Breakout seen in progress
- Volumes in close sync with the average traded quantity over past few days
- Multiple Bullish Rounding Bottoms made around Support Zone for probable breakout
- Resistance Zone playing strongly since mid of July 2025 basis repeated price rise rejection
WCIL - H&S Pattern | Breakout Above Resistance | Daily Chart📊 WCIL – Breakout Above Resistance | RSI Bullish | Strong Volume | Fibonacci Levels | Daily Chart
📅 Chart Date: June 27, 2025
📈 CMP: ₹114.43 (+3.42%)
📍 Ticker: NSE:WCIL
🔍 Technical Analysis Summary
🔺 Breakout From Trendline & Resistance
WCIL has broken out above horizontal resistance at ₹113.50 and long-term descending trendline, indicating strong bullish momentum
Golden neckline breakout of a potential inverse head & shoulder / V-recovery formation
📊 Volume Spike
Massive increase in volume (7.09M) confirms buying interest and validates the breakout
📈 RSI Indicator (14, Close)
RSI at 70.85, trending upward and entering bullish territory
Multiple Bullish RSI crossover signals provide confluence for the uptrend
🌀 Fibonacci Retracement Levels
38.2% – ₹107.94
50.0% – ₹121.13 (next key level)
61.8% – ₹134.31
100% – ₹177.00 (full retracement potential)
📍 Key Price Levels
✅ Breakout Zone: ₹113.50
🔼 Immediate Resistance: ₹121.13
🎯 Target Levels: ₹121 → ₹134 → ₹153+
🛡️ Support Levels: ₹107.9 → ₹100 → ₹91
💡 Trade Idea
Entry: Above ₹114 on confirmation with volume
SL: Below ₹107.50 (close below previous resistance)
Targets: ₹121 → ₹134 → ₹153
Risk-Reward: High conviction due to structure and volume
⚠️ Disclaimer
This chart analysis is for educational purposes only. Always DYOR (Do Your Own Research) and consult a financial advisor before making investment decisions.

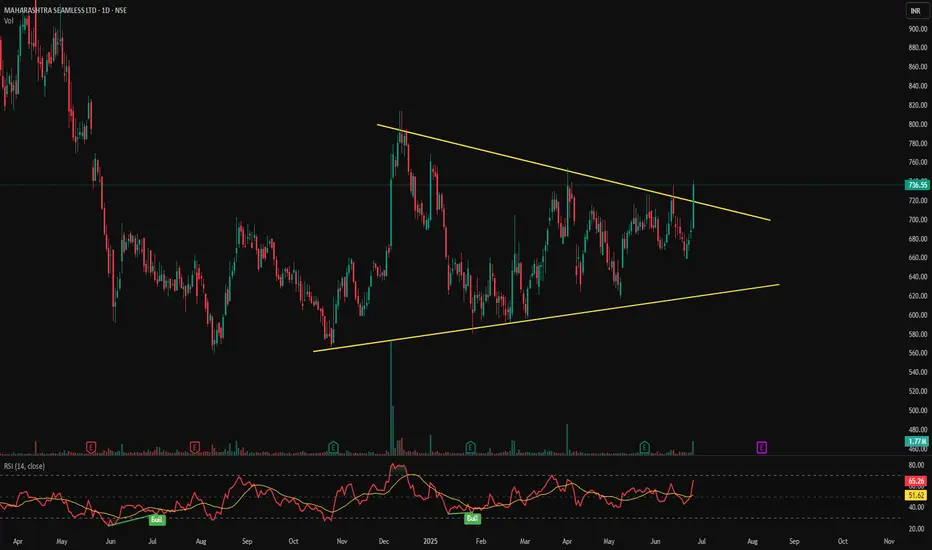
MAHSEAMLES - Symmetrical Triangle Breakout📊 MAHSEAMLES – Symmetrical Triangle Breakout | RSI Bullish | Volume Surge | Daily Timeframe
📅 Chart Date: June 26, 2025
📈 CMP: ₹736.55 (+7.20%)
📍 Ticker: NSE:MAHSEAMLES
🔍 Technical Analysis Overview
🔺 Symmetrical Triangle Breakout
After months of consolidation within a symmetrical triangle pattern, MAHSEAMLES has broken out with a strong bullish candle
Breakout level: Above ₹725, confirmed with strong price momentum
Breakout marks potential trend reversal and beginning of new bullish phase
📊 Volume
Volume spike to 1.77M, significantly higher than recent average – validates breakout strength
📈 RSI Indicator (14)
RSI at 65.26, trending upwards – bullish zone
Previous RSI Bullish signals noted at key turning points, providing confluence
📍 Key Technical Levels
✅ Breakout Level: ₹725
🚀 Potential Upside Targets (based on pattern height projection):
₹770
₹800
₹840+
🛡️ Support Zones:
₹700 (retest zone)
₹670 (lower trendline support)
₹635 (triangle base)
💡 Trade Setup Idea
Entry: On breakout close above ₹725 with confirmation
Stop Loss: Below ₹695 (just under triangle resistance)
Targets: ₹770 → ₹800 → ₹840+
Risk-Reward: Favorable with pattern breakout and rising momentum
⚠️ Disclaimer
This chart analysis is for educational purposes only. Always DYOR (Do Your Own Research) and consult a financial advisor before making investment decisions.
LongTerm Support Reversal with Volume Surge in Bayer CropscienceHello everyone! I hope you all are doing well in your life and trading journey. Today I’m sharing a positional setup on Bayer Cropscience Ltd , which has given a strong bounce from a key long-term support zone. A massive volume spike confirms a potential trend reversal, indicating smart money may be accumulating at current levels. This setup offers a great opportunity for medium to long-term investors with a favorable risk-reward ratio.
The fundamentals of the company are equally strong, backed by Bayer AG with zero debt, healthy ROCE, and consistent performance in India’s agrochemical space. I’m eyeing an entry range of 5450–5750 , with a stop loss at 4630 . Upside targets stand at 6730 , 7799 and 9200 . Let’s track this breakout closely for further confirmation.
Disclaimer: This analysis is for educational purposes only. Please consult a financial advisor before making any investment decisions.
If you found this helpful, don’t forget to like, share , and drop your thoughts in the comments below.

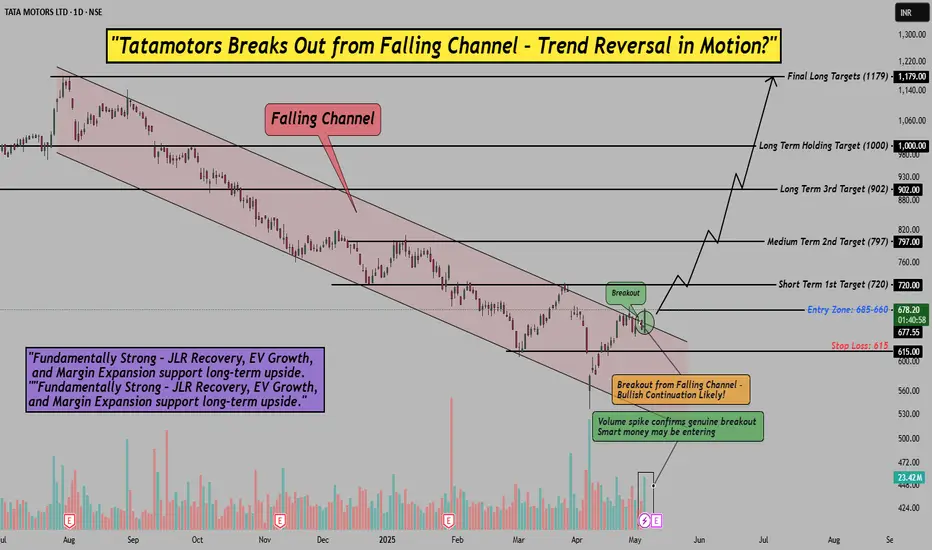
Tata Motors Breakout from Falling Channel – Trend Reversal SetupHello everyone i hope you all will be doing good in your life and your trading as well. Today i have brought a stock name Tata Motors which has broken out of a falling channel after a long consolidation period, and it looks like a potential trend reversal is in motion. The volume surge confirms a genuine breakout, indicating that smart money may be entering at this level. This is an exciting opportunity for both short and long-term traders.
The stock’s fundamentals remain strong , with JLR recovery , EV growth , and margin expansion supporting the long-term upside potential. I’m eyeing an entry range of 685-660 , with a stop loss at 615.00 . Let’s monitor this breakout closely and watch for further confirmation.
Disclaimer: This analysis is for educational purposes only. Please consult a financial advisor before making investment decisions.
If you found this helpful? Don’t forget to like, share, and drop your thoughts in the comments below.
Ideaforge: Bullish Trend Ahead Amid India-Pakistan Tensions?Hey Everyone! Ideaforge just broke out from a double bottom chart Pattern Neckline , and it looks like a potential trend reversal is in motion. With the breakout confirmed by a volume surge , it seems that smart money might be entering, which is a positive sign for the stock. The technical setup is strong, but let’s dive deeper into the fundamentals to get a clearer picture.
While Ideaforge faces challenges like limited profitability in the past, its future outlook looks promising. The company holds a strong position in India’s drone industry, and 92% of its revenue comes from defense contracts, making it heavily reliant on government spending. Recent developments like drones being used in India-Pakistan border tensions have brought Ideaforge’s technology to the forefront, creating a positive sentiment shift in the market. This real-time application in national security could significantly boost its future growth, especially with the rise in demand for advanced drone technology in defense.
For entry, Stop loss and Target check Chart above!
Disclaimer: This analysis is for educational purposes only. Please consult a financial advisor before making investment decisions.
If you found this helpful, don’t forget to like, share, and drop your thoughts in the comments below!

Bearish Setup in Gold: Breakdown Confirmed with Strong Volume!Hey, what's up Traders! I’ve been watching Gold closely, and it seems like we’re seeing a descending channel setup. After hitting the top, it’s now testing the lower boundary. If Gold can't hold this support level, we could see a nice downward move. The entry range I’m eyeing is around 3275-3295 , with a stop loss just above at 3239 .
1st target : 3209
2nd target : 3160
Final target : 3120
The volume behind this move suggests we might see more selling pressure. If Gold breaks through the lower trendline, the downside move could gather more momentum. As always, let’s manage risk carefully, stay sharp, and watch the price action closely!
Disclaimer: This analysis is for educational purposes only. Please consult a financial advisor before making investment decisions.
If you found this helpful? Don’t forget to like, share, and drop your thoughts in the comments below.

Sky Gold’s Breakout: Falling Wedge Pattern Points to Big Upside!Hello everyone, i hope you all will be doing good in your life and your trading as well. Today i have brought a stock name with Sky Gold & Diamonds and it is showing a promising Falling Wedge pattern, and with the breakout above the upper boundary, it’s signaling a potential bullish move ahead. The breakout is supported by a volume surge, which suggests smart money may be entering, reflecting strong market interest. This could be the start of a solid rally.
On the fundamental side, Sky Gold has been performing well, with a 51% YoY revenue growth and a 117% jump in net profit for FY2024. The company maintains a solid ROE of 24%, with a manageable debt-to-equity ratio of 1.25, showing strong financial health and good prospects moving forward.
For this trade, 351-340 is a good entry range, with a 296 stop loss. I’m targeting 426 , 483 , and the final target of 553 . This setup offers strong upside potential, but as always, make sure to manage your risk and keep an eye on the price action. Let’s see how this one plays out!
Disclaimer: This analysis is for educational purposes only. Please consult a financial advisor before making investment decisions.
If you Found this helpful? Don’t forget to like, share, and drop your thoughts in the comments below.

Nandan Denim (NDL) : (Positional Trading : upto 1 Year)#NDL #roundingbottom #patterntrading #chartpattern
NDL :
>> Initial position for 1-3 Months then keep building positions upto 1 Year
>> Keep Buying on Every Dip
Key Fundamentals :
>> Piotroski score : 9
>> Low PE Stock
>> Growing Fundamentals
>> Keep eyes on 2-3 Quarter Results
Key Technicals :
>> Trending Setup
>> Rounding Bottom Formation on Weekly charts
>> Volumes Buiding up
>> Good Strength in stock
>> Massive Upside Potential
Swing Traders can lock 10% profit & keep trailing
Please give a Boost or comment if u r Liking the analysis & Learning from it. Keep showing ur Love by following
Disclaimer : This is not a Trade Recommendations & Charts/ stocks Mentioned are for Learning/Educational Purpose. Do your Own Analysis before Taking positions.

PIDILITIND | Cup & Handle Breakout 🎯⭕ Swing Trading opportunity ! 1hrs Chart Alert !!!⭕
-- Buy above=1751 or CMP
--Target = 1796 | 1838
--Stop-loss = 1726
--R:R =3.43
-- Lot size = 500
--Expected Profit = 43k ( 5% )
--Expected Holding = 10 days only
#ThankU For Checking Out Our Content , We Hope U Liked IT 📌
======================================================
⭕Technical Reasons to trade or Strategy applied :- ⭕
1) Stock has formed cup & handle pattern
2) Breakout was strong & retested the trendline again
3) Trendline resistance is already broken
4) Target is based on resistance areas
5) bullish engulfing candle as well
Guys Check out the related ideas as well, it will work really well GUARANTEED !
🙏FOLLOW for more !
👍LIKE if think is useful !
✍COMMENT Below your view !

Rain Industries | Breakout | Ready to move upsideThe stock is currently moving in a parallel channel forming a bit of rising wedge on a weekly chart.
The current price trend has been nicely supported by volume trend as well,
The stock has breached the multiple time resistance of 148.30 with higher than average volume indicating a positive signal. And now is moving towards its short term targets of TG1 - 159.35 and TG2 - 177.30, with a long term view at 229.10 .
The past support & resistance trendline depiciting the targets are very much alingned with the Fibonacci retracement to have a stronger conviction.
CMP - 151.90
TG1 - 159.35 (4.9%)
TG2 - 177.30 (16.7%)
Long term Target - 229.10 (50.8%) ; Long term stop loss - 129.45 (-14.78%)
Risk : Reward Ratio --> 1:3.4
The Analysis is done completely based on personal knowledge and to share with others for educational purpose.
It isn't any sort of recommendation. Please consult your financial advisor before any investment related decision.

Suntv | Circular Support & resistance 🎯⭕ Positional Trading opportunity ! Weekly Chart Alert !!! ⭕
--Buy Above =468.80 or CMP
--Target = 561.70 | 644.25
--Stop-loss = 420.95
--Lot Size = 1500
--R:R =3.67
--Expected Profit = 2,60,000+₹ per lot ( 37% )
--Expected Holding = 1-3 Months only
#ThankU For Checking Out Our Content , We Hope U Liked IT 📌
======================================================
⭕ Technical Reasons to trade or Strategy applied :- ⭕
1) Tried to find the circular support
2) Volume is too good
3) following a perfect price action
4) fundamentals are good as of now
Guys check out the related ideas as well, it will work really well GUARANTEED !
🙏FOLLOW for more !
👍LIKE if think is useful !
✍COMMENT Below your view !

Reliance | breakdown the support Alert Alert !! Follow the chart guys
Either short now or wait for retracement
lot size = 500
CMP = 1912
Guys check out the related ideas as well
FOLLOW for more !
LIKE if think is useful !
COMMENT Below your view !

Axisbank | Two Trendline break with volume at the same time !swing trading opportunity
Two Trendline break at the same time with big volume
CMP = 488
Target = 456
stoploss= 524
lot size = 1200
Guys check out the related ideas as well
FOLLOW for more !
LIKE if think is useful !
COMMENT Below your view !
