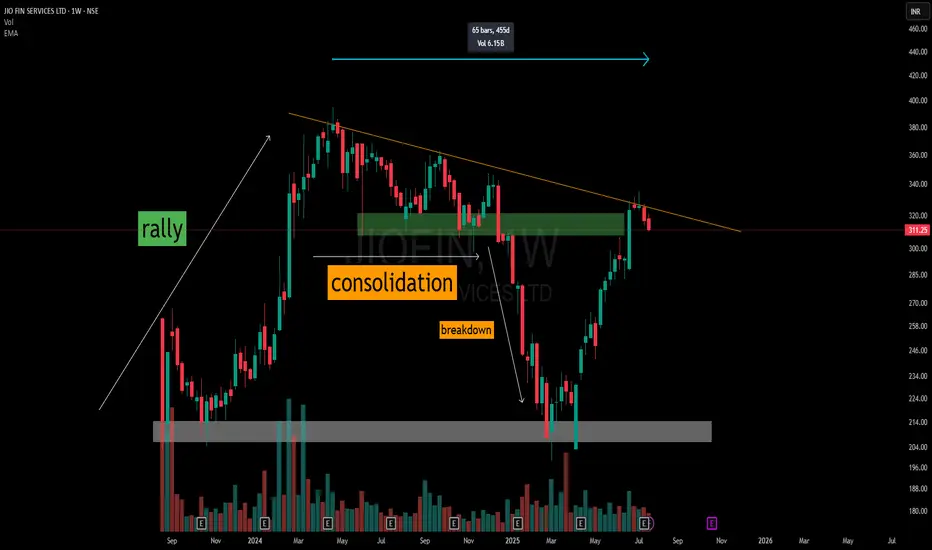
455-Day Counter Trendline | From Breakdown to V-RecoveryThis weekly chart of Jio Fin Services Ltd illustrates a multi-phase price structure over 455 days:
🔹 Initial Rally — Kicks off from a defined accumulation base (grey zone), marking the start of a strong impulse leg.
🔹 Consolidation Phase — Price enters a descending triangle formation just below a historical resistance band.
🔹 Breakdown — Clean breakdown from the triangle pattern sends price sharply downward.
🔹 V-Shaped Recovery — A strong reaction off the original base zone leads to a sharp reversal.
🔹 Back to the 455-Day Counter Trendline — Price now tests the long-standing counter trendline, which has remained intact throughout.
📌 This chart demonstrates how historical price structures—especially well-defined base formations and trendline resistances—continue to act as critical reference points for future price action.
🛠️ No predictions here. Just a structured breakdown of price behavior and major decision zones traders are often drawn to.
Vshape
Minda Corporation Trade Setup For TomorrowAs you can see in the chart, Minda Corporation done the v shape recovery and after some consolidation.
.
Stock has made a strong green candle now for tomorrow,
.
If stock goes above 158, you can buy this trade for the target of 162.
.
Note: Be cautious if market is negative, avoid the trade.


AMARA RAJA Trade SetupThis Analysis Is Done Only For Educational & Intelligence Purpose, Invest Or Trade At your Own Risk & Will.

granules india v- shape recovery more action ahead !look promising in this kind of volatile market . not corrected too much in past big down fall And recover promptly .
also Pharma sector look promising in upcoming period . so i long ! with Stop loss of 160.

Bandhan Bank V Shape reversal possibleBandhan bank is showing potential of a V shape reversal pattern on Daily and 4Hourly chart. Can expect a retracement upto 200-210 level and the continuation from there towards upward direction.
