HFCL BY KRS CHARTS17th September 2025 / 9:21 AM
Why HFCL?
1. First of all, its second time it's in my radar, previously we had more than 40% Return on this one and still long-term Target has been still loading 225 Rs.
2. 1M TF is making Higher High with current price level previously it breaks from flag pattern and gave upside move.
3. As we cand see in chart i have mentioned FVG range for 1M tf which was expected fall to be fill that FVG and it did.
4. Further, along with FVG filling 1W & 1D tfs is showing bullish divergence within range.
5. Volume is above avg with Morning Star Candle Breakout showing more bullish signs.
SL & Target is mentioned ‼️
** Attached Previous View on HFCL also go check it out**
W-bottom

BUY TODAY SELL TOMORROW for 5%DON’T HAVE TIME TO MANAGE YOUR TRADES?
- Take BTST trades at 3:25 pm every day
- Try to exit by taking 4-7% profit of each trade
- SL can also be maintained as closing below the low of the breakout candle
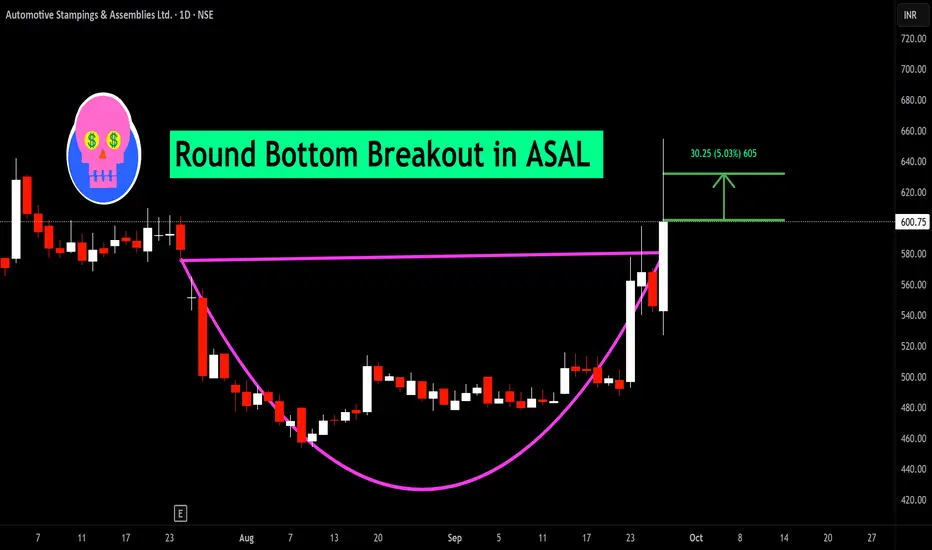
Now, why do I prefer BTST over swing trades? The primary reason is that I have observed that 90% of the stocks give most of the movement in just 1-2 days and the rest of the time they either consolidate or fall
Round Bottom Breakout in ASAL
BUY TODAY SELL TOMORROW for 5%
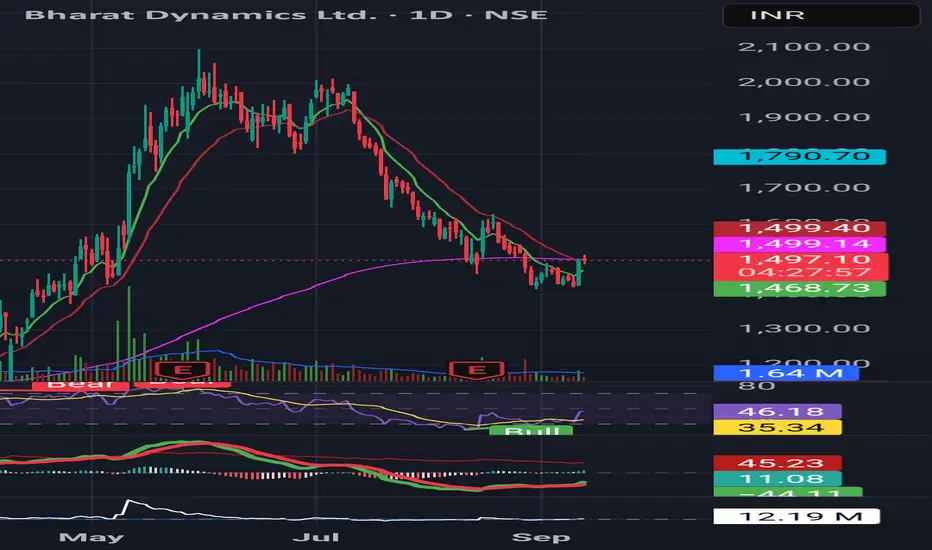
Defence Sector Showing Signs of RevivalNifty Defence vs CNX500 bouncing from support with bullish RSI divergence. Bharat Dynamics (BDL) stabilizing near 1500 zone with RSI uptick and MACD flattening. Sector & stock both hinting at reversal, but need volume confirmation above 1520–1550.
BUY TODAY SELL TOMORROW for 5%DON’T HAVE TIME TO MANAGE YOUR TRADES?
- Take BTST trades at 3:25 pm every day
- Try to exit by taking 4-7% profit of each trade
- SL can also be maintained as closing below the low of the breakout candle
Now, why do I prefer BTST over swing trades? The primary reason is that I have observed that 90% of the stocks give most of the movement in just 1-2 days and the rest of the time they either consolidate or fall
Round Bottom Breakout and Retest in ECLERX
BUY TODAY SELL TOMORROW for 5%

Maha Apex - Very Low-Risk setupThe stock price has come to its half in the last 6 months.
This time comes to a crucial low level at multiple support, as seen on the chart.
If it reverses from these levels, it can be a good trade setup with a small risk and big rewards.
The projected targets may be 130/160 or even more.
One has to keep the position size in accordance with the risk management.
All these illustrations are only for learning and sharing purposes, not a buy or sell recommendation.
All the best for your trading journey.

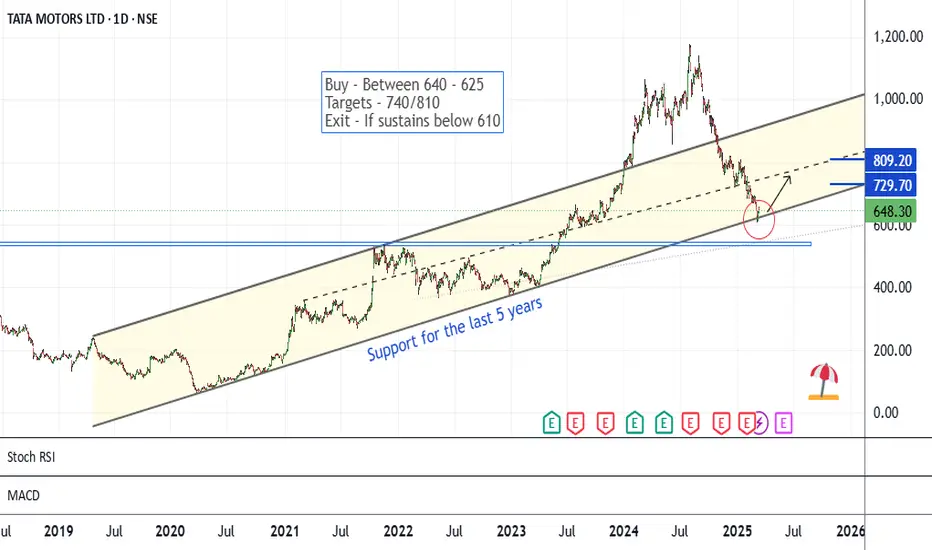
Tata Motors - Simple Long SetupThe chart is self-explanatory. The price has been travelling in a higher high-higher low pattern for the last 5 years. This time comes to the lower levels.
In the recent 5-6 sessions, it has shown a bounce back.
If momentum continues, a bullish move may be seen ahead.
The risk-reward ratio is quite good for positional trading at these levels.
If it sustains below 610 levels on a closing basis for 2-3 days, the setup will lose significance.
All these illustrations are only for learning and sharing purposes; it is not a buy or sell recommendation.
All the best.
Max Financial - Low Risk SetupCMP 1032 on 20.02.25
It is clear from the chart that the stock price has been rising in a parallel channel in recent sessions. Right now it is at the bottom of the channel.
If gives a bounceback, may go into a bullish phase again.
The risk-reward ratio seems good at the moment.
The setup remains active when the price sustains inside the parallel channel.
Plz keep the position size according to the risk management.
All the above illustration is my own view. Shared only for learning purposes. It is not a trading recommendation in any form.
All the best.

Abans Holdings - Low Risk IdeaThe stock price has dropped more than 50% in the last 3 months. And 25% in the last 10 days.
This time, it is close to the long-time support levels of 250-260.
If it shows the reversal this time, it will be a good risk-reward trade. It may reach the levels of 310/340 or even more.
The setup remains active above the level of 255-260. If sustains below 248, the setup will go weak.
One should keep the position size following risk management.
This illustration is only for learning and sharing purposes, not a piece of trading advice in any form.
All the best.

Asian Paints - Seeing the OpportunityThe stock price has dropped more than 30% in the last 3 months—this moment resting on a multiple support area, as seen on the charts.
If it bounces back from the support levels, may go into a bullish phase again. That could push the price up to the levels of 2520/2690 and 2950+.
One should wait for the reversal signs and then make an entry. Also, mind the position size.
Do not hesitate to exit the trade when hitting the stop loss.
All this illustration is only for learning and sharing purposes, not a trading recommendation in any form.
All the best.

MAHARASHTRA SEAMLESS MAHSEAMLES
made a DOUBLE BOTTOM pattern on daily chart
it has made a 50% retracement on weekly chart
.
previously has brokenout of monthly chart after 13 years of consolidation
now, will be playing it on swing basis till 1080 levels
with an SL of 668
.
huge volume buildup can be seen on todays daily candle

Birlasoft - Positional setupCMP 599 on 12.10.24
A Pole and Flag pattern-like formation is in progress on the chart. But a trade setup should be backed by other parameters too.
The range of 550-580 has been acting as a good support zone for a long time. This time, it reversed from the zone again—a good time for a buy setup with a favorable risk-reward ratio.
Immediate targets seem 670, 710, and 740.
The setup fails if the price sustains below 550-540 levels.
Position size should be following risk management.
This is only for learning and sharing purposes, not trading advice in any form.
All the best.

High conviction stock - CREDITACCCheck this stock which has made an all time low and high chances that it makes a "V" shaped recovery.
> Taking support at last years support or breakout level
> High chances that it reverses from this point.
> Volume dried up badly in last few months / days.
> Very high suspicion based analysis and not based on chart patterns / candle patterns deeply.
DISCLAIMER : This is just for educational purpose. This type of analysis is equivalent to catching a falling knife. If you are a warrior, you throw all the knives back else you will be sorrow if it hits SL. Make sure to do your analysis well. This type of analysis only suits high risks investor and whose is willing to throw all the knives above irrespecitve of any sectoral rotation. BE VERY CAUTIOUS AS IT IS EXTREME BOTTOM FISHING.
HOWEVER, THIS IS HOW MULTIBAGGERS ARE CAUGHT !
STOCK IS AT RIGHT PE / RIGHT EVALUATION / MORE ROAD TO GROW / CORRECTED IV / EXCELLENT BOOKS / USING MARKET CRASH AS AN OPPURTUNITY / EPS AT SKY

JYOTI STRUCTURES - Turnaround ?Jyoti Structures Limited (JSL) is an India-based engineering, procurement, and construction (EPC) company in the field of power transmission & distribution networks up to 765 Kilo Volts (kV) & 800 kV alternating current (AC) and high voltage direct current (HVDC) transmission lines and 765 kV Substations.
JSL offers a range of services including design & engineering, tower testing, manufacturing, construction & commissioning, sub-station design and engineering, and rural electrification.
JSL specializes in delivering turnkey projects involving designing, testing, manufacturing, erecting, and commissioning transmission lines, sub-stations, and power distribution projects in India and abroad.
JSL was one of the first 12 large accounts referred by the Reserve Bank of India under India’s new Insolvency and Bankruptcy Code 2016 (IBC). This was a significant event in the company’s history, marking a period of financial distress.
More recently, JSL has been working to improve its financial situation. In March 2024, the board of JSL approved the offer and issuance of fully paid-up equity shares of face value of ₹2 each to raise ₹175 crore through a rights issue. The rights issue price was set at ₹15 per equity share, including a premium of ₹13 per equity share. The rights issue period was scheduled to open on March 28, 2024, with a closing date on April 10, 2024.
The net proceeds from the issue were proposed to be utilized towards the payment of NCLT approved resolution plan dues. This move was seen as a part of the company’s efforts to resolve its financial issues and move towards a more stable financial future.

ITC: Will reward investors soon !!!ITC: When Noone seems to be Interested and all Negatives Around, Time Cycle Points towards a Rise from the Ashes. 🔥🔥🔥
BUY at cmp SL weekly closing below 380
Upside: 450/500+
Horizon: 3M

Asian Paints: Turnaround PotentialAsian Paints has been following its Time cycles on weekly chart exceptionally well.
As u can see everytime it enters the time cycle zone (red lines) it forms a low and rallies.
Price and Time confluence - is the most important way to trade markets.
Majority of us are focused only on prices but not on time which is essential for trader to trade profitably in markets and with consistency.
Expecting asian paints to reverse on upside as time is right and prices should follow. Price action above 3030 will confirm that this stock has bottomed out and ready to reverse on upside.

ITC could reward investors from hereonOn every time cycle, ITC has a tendency to form a low and bounce back on upside.
Very few were interested in this stock as it was a major laggard during April 2022.
The recent sharp fall of ITC also made low near this Time cycle date.
Way forward: When Noone seems to be Interested and all Negatives Around, TimeCycle Points towards a Rise from the Ashes 🔥🔥🔥
400 should remain protected on downside.

Bottom Wedge - Bullish Signal!Honda India Power Products Ltd
The price seems to have reached a bottom, showing signs of reversal as it has broken upward after a period of uncertainty or consolidation.
Pattern : Bottom Wedge
Shows two converging trendlines as prices reach lower highs and higher lows.
This pattern may suggest a slowing of downward momentum and a possible upcoming upward price movement.
Traders often look for breakout points above the upper trendline as a signal to enter a long position.
PLEASE NOTE THAT:
This chart analysis is only for reference purpose.
This is not buying or selling recommendations.
I am not SEBI registered.
Please consult your financial advisor before taking any trade

Falling Knife Stock-A case study approach!Introduction:-
We have seen an amazing bull run in global markets including our Indian markets in the past 3 years. Many investors have been able to gain multibagger returns from this bull run.
However, we all must understand that like every coin has 2 sides, every bull run has few stocks which are either under performing(like our beloved HDFC Bank) or are part of falling knife category.
A falling knife is a term used when a security, such as a stock, quickly drops in price. During such instances, investors are recommended to wait for the security to reach its lowest point before buying back in. (Source: CFI)
The reason for falling knife could be change of fundamentals, weak results, future degrowth prediction or anything beyond our understanding.
And it is important to identify such stocks . Investors try to enter such stocks thinking they have caught the bottom just to keep funds locked in the stock for longer times. Hence,it is beneficial to stay away from them until a reversal pattern is seen with good volumes in weekly time frame.
Case study:-
Let's discuss one such stock from the footwear category, Campus Activewear.
Company is one of India’s largest sports and athleisure footwear brands in terms of value and volume. Good return ratios(ROE,ROCE) above 20%, high sales growth of 32% in last 3 years,slightly expensive valuation but hardly anything so wrong in fundamentals from my understanding.
Being a techno fundamental investor, I look at lot of things from fundamental as well as technical perspective before entering.
So, from a technical view, just have a look at stock's chart. In late 2022, stock was around 620 levels and now stock is trading near 270 levels which is more than 50% of wealth destroyed. A proper example of Falling Knife whose bottom is still not made. There must be some unlucky investor who is holding the stock from the tops expecting a reversal but what he has missed is the amazing bull run of Nifty from 18800 to 22000 in this last 10 months. And that is a huge miss.
Learnings:-
#1:-If you are an investor with have limited capital, it is better to have a Stoploss even for your investment stocks in a bull run.
Remember, Even Warren Buffet owned Berkshire Hathway booked loss in Paytm
#2:-If you are an investor with good amount of free capital, just forget! Don't have FOMO. Cash equity securities are beautiful and unpredictable. We might see this stock above 1000rs levels or below 100rs in the next 5 years.
Remember, even The best of best investors owned few stocks which failed miserably.
#3:- For an investor trying now to hunt a bottoming/reversal opportunity,do wait for stock to sustain a weekly closing above 320 which is a strong resistance.
Remember, not even promoters can catch exact tops and bottoms, so you also should not try to!
Conclusion:
I would say that if you trust your analysis and company's fundamentals, you should not listen to outside crowd. However, A falling knife can act as a dagger in your portfolio .
A smart investor is one understands what company's business is as well as what the stock's chart is trying to say.

#Itc cash : Rounded bottom formation #ITC cash
01.01.2024
Make or break level 473
(Rounded Bottom formation)
ITC cash above 473.10
will go 498-500/520/545
Cmp 468.05
(Either it wont break 473 levels
or if closed or trades
above it will be bullish)

SPICE JET AT THE BOTTOM ...BESR RISK TO REWARD OPPORTUNITYSpice JET IS FUNDAMENTALLY weak stock
risky to buy on fundamental
but technically it is trading on support
Stoploss of 15 and upside potential till 60

METROPOLIS Analysis(Rounding Bottom)!Rounded Bottom Pattern in Metropolis!
50 EMA 100EMA Crossover!
Golden Crossover 50 EMA and 200 EMA?
METROPOLIS has made a Rounding Bottom Pattern in a Daily Timeframe. We can see the fluctuations in Volume, after the price reaches the bottom it diminished, and after the rally, it gained. The previous trend was a clear downtrend after this stock gained momentum and showed an uptrend now it is trading in the parallel channel and it is trading around its neckline. We should wait till it breaks the parallel channel as well as the neckline, the interesting thing is 50EMA crossed 100 EMA and now it may cross 200EMA so we can see the Golden Crossover. After the golden crossover, we may expect a long-term uptrend in the METROPOLIS.
Entry = Above 1492.10
Stop Loss = Below 1419.30
Target = 1790.15 and 1879.35
Disclaimer = All my analysis is for Educational Purposes only. Before entering into any trade -
1) Educate Yourself
2) Do your research and analysis
3) Define your Risk to Reward ratio
4)Don't trade with full capital

Lyka Labs Ltd. - Bottom Triangle Pattern formationThe " Bottom Triangle " that has formed on the stock of Lyka Labs Ltd .
This pattern suggests a potential price movement from the current close of Rs. 121.60 to a range between Rs. 145.00 and Rs. 150.00.
The pattern developed over a span of 66 days, which is expected to be roughly the time it might take for the price to reach the target range, based on standard technical analysis principles.
It's important to note that while chart patterns like the Bottom Triangle can provide insights into potential price movements, they are not foolproof indicators.
Market conditions can change due to a variety of factors including news events, macroeconomic trends, and changes in investor sentiment.
Therefore, it's always a good idea to consider multiple sources of information and conduct thorough research before making any investment decisions.
If you're actively trading or investing in the stock market, it's also recommended to consult with financial professionals or advisors who can provide personalized advice tailored to your specific situation and risk tolerance.

VIP industries has formed a bear trap!It is currently a risky positional trade but the stock is looking strong near support trendline.
A bear trap has been formed near the same.
Levels are mentioned on chart. Risk reward is favouring the trade.
