RIVER COIN LOOKING BULLISH As per price action its looks bullish from the current market price
on other half we can alts market looks bullish so we can can long from her let see what next come
Wave-5

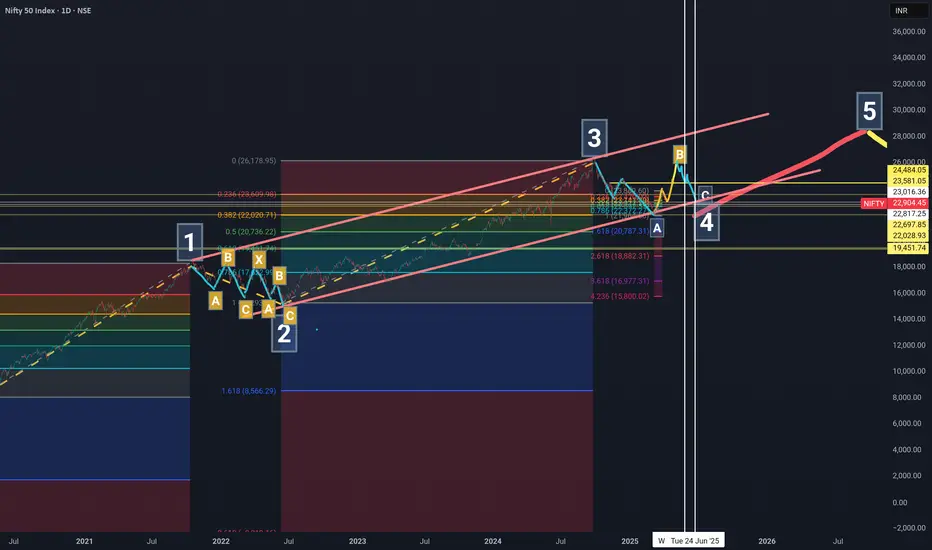
Tough Times ahead for Nifty. 26277 Top for some years?Nifty has been in Bull run for some Years now.
2008 to 2020 - Wave 1 Impulse
2020 Crash - Wave 2 Correction
2020 to 2025 - Wave 3 Impulse
2025 to 2026 - Wave 4 Correction
2026 2027 Onwards - Wave 5 Impulse
Let's Break Wave 4
It may take place in Double or Triple wave Combo.
The Corrective Wave ends in 3 or more Legs.
Wave A - 26k to 22k.
Wave B - 22k to 25.5k
Wave C - 25.5k to 21k
Next Set of Legs - to Follow in New idea.
This would be the 1st of the Corrective Combo that is expected to end around 19k By 2026 2027.
Now could be the Time for Wave C with rejection from 0.854 of Fib retracement of Wave A.
It looks like Wave C is about to begin.. Let's meet at 21k 🫣
RSI - Circled - to be noted.
All The Best🥲
Short Trade Activates below 24750.

Long Correction is expected to take place in INDRAPRASATH GAS!Elliott Wave Analysis:-
In Correction wave a) wave took place and for retracement b) wave and still a little more correction was pending it seems to be. and the fall is expected from there.
i am not a SEBI registered advisor.
Before taking a trade do your own analysis or consult a financial advisor.
I share chart for education purpose only. I share my trade setup.

Elliot Wave Analysis for Nifty | Direction for April 7thNifty 50 is in 4th Wave of the Ongoing Cycle. Now as per rule of Alteration, if second Wave was sharp, fourth Wave is most likely to be a sideways. Also if second Wave was complex, 4th Wave is more likely to be simple.
Considering these rules, it is evident that current Wave could be a flat Wave of either simple type, or running flat type or extended flat type,
Amongst three, extended flat Wave is very less likely because it can breach the tunnel. The tunnel is created using peak of Wave 1 and Wave 3 and drawing a parallel to it that touches bottom of Wave 2. As per elliot Wave analysis, Wave 4 is very less likely to breach this Zone. Thus, it will stay within it.
Now within it, it doesn't have much room to go down. So only regular flat or running flat is possible.
Amongst the two, my assumption is it can go on to become a running flat Wave.
For that, it can go as low as fib retracement level of 61.8% at 22697 mark. From there it can most likely reverse and complete the wave B of Wave 4. Thereafter it will again fall to Wave c which since it will be a running flat, will end above the bottom of Wave A.
This is my analysis. Open the community views.
Discl: for learning purposes only, not buy sell recommendation.
City Union Bank completed a Wave 4 on Weekly timeframeCity Union Bank has been in an uptrend since February 2009 and has recently completed Wave 4 in a triangle pattern. Now, it is poised to form Wave 5 in the coming weeks. A conservative approach to maximize gains from Wave 5 is to enter the market at the right moment, which is when the stock starts trading above Rs. 181, marking an entry over Wave D of the triangle.
This strategy aligns with the principles of Elliott Wave Theory, where Wave 5 typically represents a final upward movement in the trend. By waiting for the stock to trade above Rs. 181, you can potentially capture the gains from this anticipated upward movement.

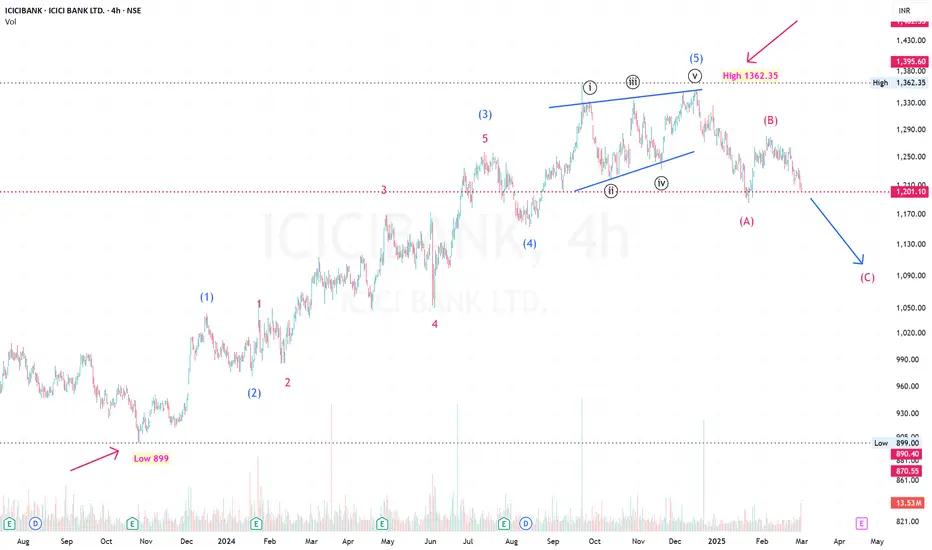
ICICI Bank forming a Potential Wave CICICI Bank began gaining momentum after its Q2 earnings for FY 23-24 in October 2023, starting from a low of Rs. 899. Over the past year, it completed an impulse wave, culminating in the 5th wave as an ending diagonal on December 17, 2024, with a high price of Rs. 1362.35, marking a rally of nearly 463 points.
Following this, ICICI Bank entered an ABC correction phase. It completed Wave A on January 23, 2025 (37 days), with a low of Rs. 1186.00, a decline of approximately 176 points. Wave B formed on February 4, 2025 (12 days), reaching a high of Rs. 1280.50, which is almost 50% of Wave A, a typical Elliott wave correction.
Currently, ICICI Bank is in the process of forming Wave C and could potentially see a low of Rs. 1100.00, targeting at least 176 points before its earnings update on April 21, 2025.
Title: Nifty 50: Downtrend Persists, But a Reversal PossibleNifty 50 has dropped 12% from its all-time high, causing fear in the market. However, a Wolfe Wave pattern suggests a possible bounce. After peaking at 22,277 on September 27, 2024, Nifty has been falling, with a brief rise on November 21, 2024, before hitting a new low of 22,786 on January 27, 2025. The short-term correction seems over, and an upside move toward 24,900–25,000 is likely, though risks remain—stop-loss is essential.
Disclaimer: This is for information only, not financial advice. Do your research before investing.

Elliott wave count: we are in Wave 4-5I will present my way of counting Elliott waves to identify the upcoming local top of BTC. Each Elliott wave researcher and practitioner will have their own way of counting, and each counting method has its own basis and weaknesses. I hope to receive feedback from traders who use the Elliott method. For those traders who do not use this method, please feel free to refer to it if you find it interesting or useful.
1. BTC has broken the downtrend from the end of 2021, and I consider the start of the impulse wave to be late November 2022. Wave 0-1 extended until April 2023.
2. The duration of Wave 1-2 is not shorter than the duration of Wave 0-1, therefore Wave 1-2 ended in August 2023.
3. Using ExFibo, I determined that Wave 2-3 = 1.618 Wave 0-1. Wave 2-3 ended in March 2024.
4. The duration of Wave 3-4 is not shorter than the duration of Wave 2-3, therefore Wave 3-4 ends in September 2024.
5. The most important thing right now: predicting Wave 4-5.
Wave 2-3 was larger than Wave 0-1 so there is no limitation for Wave 4-5. I can list some cases that we can follow:
a) Wave 4-5 = Wave 0-1 => BTC may form a local top at ~$103K.
b) Wave 4-5 = Wave 2-3 = 1.618 Wave 0-1 => BTC may form a local top at ~$155K.
c) Wave 4-5 = 1.618 Wave 2-3 = 2.618 Wave 0-1 => BTC may form a local top at ~$295K.

NDR AUTO COMPONENTS - Wolfe WaveSome of the people who know me also know how big a fan I am when it comes to my conviction on the Wolfe Wave.
I see it pretty clear over here. Targets mentioned in Green. Ride the trend.

NMDCThere are multiple patterns visible here and it seems a breakout is being prepared considering all the patterns.
I see a large triangle formation breakout inside which a Wolfe Wave was already working and some of you know how much I love the Wolfe Wave.
Further the price action has taken supports multiple time from the same trend line.

Neo wave Elliott wave #Nifty50 Full Analysis #chartsTrainer Neo wave Elliott wave #Nifty50 Full Analysis #chartsTrainer
as per neo wave nifty now getting rise till 24640 to 25200 for make wave B and than fall in 5 steps 12345 for completing last wave C.
There are more probability to making profit in future.
All stocks are corrected and give us opportunity to buy them on large discounts.

Nifty further down move possible.I have already posted about todyas fall beforehand.
Now if today's low is broken the next target for NIFTY will be 23651.

Bank Nifty - Next 2/3 days - current week - 15 Mins TFConsidering we have uncertain times and the chart's formation is also not providing clear direction of where the market seems to probably trend, we will go step by step and try to decode what market is forming on 15 Mins TF this week.
As of end of market today, we have the following chart formation available. As per Elliott principle, we have 12345 completed from major swing low on 15 Mins TF and now we are in correction mode.
Either of these possibilities exist:
1. We may be in ABC-ABC-ABC formation as per blue path line. 1 leg done, 2 remaining
2. We may have completed the ABC formation and now market needs to give good impulse from tomorrow for 12345 formation as denoted by green path line
We still can't go for proper bearish formation as the major swing lows/demand zones are not yet broken on 15 Mins TF itself.
Let's see how the market behaves tomorrow and accordingly we will revisit our views tomorrow.

AmznHopefully this is correct Wolf wave on Amzn
though BO came at 120 still 155 is imp level to cross

GINNIFILA: Cup & Handle Pattern with Elliot 3rd wave to start ?GINNIFILA seems in a cup & handle pattern since June 2017.
Higher timeframes MACD looks good.
On daily timeframe we can see breakout of Resistance trendline with Good Volume.
Elliot wave: Looks it has complete wave 1 & 2, and 3rd wave is in progress on weekly & monthly timeframes.
My entry price is around: 33.
Stop Loss: 26.
Conservative Target = 110.
Aggresive Target = 140.

XAUUSD elliott wave analysis.. Buy on DipYesterday ISM Manufacturing PMI data given a dip near 2473
where it seems that xauusd completed its last leg of 5th wave of Y.
Now breaking out from the channel and 2-4 trendline will give more strength for
upmove..
Important level to watch 2496.. bulls need to sustain
upside immediate resistance 2507-09 and 2532
downside support 2473-2470
Disclaimer : study is for educational purpose

IREDA Shorterm pattern In shorter IREDA showing impulsive movement
Wave 1 retraced to 78.6%
Wave3 attained 161.8%
Wave 4 retraced 38.2% may go to 50% , price movement above around 270 , can show unmoved forming 5th wave.
Elliott wave analysis
Open for any suggestions and reviews.

MAFANG ETF BULLISHMAFANG ETF BULLISH
forming classic elliott wave
In it's 4th wave
Anytime from now it will make 5th wave
More than 15% move may go upto 50%
Let's see.

Nifty X-Wave Volatility: Potential Wipeout of Recent RallyDisclaimer:
Trading in financial markets involves substantial risks. Consult your financial advisor before making decisions. This commentary is not a solicitation to buy or sell.
WaveTalks - Market Whispers: Can you hear them?
---------------------------------------------------------------------------------------------
Overview:
The Nifty Index is currently forming a complex WXY wave pattern on a higher degree wave. With Wave W and X completed, we are now anticipating a decline towards the psychological support levels.
Key Levels and Targets:
Initial Support Zone: 21950 - 22000
This zone is expected to provide psychological support. If the index holds below 22900 in opening session on 7th June 2024 and begins to fall, we anticipate an initial drop to this support zone 21950-22000, marking a fall of approximately 900-1000 points.
Further Downside: Below 21900
If the index breaks below 21900, we could see a continuation of the fall towards the previous lows around 21281, observed on 4th June.
Recent Rally:
Rally Overview:
The index recently rallied 1629 points from the low of 21281 on 4th June 2024 to higher levels of 22910 within the last 2-3 days.
Correction Expectation:
This rally may be wiped out as part of the corrective sequence, leading to a possible retest of lower levels before any further upside movement.
Upside Potential:
New Highs Target: Above 23338
After the corrective phase, we expect the index to resume its upward trajectory, potentially reaching new highs above 23338 as discussed in the last idea
Last Idea - Nifty - Pre Exit Poll Outlook: Bulls Above 22,400
Trading Plan:
Monitor Resistance:
Keep a close watch on the 22900 level. As long as the index remains below this level, a bearish outlook is maintained.
Initial Short Position:
Consider initiating short positions if the index holds below 22900, targeting the 21950 - 22000 support zone.
Break Below 21900:
If the index breaks below 21900, further short positions can be considered, aiming for a retest of the 21281 level and even new lows are possible
Reversal Signs:
Look for reversal signs and bullish setups near the 21281 level to position for the next potential rally towards new highs above 23338.
Conclusion:
The Nifty Index is poised for a significant correction before resuming its upward trend. Traders should be prepared for volatility and closely monitor key levels for optimal entry and
exit points.
-----------------------------------------------------------------------------------------------
From WaveTalks
Abhishek

ASIAN PAINTS LTDAsian paints Looks like bottoming out.
ADX about to get a positive divergence and already fell from 50 level
RSI above 50
BUY on dips with a SL of 2770, for the target of 3040 and 3230
CHART & ANALYSIS
ADARSH DEY

Bosch Ltd - Great Long Term PickIt seems Monthly Supply zone is broken (the big red bar from left is 1-M Supply Zone broken in style). Now, on Weekly/Daily chart, the Elliott Wave Model applied is as shown. We are in great extended 5th wave. If price still continues to make higher lows and higher highs then 5th wave end possibilities are also as shown in the chart. However, for those who haven't been in this boat, a great opportunity to buy for longs can come at the nice green 1 day demand zone bar shown hereby.
We will have to see the price action and momentum near 26100 to 25800 and then plan to seek a bounce for an upward journey.
Again, I will post those ideas which are great opportunities to educate and practice ourselves on Elliott Wave and Demand-Supply models with Price Action as primary foundation.

Reliance chart studyReliance spot at 2600
Weekly time frame
Horizontal resistance as per previous life high levels, from where counter have changed trend in past,
Bearish wolf wave or wedge can also be considered as per formation.
Need to keep close watch on price action on daily time frame, if counter is not able to breakout and sustain above life high levels, can retrace around 5-7-10% going ahead,
counter have give around 20% move from 2200 levels one way so as per fibbo 50% retrace would give a good 8-10% fall in counter.
life high levels remain a key point as the juncture

Asian Paints : Multibagger IdeaExciting Bullish Pattern Alert! 🐂
📊 Pattern: Symmetric Triangle
📌 Symbol/Asset: ASIANPAINT
🔍 Description: Stock is in a pattern formation. Support is around 2850-2900 and we can see huge upside after breakout of the resistance.
👉 Disclosure: We are not SEBI registered analysts, this is not a buy or sell recommendation.
