NATCO - Sell - Short Term There is a FVG and already been tested be a tail. better go with a short for short term but be cautious.
It's educational purpose only. NOT A SIGNAL.
Wave Analysis

Part 1 Support and Resistance How Option Trading Works
Option trading can take place on exchanges such as the Chicago Board Options Exchange (CBOE) or through online trading platforms provided by brokers. Traders can take one of two main positions:
Buying Options – This involves paying the premium to acquire the right to buy or sell the underlying asset. Buying options limits the trader’s loss to the premium paid but offers theoretically unlimited profit for calls if the asset price rises, or significant profit potential for puts if the asset price falls.
Selling/Writing Options – This involves receiving the premium in exchange for assuming the obligation to buy or sell the underlying asset if the buyer exercises the option. Writing options can generate steady income through premiums but carries high risk, especially if the market moves unfavorably.

HDFC BANK LTD PARALLEL CHANNEL BREAKOUTHDFC BANK was traded in channel from past few years and made a breakout with good volume. Entry price at ₹990, with a STOPLOSS ₹940 and TARGET ₹1,190

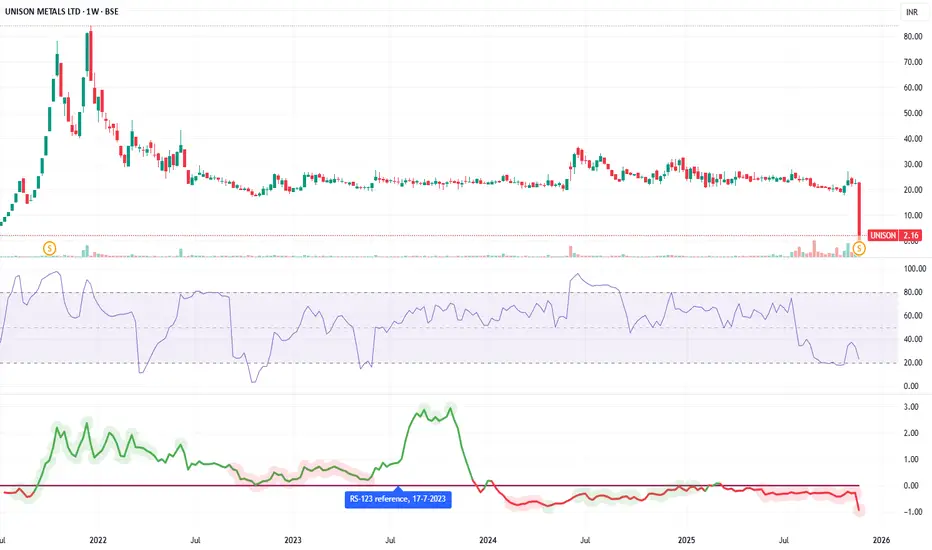
Unison Metals (UNISON) – Post-Split Deep Study & Small-Cap TurnaA. Concise & Professional
A detailed research post on Unison Metals Ltd, covering its recent stock split, technical indicators (RSI, trend exhaustion, support zones), and fundamental snapshot (P/E, P/B, market cap, sector outlook). This study explores whether this small-cap has a realistic chance to move back toward its previous levels around ₹25, along with risks and conditions required for a turnaround.
B. Technical-Focused
Unison Metals shows strong multi-year support, repeated oversold RSI signals, and extreme volatility after the recent split. This study reviews the chart structure, momentum behaviour, volume patterns, and trend possibility for a medium-term bounce. Includes risk warnings and long-term value considerations.
C. Fundamental-Focused
A quick breakdown of Unison Metals' fundamentals: ₹64-crore market cap, modest P/E & P/B, low promoter holding, and sector position in Steel & Iron Products. Study highlights strengths, weaknesses, and what must improve for the stock to re-rate back toward previous highs.
D. Community / Educational
Sharing my detailed research on Unison Metals (UNISON) — combining charts, RSI study, and fundamentals. Posting for educational purposes so others can analyze the stock, add insights, and discuss whether this micro-cap holds potential for a turnaround after the stock split.
E. Trader-Friendly
Unison Metals is near long-term support with repeated RSI resets and a price collapse after the split. This study explores whether a short-term or swing-based reversal is possible, the risks involved, and the fundamentals backing the move.
✅ Note
This is not a buy/sell call. Unison Metals is a high-risk small-cap stock. Price movement can be highly volatile due to low liquidity and recent stock split. The study is for educational and research purposes only. Always verify fundamentals, volume, and quarterly results before taking any position.
Trade Rate Sensitive Assets: A Comprehensive OverviewIntroduction
In the global financial markets, assets are often influenced by fluctuations in trade rates, currency values, and interest rates. Trade rate sensitive assets are those whose valuations, returns, or profitability are significantly affected by changes in trade rates or related economic variables. Understanding these assets is crucial for investors, traders, and policymakers, as shifts in trade rates can impact everything from corporate earnings to sovereign debt sustainability. In this discussion, we will explore what trade rate sensitive assets are, the types of assets affected, the mechanisms of sensitivity, and practical strategies for managing associated risks.
Definition of Trade Rate Sensitive Assets
Trade rate sensitive assets are financial or physical assets whose value is directly or indirectly influenced by trade rates, exchange rates, or global trade dynamics. In this context, “trade rate” refers to the cost of importing or exporting goods and services, often mediated by currency exchange rates and tariffs. When trade rates fluctuate due to changes in currency valuations, trade policies, or global demand, the cash flows and profitability of these assets can be materially affected.
For example, a company that exports electronics from India to the United States may find that its revenue in Indian Rupees rises or falls depending on the USD/INR exchange rate. Similarly, bonds issued in foreign currency, commodities, or equity of export-driven companies are considered trade rate sensitive.
Categories of Trade Rate Sensitive Assets
Equities of Export-Oriented Companies
Companies engaged in global trade, particularly exporters, are highly sensitive to changes in trade rates. For instance:
Exporters: Revenue depends on foreign currency inflows. A stronger domestic currency reduces the local-currency value of foreign revenue, negatively impacting profits.
Importers: Firms reliant on imported raw materials may face higher costs if the domestic currency weakens, squeezing profit margins.
Examples include:
Technology companies exporting software or hardware.
Commodity companies exporting metals, agricultural products, or chemicals.
Foreign Currency Bonds
Bonds issued in foreign currency expose investors to trade rate and currency risk. When trade rates impact currency valuations:
The local-currency value of coupon payments and principal changes.
Investors holding USD-denominated bonds in emerging markets may gain or lose value depending on the USD exchange rate relative to their home currency.
Commodities
Many commodities are globally traded, so trade rate fluctuations directly influence pricing. For instance:
Oil and gas prices are denominated in USD globally; any currency depreciation in importing countries increases local costs.
Agricultural products, metals, and rare earth minerals are affected similarly, with global trade dynamics impacting supply and demand.
Derivative Instruments
Derivatives such as futures, options, and swaps on foreign currencies, commodities, and trade-sensitive indices also qualify as trade rate sensitive assets. They are particularly useful for hedging or speculating on trade rate movements. For example:
Currency futures can hedge export revenue against domestic currency appreciation.
Commodity futures allow exporters and importers to manage cost volatility.
Real Assets with Trade Exposure
Some physical assets, like factories, warehouses, or ships, are indirectly trade rate sensitive. For example, a shipping company’s revenue is tied to freight rates, which are influenced by global trade activity and currency movements.
Mechanisms of Sensitivity
Trade rate sensitivity arises from several interconnected mechanisms:
Exchange Rate Fluctuations
Exchange rates are a primary determinant of trade rate sensitivity. Assets that generate foreign revenue or require foreign inputs experience profit volatility when exchange rates shift.
A depreciation of the domestic currency improves export competitiveness, potentially increasing revenue.
Conversely, it raises the cost of imported inputs, affecting margins.
Tariffs and Trade Policies
Changes in trade tariffs, quotas, and regulations can directly impact asset value:
Increased tariffs on imported components may raise production costs for domestic manufacturers.
Export restrictions in foreign markets can limit revenue potential.
Global Economic Cycles
Trade-sensitive assets react to changes in global economic growth, as demand for exports fluctuates with industrial production, consumer spending, and investment cycles.
Commodity Prices
Many trade-sensitive assets, especially in resource-driven economies, are influenced by global commodity prices. For example:
Oil exporters benefit from rising crude prices in USD terms.
Agricultural exporters face revenue shifts based on international demand and currency-adjusted prices.
Interest Rate Differentials
Trade-sensitive assets in foreign currency can be indirectly affected by interest rate differentials. Higher domestic interest rates may strengthen the currency, impacting export competitiveness and asset valuations.
Risk and Volatility
Trade rate sensitive assets carry inherent risks due to their exposure to multiple dynamic factors:
Currency Risk: Volatile exchange rates can significantly alter asset values.
Trade Policy Risk: Sudden policy changes, sanctions, or tariffs can disrupt revenue streams.
Commodity Price Risk: Export-driven commodity firms face fluctuations in global prices.
Liquidity Risk: Assets with concentrated trade exposure may be harder to sell during economic shocks.
Investors must recognize that trade rate sensitivity introduces higher volatility compared to domestic-only assets, making risk management essential.
Investment and Hedging Strategies
Investing in trade rate sensitive assets requires careful assessment of global trade trends, currency movements, and economic indicators. Some practical strategies include:
Diversification
Spread investments across regions, sectors, and asset classes to reduce exposure to a single trade-sensitive factor.
Currency Hedging
Use forward contracts, options, or swaps to mitigate currency risk in foreign revenue or bonds.
Commodity Hedging
Exporters and importers can lock in prices via commodity futures or swaps to reduce volatility from global market fluctuations.
Monitoring Policy Developments
Stay informed on tariffs, trade agreements, and geopolitical developments that may affect asset valuations.
Active Portfolio Management
Adjust allocations dynamically based on macroeconomic indicators, exchange rate forecasts, and trade volume trends.
Examples in Real-World Markets
Apple Inc.: Generates significant revenue from exports; USD appreciation can affect international earnings.
Reliance Industries: Exposed to crude oil prices and global trade flows; currency and commodity risks are significant.
Emerging Market Bonds: Sensitive to USD movements and global interest rate changes, affecting repayment in local currencies.
Shipping Companies (e.g., Maersk): Revenue depends on global trade volumes and freight rates, which fluctuate with global economic conditions.
Conclusion
Trade rate sensitive assets form a crucial component of global financial markets, linking macroeconomic trends, currency movements, and international trade dynamics. These assets—ranging from equities, bonds, commodities, derivatives, to physical trade-linked assets—require careful monitoring due to their susceptibility to exchange rates, trade policies, and global demand cycles. Successful investment and risk management in these assets involve a combination of hedging, diversification, and close attention to macroeconomic and geopolitical indicators. Understanding the mechanisms and strategies related to trade rate sensitivity enables investors and policymakers to navigate volatility, optimize returns, and mitigate potential losses in a highly interconnected global economy.
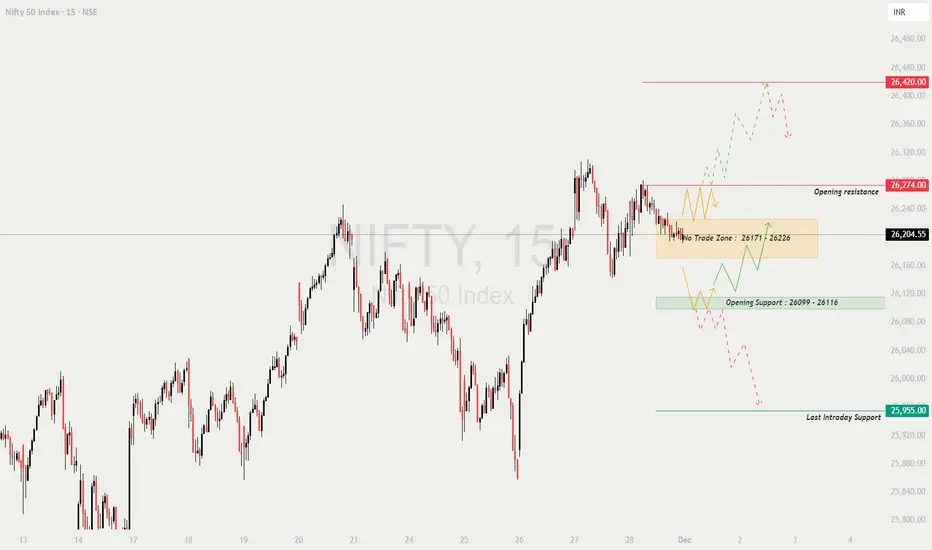
NIFTY : Trading levels and Plan for 01-Dec-2025📊 NIFTY TRADING PLAN — 01 DEC 2025
Nifty closed near 26,204, positioned right above the No-Trade Zone (26,171–26,226) and below the Opening Resistance (26,274).
The market is currently compressing inside a value area, meaning the reaction at the opening price will decide the day’s direction.
This session has clean levels for trend continuation and clear reversal zones, so disciplined execution is key.
🔍 Key Intraday Levels
🟧 No Trade Zone: 26,171 – 26,226
🟥 Opening Resistance: 26,274
🟥 Major Resistance: 26,420
🟩 Opening Support Zone: 26,099 – 26,116
🟩 Last Intraday Support: 25,955
🟢 SCENARIO 1 — GAP-UP OPENING (100+ Points)
If Nifty opens around 26,300–26,360, it will open near or above the resistance cluster.
If price sustains above 26,274 for 10–15 mins →
⭐ Upside targets → 26,330 → 26,365 → 26,420 (Major Resistance)
This is the bullish continuation zone.
If price rejects 26,274–26,300, expect a drop toward:
➡️ 26,226 → 26,171
Best long setup →
Breakout above 26,274, followed by retest and a strong green candle.
Avoid shorting immediately in a gap-up — wait for a clean rejection wick.
📘 Educational Note:
Gap-ups near resistance often trap impatient buyers.
Always wait for a retest confirmation rather than buying the first candle.
🟧 SCENARIO 2 — FLAT OPENING (Near 26,180–26,220)
A flat open keeps Nifty inside the No-Trade Zone (26,171–26,226) — expect choppy movement initially.
Only trade after a breakout from the zone:
— Above 26,226 → Trend resumes upward
— Below 26,171 → Downtrend resumes
Breakout above 26,226 →
Targets → 26,260 → 26,274 → 26,330
Breakdown below 26,171 →
Targets → 26,099 → 26,060
Do NOT take trades inside 26,171–26,226.
This zone is deliberately marked as confusing and unreliable.
💡 Educational Tip:
Flat openings are ideal to observe market intent.
The first directional breakout after 15–20 mins usually leads the entire session.
🔻 SCENARIO 3 — GAP-DOWN OPENING (100+ Points)
A gap-down near 26,080–26,120 places price into the Opening Support Zone (26,099–26,116).
If support 26,099–26,116 holds with bullish rejection →
Upside targets → 26,171 → 26,226 → 26,274
If support breaks decisively →
Next downside → 26,020 → 25,955 (Last Intraday Support)
A strong bounce from 25,955 is a potential high-probability reversal zone.
If 25,955 breaks with volume →
Deeper downside → 25,880 → 25,825
📘 Educational Note:
Gap-down into a clean support often produces high-quality reversal trades —
but only once a higher low forms. Never pre-empt the reversal.
💼 RISK MANAGEMENT TIPS FOR OPTION TRADERS 💡
Avoid trading the first 5 minutes — volatility is artificial.
Prefer ATM or ITM options for directional clarity.
SL should be based on chart levels, not premium amount.
Avoid averaging losers — if the structure breaks, exit immediately.
Use partial booking after each breakout target.
When VIX is low → Option buying works well.
When VIX rises → Switch to hedged strategies (spreads).
⚠️ Golden Rule:
Protect your capital. The goal is consistency, not hitting home runs every day.
📌 SUMMARY
Bullish above → 26,226
Targets → 26,260 → 26,274 → 26,330 → 26,420
Bearish below → 26,171
Targets → 26,116 → 26,060 → 25,955
Strong Reversal Zones:
🟩 26,099–26,116 (Opening Support)
🟩 25,955 (Major Support)
🟥 26,274 (Opening Resistance)
🟥 26,420 (Major Supply Zone)
No-Trade Zone:
⚠️ 26,171–26,226
🧾 CONCLUSION
Nifty will take a clear direction only after breaking out of the No-Trade Zone.
Trend clarity will come from:
✔️ A breakout above 26,226
✔️ A rejection from 26,274
✔️ A breakdown below 26,171
✔️ A bullish reversal from 26,099 or 25,955
Wait for confirmation; avoid overtrading in consolidation zones.
⚠️ DISCLAIMER
I am not a SEBI-registered analyst.
This analysis is for educational purposes only.
Always consult a certified financial advisor before trading or investing.
BANKNIFTY : Trading levels and Plan for 01-Dec-2025📊 BANKNIFTY TRADING PLAN — 01 DEC 2025
BankNifty closed near 59,722, sitting just below a key Opening Resistance (59,945) and above a crucial Opening & Last Intraday Support area (59,582–59,610).
Price is compressing between a strong seller zone above and a strong buyer zone below — making the opening structure very important.
🔍 Key Intraday Levels
🟥 Opening Resistance: 59,945
🟥 Last Intraday Resistance: 60,176
🟩 Opening & Last Intraday Support Zone: 59,582 – 59,610
🟩 Last Intraday Support Zone: 59,452 – 59,500
🟢 SCENARIO 1 — GAP-UP OPENING (200+ Points)
If the market opens around 59,900–60,050, it moves directly into resistance zones.
A sustained breakout above 59,945 for 10–15 mins →
⭐ Targets → 60,060 → 60,120 → 60,176
If price rejects from 59,945, expect pullback toward 59,800 → 59,720.
Avoid aggressive buying near 60,000 — sellers usually defend this psychological mark.
Best long trade →
Breakout above 59,945 → Retest → Strong green candle → Entry.
📘 Educational Note:
Gap-ups near resistance often trap breakout buyers. Wait for confirmation through retest or strong candle formations.
🟧 SCENARIO 2 — FLAT OPENING (Near 59,690–59,750)
A flat open places price between resistance and support — expect early indecision.
Breakout above 59,800–59,820 →
Upside levels → 59,945 → 60,060 → 60,176
If price fails to cross 59,800 and reverses →
Expect a slide towards 59,610 (support).
Breakdown below 59,610 →
Targets → 59,500 → 59,452
Avoid trading in the chop zone between 59,690–59,780 unless market shows clear structure.
💡 Educational Tip:
Flat openings offer the best trend identification. First 15-min candle tells the true direction — don’t pre-commit to a bias.
🔻 SCENARIO 3 — GAP-DOWN OPENING (200+ Points)
A gap-down around 59,480–59,550 drops price directly into support.
If 59,452–59,500 holds with strong wick rejection →
Upside bounce targets → 59,582 → 59,720 → 59,820
If support breaks decisively →
Next downside → 59,360 → 59,280
A strong bounce from 59,452 is ideal for low-risk long setups — only with confirmation.
Avoid immediate option buying if volatility spikes after gap-down — wait for price stability.
📘 Educational Note:
Gap-down into support zones gives some of the strongest reversal trades — but only once a clear higher low is formed.
💼 RISK MANAGEMENT TIPS FOR OPTION TRADERS 💡
Avoid trading first 5 minutes — especially on gap-ups/gap-downs.
Use ATM or ITM options for directional trades; avoid deep OTM decay.
Always define SL based on chart levels, not on premium.
Don’t average losing trades — structure invalidation = exit.
Partial profit booking helps secure gains in fast markets.
When VIX is low → Prefer buying.
When VIX is high → Prefer hedged selling strategies.
⚠️ Golden Rule:
Protect your capital first — the best setups come only 2–3 times a day.
📌 SUMMARY
Bullish above → 59,945
Targets → 60,060 → 60,120 → 60,176
Bearish below → 59,610
Targets → 59,500 → 59,452 → 59,360
Strong Reversal Zones:
🟩 59,452–59,500 — Deep buyer zone
🟥 59,945–60,176 — Seller zone
Avoid trading inside:
⚠️ 59,690–59,780 (Flat opening chop zone)
🧾 CONCLUSION
BankNifty’s trend for 01-Dec will depend on whether price:
✔️ Breaks out above 59,945
✔️ Rejects from 60,000
✔️ Holds support at 59,582–59,610
✔️ Breaks below 59,452 for deeper downside
Wait for structure confirmation and avoid trades inside choppy regions. Follow price, not predictions.
⚠️ DISCLAIMER
I am not a SEBI-registered analyst.
This analysis is strictly for educational purposes.
Please consult a certified financial advisor before taking any trading decisions.

Part 12 Trading Master ClassCall Options
A call option benefits the buyer when the price of the underlying asset goes up.
For example, if a stock is trading at ₹100 and you buy a call option with strike price ₹105, you expect the price to rise above ₹105 before expiry. If the stock goes to ₹120, you can buy it at ₹105 and profit from the difference (minus premium). If it stays below ₹105, your loss is limited only to the premium paid.
Put Options
A put option benefits the buyer when the price of the underlying asset goes down.
If a stock trades at ₹100 and you buy a put with a strike price of ₹95, you expect it to fall. If the stock goes to ₹80, you can sell at ₹95 and keep the difference as profit. If price stays above ₹95, your maximum loss is only the premium.

Part 11 Trading Master Class What Are Options?
Options are financial contracts that give the buyer the right, but not the obligation, to buy or sell an underlying asset at a predetermined price (called the strike price) before or on a specific date. Unlike shares, which give ownership, options only provide trading rights.
There are two main types of options:
Call Option – gives the right to buy.
Put Option – gives the right to sell.
The buyer of an option pays a premium, while the seller (or writer) receives the premium and must fulfill the contract if the buyer exercises it.

XAUUSD is skyrocketing after the Adam & Eve pattern!OANDA:XAUUSD is really interesting right now. The price seems likely to rise further after the formation of the Adam & Eve pattern. With such an easy-to-remember name, the Adam & Eve pattern is one of the most memorable. Below, I’ll explain the reasons and how to easily recognize it.
The Adam pattern is characterized by a sharp drop, followed by a quick recovery, forming a "V" on the chart. High, sharp, and aggressive! You could say it's more "masculine."
On the other hand, the Eve pattern develops more slowly. The price becomes more rounded, forming a wider and smoother base before rising again, creating a shape similar to the letter "U." Softer, more curved, and more "feminine."
Combining these two elements gives us the Adam & Eve pattern, which often signals a potential trend reversal. Especially when accompanied by fundamental analysis or other strong technical indicators.
This pattern will stick in your mind when you connect its shapes to the male and female aspects. A pattern that's truly hard to forget.

XAUUSD - GOLD - Trying to catch TOP is like chasing your crush# Here are the key factors currently supporting gold:
Momentum remains bullish:
#GOLD has gained as markets increasingly price in a potential Federal Reserve interest rate cut.
Gold continues to be regarded as a safe-haven and hedge asset. Amid economic uncertainty, inflation concerns, geopolitical risks, and sustained demand from central banks and investors, gold retains its primary drivers.
# Here are the key technical levels to watch over the next month:
According to recent chart data:
The immediate support region is approximately $4,110–$4,010, which serves as a pivot zone. A break below this level could lead to further downside toward $3,817–$3,683.
On the upside, a breakout above $4,282–$4,325 could pave the way for a move toward $4,450–$4,550.
Target-6
If the current bullish momentum persists and supportive fundamental conditions remain in place, gold may target the level marked as 6 on the chart.
#Here are the factors most likely to influence the movement of XAU/USD in the near future:
1. U.S. interest rates and Federal Reserve policy.
2. U.S. economic data and inflation figures.
3. Strength or weakness of the U.S. dollar: Since gold is priced in U.S. dollars, a weaker dollar typically supports higher gold prices.
4. Geopolitical risk and global uncertainty: Global instability, trade tensions, or major macroeconomic concerns often drive investors toward gold as a safe-haven asset.
Conclusion
Gold will remain strong as long as key support levels hold and market sentiment remains favorable. With momentum in its favor, any dips are likely to present buying opportunities, while a clean breakout could initiate the next leg higher.
~ Disclaimer ~
High Risk Investment
Trading or investing in assets like crypto, equity, or commodities carries high risk and may not suit all investors.
Analysis on this channel uses recent technical data and market sentiment from web sources for informational and educational purposes only, not financial advice. Trading involves high risks, and past performance does not guarantee future results. Always conduct your own research or consult a SEBI-registered advisor before investing or trading.
This channel, Render With Me, is not responsible for any financial loss arising directly or indirectly from using or relying on this information.

Gold Bulls vs Bears: Who Will Win the $4,100 Battle?🧭 Market Overview
Current Price Zone: Gold is trading near $4,141.27, slightly below recent highs around $4,200.
52-Week Range: From a low of $2,583.49 to a high of $4,381.60, indicating strong bullish momentum over the past year.
Recent Action: Price is consolidating between $4,040 and $4,080, suggesting a pause after a multi-month rally.
📊 Technical Indicators
Trend: Long-term bullish, but short-term momentum is neutral to slightly bearish.
Support Zones:
$3,987: 55-day SMA, acting as a dynamic support.
$3,886: Weekly low, a key horizontal support level.
Resistance Zones:
$4,245: November high, first major resistance.
$4,380: All-time high, ultimate bullish target.
Momentum Indicators:
RSI and MACD show weakening bullish momentum.
Stochastics and Williams %R suggest potential overbought conditions.
📐 Chart Analysis
Demand Zone: The grey rectangle around $4,173.23 likely marks a support area where buyers previously stepped in.
Stop-Loss Zone: The red rectangle below current price could represent a risk threshold for long positions.
Take-Profit Zone: The upper grey rectangle suggests a bullish target zone, possibly aligned with the $4,245–$4,380 resistance band.
Time Markers: Vertical red dashed lines may indicate key news events or session starts that influenced volatility.
🧠 Strategic Insights
Bullish Scenario: A breakout above $4,245 could trigger a run toward $4,380. Traders may look for confirmation via volume spikes or bullish candlestick patterns.
Bearish Scenario: A breakdown below $4,040 could expose the $3,987 and $3,886 supports. Watch for bearish divergence in momentum indicators.
Neutral Bias: Until price breaks out of the current range, scalping or range-bound strategies may be more effective than trend-following.
🛠 Trade Setup Suggestions
Entry: Consider entries near $4,100 if bullish signals emerge (e.g., bullish engulfing, MACD crossover).
Stop-Loss: Below $4,040 or $3,987 depending on risk tolerance.
Take-Profit: Target $4,245 initially, with extended targets at $4,380 if momentum continues.
🔍 Final Thoughts
Gold’s technical landscape is rich with opportunity but demands precision. The current consolidation phase is a battleground between bulls and bears. Traders should stay nimble, monitor macroeconomic cues (like Fed rate decisions), and adjust risk management accordingly.

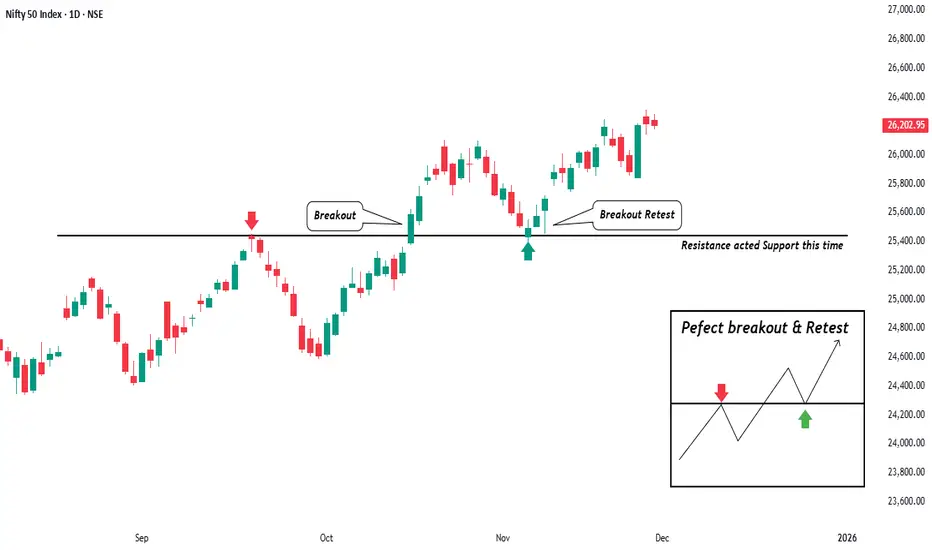
Breakout Retest Perfect PictureHello TradingView community, friends, and fellow traders.
I hope everyone is doing well with patience and clarity. Sharing a fresh price action observation on Nifty that clearly shows one of the most important concepts every trader should understand how the market behaves after a breakout.
On this chart, price had been facing repeated rejection from the same area, showing that it was a strong resistance zone. Sellers were clearly active at that level and price struggled to move higher. When price finally broke above this level with strength, it was the first sign that buyers were starting to take control.
What makes this setup valuable is not just the breakout itself, but what happened next. Instead of continuing straight upward, price came back to test the same area from above. This is the moment where most traders get confused, and many exit early or panic. In reality, this retest is the market checking whether the breakout was genuine or not.
When the old resistance starts acting as a support, it confirms something very important the market has accepted a new price range. This shift is known as role reversal, where selling pressure is replaced by buying interest. It also shows that buyers are now willing to defend the same level that sellers once controlled.
This is why breakouts should not be chased blindly. A breakout without confirmation often leads to false signals, but a breakout followed by a successful retest builds trust in the structure. The retest gives traders a chance to see whether the level holds and whether the trend is likely to continue.
As long as price remains above this support zone, the bias stays positive and the trend favors buyers. If price starts closing below this level, it would indicate weakness and failure of structure. The chart always gives clarity we just need to read it without emotion.
The biggest lesson here is patience. Markets reward those who wait for confirmation, not those who rush for entries. Breakout shows intention, but retest shows strength.
I hope this idea helps you see structure more clearly and trade with more confidence. Always remember, price action is not random. It tells a story, and every level has meaning if you know how to read it.
Wishing you all clarity, discipline, and consistency in your trading journey.
Trade safe and stay focused.
Regards- Amit.
BITCOIN is ready for ALL TIME HIGH !! Bitcoin is making Rising channel on a weekly timeframe
In which its making 5 wave structure
Also Bitcoin has given the breakout of Head and shoulder pattern, and BTC has achieved its Linear Target and now down 35%
Also while going up Bitcoin is making Rising channel
Both are indicating super bullish pattern in Bitcoin
In Rising channel, Bitcoin is making 5 wave structure and now last leg of Rising channel is coming around 148000/150000 range
Also Head and shoulder of pattern target (Log chart) is coming around 180000/190000
Bitcoing will achieve both the targets but let Bitcoin come around 150000 and then we can expect 190000 targets in months to come
For next 1 year, Expecting super bullishness in the Bitcoin
Thank You !!

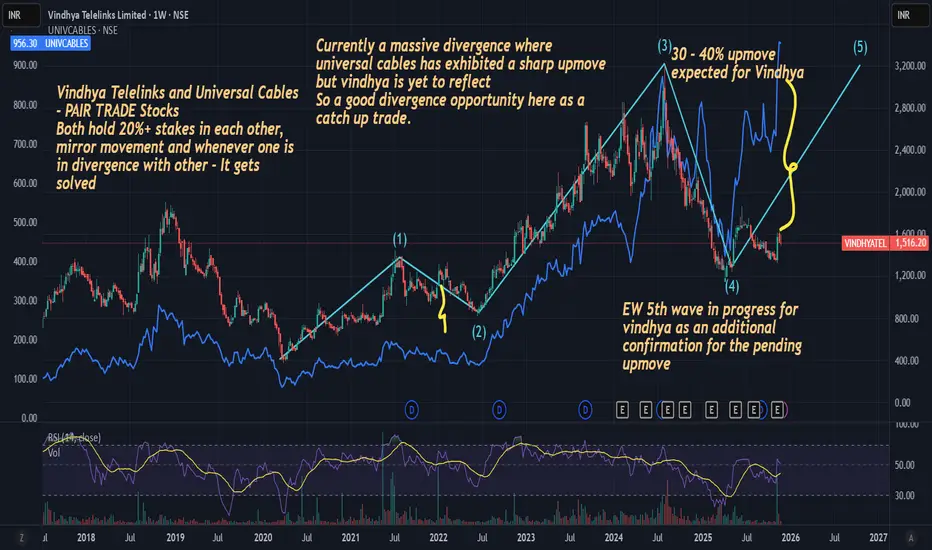
Vindhya Telelinks - Ripe for a Solid Upmove + A divergence playVindhya Telelinks has started with 5th EW wave, marking a last pending bull move for the stock
The Stock is also a pair trade play alongside another scrip Universal Cables. Both hold individual stakes in each other and have a long history of complementing moves together. Can check with the Chart
Here divergences between two are often created and stocks catch up with each other.
Currently Vindhya telelinks hasn't moved compared to Universal cable's move that's been done already.
Hence the EW 5th wave + divergence upmove is an additional confirmation for a strong 30-40% upmove from current levels.
NIFTY BLOW OFF TOP WITH GDP DATAI see nifty forming a blow off top on monday with the Gdp data of 8.2 of q2 ..
monthly, weekly, daily top open high same
Later falls by 18800 in the black wxy pattern forming bigger time frame wave a.
Even the last leg of uside forming diamteric bow tie pattern of neo wave theory..
ABCDEFG.. all are coming close to complete..
this December will be great to watch..
If it happen in the said time line then we are going to see a big bear market..
Welcome to 1929 again.. Fingers crossed..
* ONLY FOR TUTORIAL PURPOSE, DONOT TRADE ON THIS VIEW..

Part 9 Trading Master ClassRisks in Option Trading
1. High Losses for Option Sellers
Naked call sellers face unlimited loss potential.
2. Time Decay
An option loses value as it approaches expiry.
3. Complex Pricing
Options require understanding of volatility, Greeks, and probability.
4. Liquidity Problems
Illiquid options cause slippage and wide bid-ask spreads.
5. Emotional Trading
Fast-moving markets can cause panic among new traders.

Technical Analysis vs Fundamental Analysis1. Introduction
Financial markets are influenced by a vast network of economic, psychological, and structural forces. To understand price movements, one must either study the intrinsic value of an asset or analyze its price behavior. This is where fundamental and technical analysis come into play.
Fundamental analysis evaluates securities by examining economic, financial, and qualitative factors. Its purpose is to estimate the true value (fair value) of a stock, commodity, or currency.
Technical analysis, on the other hand, focuses solely on market data—primarily price and volume—to forecast future price movements. It assumes that all known fundamentals are already reflected in price.
2. What Is Fundamental Analysis?
Fundamental analysis studies the underlying factors influencing a company or economy. It aims to determine whether an asset is overvalued, undervalued, or fairly valued.
Key Components of Fundamental Analysis
a) Financial Statements
Investors examine:
Balance sheet (assets, liabilities, equity)
Income statement (revenue, net profit)
Cash flow statement (cash inflow/outflow)
These help measure profitability, leverage, growth, liquidity, and operational efficiency.
b) Economic Indicators
Macro factors influence overall market conditions:
GDP growth
Inflation
Interest rates
Employment data
Fiscal and monetary policy
For example, rising interest rates often reduce stock market returns.
c) Industry Analysis
Analyzing:
Industry growth rate
Competition
Market share
Regulatory environment
A strong company in a weak industry may still underperform.
d) Qualitative Aspects
These include:
Management quality
Corporate governance
Brand value
Innovation and product pipeline
Customer loyalty
Such factors often drive long-term performance.
e) Valuation Models
Popular methods include:
Discounted Cash Flow (DCF)
Price-to-Earnings (P/E) ratio
Price-to-Book (P/B) ratio
EV/EBITDA
Dividend Discount Model (DDM)
These help estimate fair value compared to the market price.
3. What Is Technical Analysis?
Technical analysis predicts future price movements based on historical market data such as price, volume, and market sentiment. It is commonly used by traders rather than long-term investors.
Key Components of Technical Analysis
a) Price Charts
Different chart types help visualize market patterns:
Candlestick charts
Line charts
Bar charts
Heikin-Ashi
Candlestick patterns like Doji, Hammer, and Engulfing reveal market psychology.
b) Indicators and Oscillators
Traders use mathematical tools to identify trends, strength, and reversals:
Moving Averages (MA)
RSI (Relative Strength Index)
MACD
Bollinger Bands
Stochastic Oscillator
Volume indicators
Each provides signals on market entry and exit.
c) Chart Patterns
Patterns help anticipate future price movements:
Head and Shoulders
Double Top/Double Bottom
Triangles
Flags and Pennants
Cup and handle
These patterns often repeat due to consistent human behavior.
d) Trend Analysis
One of the most important principles:
Uptrend (higher highs, higher lows)
Downtrend (lower highs, lower lows)
Sideways trend (range-bound market)
Traders follow the trend to reduce risks.
e) Support and Resistance
Key price zones where buying/selling pressure increases:
Support: where price tends to bounce up
Resistance: where price tends to fall back
Breakouts and breakdowns are major trading signals.
4. Philosophy Behind Both Analyses
Fundamental Analysis Philosophy
Market price does not always reflect true value.
Over time, price will converge toward intrinsic value.
Best for long-term investors who want to buy undervalued assets.
Technical Analysis Philosophy
Price discounts everything (news, emotions, fundamentals).
Price moves in trends.
Market psychology causes patterns that repeat over time.
Best for traders focusing on short to medium time frames.
5. Time Horizon Differences
Fundamental Analysis
Long-term approach (months to years)
Used by investors, mutual funds, and institutional players
Suitable for wealth creation
Technical Analysis
Short-term to medium-term (minutes to weeks)
Used by day traders, swing traders, scalpers
Suitable for frequent trading
6. Advantages and Limitations
A) Fundamental Analysis – Pros
Helps identify long-term investment opportunities
Provides deep understanding of a company
Works well for building wealth
Useful for identifying high-quality businesses
Fundamental Analysis – Cons
Time-consuming and complex
Markets can remain irrational longer than expected
Not effective for short-term trading
Sudden news/events can invalidate analysis
B) Technical Analysis – Pros
Helps with precise entry and exit timing
Works in all markets (stocks, forex, crypto, commodities)
Quick and efficient
Useful even without deep company knowledge
Technical Analysis – Cons
False signals are common
Over-reliance can lead to overtrading
Requires discipline and psychological control
Patterns may fail during high volatility
7. Which One Should You Use?
For Long-term Investors
Fundamental analysis is superior because it focuses on:
business strength
financial health
long-term growth potential
It helps identify companies that compound wealth over time.
For Short-term Traders
Technical analysis works better due to:
market-timing capabilities
entry/exit precision
chart-based signals
Short-term price movement is mostly driven by psychology, liquidity, and volatility—technical tools capture this better.
8. Combining Both Approaches (Best Practice)
Many professionals use a hybrid approach, known as Techno-Fundamental Analysis.
Example Strategy:
Use fundamental analysis to identify strong companies.
Use technical analysis to find the right entry point.
This method gives investors both quality and proper timing.
9. Conclusion
Technical analysis and fundamental analysis are powerful tools, each serving different purposes in trading and investing. Fundamental analysis focuses on understanding value, financial health, and long-term prospects of assets. Technical analysis emphasizes price behavior, market psychology, and timing of trades.
An ideal market participant should understand both; investors rely more on fundamentals, while traders depend heavily on technical tools. Combining both approaches enhances decision-making and offers the best balance of knowledge and timing—crucial for consistent success in financial markets.
Option Chain Analysis1. Understanding the Structure of an Option Chain
An option chain typically has two halves:
Left side → Call Options (CE)
Right side → Put Options (PE)
Each row corresponds to a strike price, and each strike shows several key data points:
Common Columns in CE & PE:
OI (Open Interest) – Total active contracts that are not yet closed.
Change in OI – Shows whether new positions are being built (addition) or squared off (reduction).
Volume – Number of contracts traded during the day.
LTP (Last Traded Price) – Price of the option premium.
Bid/Ask Prices – Best current buy and sell prices.
Implied Volatility (IV) – Market expectation of volatility.
The strike price sits in the center of the table, dividing Call and Put data.
2. Why Option Chain Matters
Option chain analysis allows a trader to:
✓ Identify trend direction
Increasing call writing may suggest bearish sentiment, while heavy put writing may suggest bullish sentiment.
✓ Spot support and resistance
High Put OI indicates strong support.
High Call OI indicates strong resistance.
✓ Understand market liquidity
Higher OI and volume mean more active participation and better entry/exit execution.
✓ Track institutional activity
Big spikes in OI usually represent large participants (FII, proprietary desks).
✓ Predict short-term price movements
Based on the balance between CE and PE data.
3. Key Components of Option Chain Analysis
A. Open Interest (OI)
(Open Interest is the heart of option chain analysis.)
Rising OI + rising price → Long Build-Up
Rising OI + falling price → Short Build-Up
Falling OI + rising price → Short Covering
Falling OI + falling price → Long Unwinding
These combinations provide clues about ongoing market activity.
B. Change in Open Interest
This tells you what is happening today.
Example:
If Put OI is rising fast, traders expect the market to stay above that strike → support.
If Call OI is rising sharply, traders expect resistance at that strike.
C. Option Premium and LTP Movement
Premiums often rise due to:
Trend strength
Increased volatility (IV)
Time remaining to expiry
Premiums collapse due to:
Trend reversal
Drop in IV
Time decay (theta)
D. Implied Volatility (IV)
IV reflects expected movement.
High IV → high uncertainty → expensive options
Low IV → low uncertainty → cheaper options
IV also jumps ahead of major events such as RBI policy, budget, US Fed meetings, elections, etc.
4. Identifying Support & Resistance from Option Chain
This is one of the most practical uses of option chain.
A. Finding Support Levels
Support is identified by:
Highest Put OI
Sharp increase in Put OI
Put writers actively defending a strike
Put writers (sellers) are usually strong hands, so they provide floor/ support.
For example:
If 22,000 PE has the highest OI, then 22,000 becomes strong support.
B. Finding Resistance Levels
Resistance is identified by:
Highest Call OI
Big Call OI additions
CE writers defending a strike
If 22,300 CE has the highest OI, then 22,300 becomes strong resistance.
5. PCR (Put-Call Ratio) Analysis
PCR is a sentiment indicator extracted from the option chain:
PCR = Total Put OI / Total Call OI
Interpretation:
PCR > 1 → bullish sentiment (more puts written)
PCR < 1 → bearish sentiment (more calls written)
PCR around 0.8–1.2 → neutral market
PCR extremes:
Around 1.5–1.8 → overbought (possibility of downtrend soon)
Around 0.5 or lower → oversold (possibility of uptrend)
6. OI and Price Action Combination
Combining price action with OI gives the highest accuracy.
Bullish Signs
Increasing Put OI at lower strikes
Decreasing Call OI
Price closing above major CE writing zones
PCR rising
Bearish Signs
Increasing Call OI at higher strikes
Heavy CE writing above spot
Price closing below major PE supports
PCR declining
Sideways Signals
Both CE and PE addition at surrounding strikes
Narrow PCR near 1.0
Option premiums decaying fast
7. Option Chain Traps and Short Squeezes
Option chain also reveals squeeze situations:
Short Squeeze (Bullish Explosion)
Heavy Call OI begins to unwind
Price breaks above resistance
CE writers forced to exit → premiums rise sharply
Long Liquidation (Bearish Slide)
Heavy Put OI unwinds
Price breaks below support
PE premiums shoot up
These moves are usually fast and violent.
8. How to Use Option Chain for Intraday Trading
Intraday traders use:
A. Change in OI (minute-by-minute)
This reveals immediate momentum.
B. Straddle & Strangle Levels
High combined premium = expected movement range.
C. ATM (At-the-Money) Behavior
If ATM call OI rises → bearish
If ATM put OI rises → bullish
D. Premium Breakout Zones
Sharp change in CE or PE premium suggests a trending move starting.
9. Expiry Day Option Chain Analysis
Expiry days are different because:
Time decay is extreme
OI changes rapidly
Range-bound behavior is common
On expiry:
Highest CE + PE OI combination often predicts the max pain level (where sellers profit the most)
Prices tend to gravitate around this level
10. Max Pain Theory
Max Pain = Strike price where option buyers lose maximum money.
It is calculated from the option chain.
On expiry day, price often moves toward max pain.
11. Option Chain for Swing and Positional Trading
Positional traders use:
Total OI across all strikes
IV trends
Monthly expiry data
Support/resistance based on long-term OI
If Put OI is high for next month → bullish for swing trades.
If Call OI dominates → bearish.
12. Mistakes Traders Make in Option Chain Reading
Only checking OI without price action
Ignoring IV changes
Misinterpreting unwinding phases
Trading without considering broader market events
Following high OI blindly without confirming by price behavior
Option chain should be combined with technical analysis for best results.
13. Practical Example Summary (How a Trader Should Use the Chain)
Identify highest PE OI → support
Identify highest CE OI → resistance
Analyze Change in OI → fresh positions being created
Check PCR → market sentiment
Observe IV → volatility expectations
Track premium movement → strength of buyers or sellers
Combine with price action to confirm trend
Final Thoughts
Option Chain Analysis is a vital skill for traders in index and stock derivatives. It reveals the psychology of option writers, helps identify crucial levels, indicates short-term momentum, and offers insights into market direction. When used properly along with charting tools, it significantly enhances accuracy in intraday, swing, and expiry trading.
A small correction likelyHerohonda CMP 6174
Gap - since runaway gaps form in the middle of the move, I have used the box to measure it on the right. The same height box on top of it is telling the rally is over.
Elliott- since wave 1 and wave 5 are generally equal, mkt geometry is telling the current highs is a potential strong resistance.
Composite- the oscillator under the MA cross is very negative. Which is confirming the resistance in price.
Conclusion - A three wave abc correction should bring the stock back to 5300. So we are taking about a 15% correction and thats not a lot considering its stupendous rise from the lows. The setup further confirms the correction that we are waiting for.

CAD/CHF Short term Sell IdeaAs per wave analysis, CAD/CHF looks bearish for short term for an target of 0.56810

Gold 4H – Can XAUUSD reject 4245 before diving into 4140?📈 Market Context
Gold rallied as the U.S. dollar closed softer on repriced Fed rate-cut expectations, with market headline flow confirming USD finishes lower and gold rallies on renewed cuts timing debates — a setup that encourages external liquidity raiding before weekly direction is revealed. Forex Factory
4H conditions are classic for liquidity engineering: price trades near balanced mid-range flows, institutions exploit USD weakness into weekly open, and both buyer/seller pools are vulnerable to strategic sweeping before expansion.
Expect volatility spikes around U.S. session opens and PMI headline catalysts.
🔎 Technical Analysis (4H / SMC View)
🟢 Buy Zone: 4140–4138
SL: 4130
TP targets: 4175 → 4200 → 4220 → 4250 → 4280+
Rationale:
• Discount zone beneath 4H liquidity shelf
• Demand mitigation + accumulation narrative after sweep
🔴 Sell Zone: 4245–4247
SL: 4255
TP targets: 4220 → 4200 → 4175 → 4150 → 4140
Rationale:
• Premium supply above equal-high liquidity
• 4H imbalance magnet below waiting to be filled
⚠️ Risk Management Notes
• Wait for M15 ChoCH / BOS confirmation before entries — avoid blind positioning.
• Expect wider spreads and wick manipulation on USD headline releases.
• Avoid trading 10–20 minutes before high-impact USD news (PMI, Fed speakers).
• Scale partials at each TP level, let runners work only after confirmation is printed.
Summary
Gold remains in 4H rangebound engineering territory where Smart Money is likely to sweep premium above 4245, deliver a correction to 4140, then seek a validated bullish reaction from discount demand on confirmed USD volatility.
Patience and confirmation first. Liquidity always wins.
🚀 Follow @Ryan_TitanTrader for more weekly SMC setups

Part 6 Learn Institutional TradingWhy Trade Options?
Options offer several strategic advantages:
a. Hedging
Investors use options to protect their portfolio. For example, buying a put option can insure against a fall in stock prices, similar to buying insurance.
b. Speculation
Traders can bet on price movements—up, down, or even sideways—using options.
c. Income Generation
Many traders sell options (covered calls, cash-secured puts) to earn regular premiums.
d. Leverage
Options allow control of large positions with a relatively small amount of capital.
