Liquidity Trading StrategiesUnderstanding How Smart Money Moves the Market
Liquidity trading strategies are built around one core idea: price moves toward liquidity. In financial markets, liquidity represents areas where large orders are resting—stop-losses, pending orders, breakout entries, and institutional positions. Unlike indicator-based trading, liquidity trading focuses on why price moves, not just how it moves. It attempts to align retail traders with the behavior of institutions, banks, and smart money participants who require liquidity to enter and exit large positions efficiently.
At its essence, liquidity trading recognizes that markets are not random. Large players cannot enter or exit positions at arbitrary prices because their order size would disrupt the market. Instead, they seek zones where sufficient opposing orders exist. These zones are typically found around previous highs and lows, equal highs and lows, consolidation ranges, trendline breaks, and psychological round numbers. Liquidity trading strategies aim to identify these areas in advance and trade the reaction when liquidity is taken.
The Concept of Liquidity in Financial Markets
Liquidity refers to how easily an asset can be bought or sold without significantly affecting its price. In trading terms, liquidity pools are clusters of orders that accumulate in predictable locations. Retail traders often place stop-losses below recent lows in an uptrend or above recent highs in a downtrend. Breakout traders place buy stops above resistance and sell stops below support. These collective behaviors create visible liquidity in the market.
Institutional traders deliberately target these liquidity pools. When price approaches a known liquidity area, it often accelerates, not because of genuine supply and demand imbalance, but because stops are being triggered. Once liquidity is absorbed, price frequently reverses or rebalances, revealing the true market intent.
Types of Liquidity Zones
Liquidity trading strategies revolve around identifying high-probability liquidity zones. The most common types include:
Equal Highs and Equal Lows
When price forms multiple highs or lows at the same level, it signals resting liquidity. These areas attract stop orders and breakout entries. A liquidity sweep occurs when price briefly moves beyond these levels, triggers orders, and then reverses sharply.
Previous Day, Week, and Month Highs/Lows
Higher time frame highs and lows are major liquidity magnets. Many traders reference these levels for stop placement, making them ideal targets for institutional order execution.
Trendline Liquidity
Obvious trendlines attract retail participation. Institutions often push price beyond a trendline to trigger stops before resuming the primary direction.
Range Highs and Lows
In consolidating markets, liquidity builds on both sides of the range. False breakouts above or below the range are classic liquidity grabs.
Psychological Levels
Round numbers such as 1.2000 in forex or 20,000 in indices hold significant liquidity due to human bias and algorithmic order clustering.
Liquidity Sweeps and Stop Hunts
A liquidity sweep, often referred to as a stop hunt, occurs when price deliberately moves into a liquidity zone, triggers stop-loss orders, and then reverses direction. Contrary to popular belief, stop hunts are not malicious actions against retail traders. They are a natural consequence of how large participants execute orders.
Liquidity sweeps are characterized by:
Sharp, aggressive price movement into a key level
Long wicks or rejection candles
Sudden increase in volatility
Failure to continue beyond the liquidity zone
Liquidity traders wait for confirmation that the sweep has occurred before entering a trade, rather than anticipating the sweep itself.
Market Structure and Liquidity
Liquidity trading is most effective when combined with market structure analysis. Market structure helps determine whether liquidity is being targeted for continuation or reversal.
In an uptrend, liquidity below higher lows may be taken to fuel continuation. In a downtrend, liquidity above lower highs serves the same purpose. Reversals typically occur when price takes liquidity against the prevailing trend and fails to continue, signaling a shift in order flow.
Understanding structure allows traders to distinguish between:
Liquidity grabs for continuation
Liquidity grabs for reversal
This distinction is critical for risk management and trade selection.
Entry Techniques in Liquidity Trading
Liquidity trading strategies do not rely on blind entries at key levels. Instead, traders wait for confirmation through price action. Common entry models include:
Liquidity Sweep + Rejection
After price sweeps a high or low, traders look for strong rejection signals such as pin bars, engulfing candles, or strong displacement in the opposite direction.
Break and Retest after Liquidity Grab
Price takes liquidity, breaks market structure, and then retests the broken level. This retest provides a low-risk entry aligned with smart money direction.
Lower Time Frame Confirmation
Higher time frame liquidity zones are refined using lower time frame structure, allowing precise entries with tight stop-losses.
Risk Management in Liquidity Trading
Risk management is a non-negotiable component of liquidity trading strategies. Because liquidity grabs can be volatile, traders must control risk carefully.
Effective practices include:
Placing stop-losses beyond the liquidity zone, not inside it
Risking a fixed percentage per trade (typically 0.5%–2%)
Avoiding overtrading during high-impact news events unless experienced
Accepting that not all liquidity sweeps result in reversals
Liquidity trading often delivers high reward-to-risk ratios, but patience and discipline are essential.
Time Frames and Liquidity
Liquidity exists on all time frames, but higher time frame liquidity carries more significance. Institutional traders prioritize daily, weekly, and monthly liquidity zones, while intraday traders may focus on session highs and lows such as London or New York session ranges.
Aligning multiple time frames increases probability. For example, a liquidity sweep at a weekly high confirmed by a lower time frame reversal pattern offers a stronger setup than an isolated intraday sweep.
Psychological Edge of Liquidity Trading
One of the greatest benefits of liquidity trading strategies is psychological clarity. Instead of reacting emotionally to sudden price spikes, liquidity traders expect volatility at key levels. This mindset reduces fear, prevents chasing trades, and builds confidence.
By understanding that price movement is often engineered to collect liquidity, traders stop interpreting losses as personal failures and start viewing them as part of a structured market process.
Conclusion
Liquidity trading strategies provide a powerful framework for understanding market behavior beyond indicators and lagging signals. By focusing on where orders are clustered and how institutions seek liquidity, traders gain insight into the true drivers of price movement. These strategies require patience, precision, and a deep respect for risk management, but when applied correctly, they offer consistent, logical, and repeatable trading opportunities.
In modern markets dominated by algorithms and institutional flow, liquidity is the real currency. Traders who learn to read liquidity are no longer chasing price—they are trading with intent, structure, and smart money alignment.
Wave Analysis

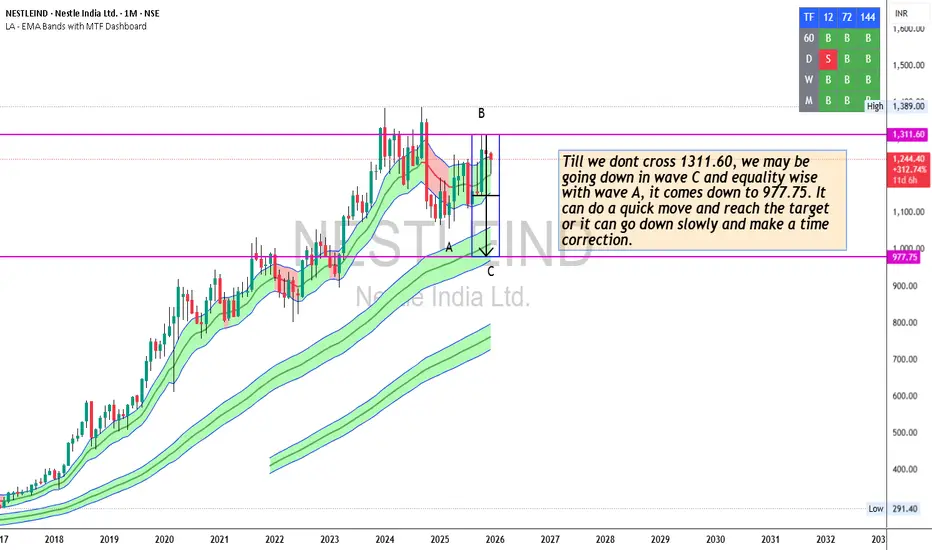
NESTLEIND - can go down to 977 if 1311 is not crossedTill we don't cross 1311.60, we may be going down in wave C and equality wise with wave A, it comes down to 977.75. It can do a quick move and reach the target or it can go down slowly and make a time correction.
Weekly view
Daily View
Why Syngene International is a Long-Term Growth Play!Syngene International isn’t just another stock — it’s one of India’s leaders in integrated CRDMO (Contract Research, Development & Manufacturing) services, powering global pharma, biotech & biotech innovation. 💡
syngeneintl.com
📊 Bullish fundamentals ahead:
✔️ Earnings & revenue projected to grow ~14–18% per year — strong compound growth potential.
Simply Wall St
✔️ Analysts project a 12-month price target with upside potential, with high estimates near ₹840.
Investing.com India
✔️ Stock trading at a fair valuation with intrinsic value models suggesting room to run long-term.
Smart Investing
🚀 Strategic growth catalysts:
• Global outsourcing trend — Big Pharma is increasingly outsourcing R&D and manufacturing, boosting demand for players like Syngene.
AnytimeInvest
• Expansion of biologics and advanced product capabilities through facility upgrades.
syngeneintl.com
• Long track record of partnerships with global industry leaders.
Wikipedia
💡 What this means:
Syngene’s focus on scalable science services and future-oriented growth areas like biologics make it a compelling pick for investors with a 3–5 year horizon. Plan ahead, stay informed, and let innovation lead the way! 🔎💼
#Stocks #Investing #IndianMarkets #PharmaGrowth #LongTermWealth

Updated Nifty Analysis for Dec 19, 2025Wrap-up:
In wave 2 of Major wave 1, Nifty forming a wxy pattern. Wave w has been completed at 25318 and wave x at 26325 and wave y is in progress of which a is completed at 25891 and wave b is in progress.
In wave b, inner wxy pattern is formed and wave w is completed at 26098 and and wave x is in progress. In wave x, again wxy is formed in which w and x are completed and y is in progress.
In wave y, a is completed at 25904 and b is in progress which is expected to be completed in the range of 25908-26012. Thereafter, Nifty will head towards c.
What I’m Watching for Dec 19, 2025 🔍
Short nifty 25908-26012 sl 26058 for a target of 25565-25469.
Disclaimer: Sharing my personal market view — only for educational purpose not financial advice.

TCS - Swing Trade Setup📌 TCS — Elliott Wave Outlook: Possible Wave 4 Bounce Before Wave 5 Decline
TCS is currently trading near a critical zone where the earlier ABC corrective structure has already been completed. Price action is now approaching a region where structural deviation may occur.
From an Elliott Wave perspective, if the price breaks above the ABC completion zone, it can indicate the development of an intermediate Wave 4. Such Wave-4 formations typically retrace a portion of Wave 3, often creating a temporary relief rally within the broader structure.
However, unless the trend fully reverses, this Wave 4 bounce can remain corrective in nature. After completing Wave 4, the chart suggests that TCS may resume its decline to form Wave 5, thereby completing the higher-degree Wave B or Wave 2 within the Primary Wave Structure.
Key Technical Notes:
ABC corrective structure appears completed.
Breaks above the completion zone increase the probability of a corrective Wave 4 rally.
Wave 5 may unfold afterward, potentially completing Primary Wave B/2.
Trend confirmation should be based on hourly closes and price behavior near key Fib retracement zones.
What to Watch:
Price reaction near the ABC completion zone
Whether a structured Wave 4 bounce forms or price rejects sharply
Hourly close levels for confirmation
Volume behavior on the bounce or breakdown
Educational Insight:
Wave 4 rallies are often misleading for new traders—they may appear as reversals but are usually corrective. Always assess whether structure supports continuation before assuming a trend shift.
Conclusion
TCS is at a structural turning point. A break above the ABC completion region may trigger a Wave 4 relief move, but unless higher-degree resistance breaks convincingly, the larger structure still supports a potential Wave 5 decline to complete the primary correction.
Disclaimer:
I am not a SEBI-registered analyst. This analysis is for educational purposes only. Always perform your own research or consult a financial advisor before making trading decisions.

Nifty Analysis for Dec 19, 2025Wrap-up:
Nifty again made low of 25726 and did not sustain above 25876. Thereafter, Nifty breaks 38.20% level which is at 25852 and sustain also. Therefore, Wave 2 is completed at 25726 and now, Nifty will head towards wave 3.
What I’m Watching for Dec 19, 2025 🔍
Buy nifty above 25852 sl 25725 for a target of 26012-26090-26174-26315.
Disclaimer: Sharing my personal market view — only for educational purpose not financial advice.

HINDUNILVR: Smart Money Accumulation Zone After CHoCH?📘 HINDUNILVR (HUL) — Technical Analysis | Structure Shift & Golden Retracement Setup
(Timeframe: Daily)
HINDUNILVR is currently trading around ₹2,265 after a prolonged corrective phase.
The chart reflects a Change of Character (CHoCH) followed by a controlled retracement into a high-probability demand zone, where the next directional move is likely to emerge.
🔍 Market Structure & Price Action
The stock previously witnessed a strong bullish extension, reaching the 113%–128% Fibonacci extension zone, indicating an overextended move.
Post extension, price showed loss of bullish momentum, leading to a CHoCH — a clear signal of shifting market control.
CHoCH highlights early trend transition and often leads to range-bound or corrective price action, rather than an immediate trend reversal.
📌 CHoCH helps traders prepare for structural transitions before confirmation from higher highs.
📐 Fibonacci & Wave Context
The decline from point A to B appears corrective, not impulsive.
Price has now entered the Golden Retracement Zone (50%–78%) of Wave A.
This zone is typically where Wave B or Wave 2 attempts to develop.
Institutional participants often accumulate positions here due to favorable risk–reward.
📌 Failure to hold this zone often results in a deeper correction or trend reversal.
🎯 Key Levels from the Chart
Major Demand Zone: ₹2,230 – ₹2,200
Invalidation Level: Day close below ₹2,200
First Target: ~₹2,630 (≈ 78% retracement of Wave AB)
Second Target: ₹2,826 – ₹2,888
🧭 Trading Strategy (Swing / Positional)
Look for long opportunities only inside the ₹2,230–₹2,200 zone.
Prefer confirmation signals such as:
– Bullish rejection wicks
– Higher-low formation
– Minor CHoCH on lower timeframes
Avoid aggressive entries without confirmation.
🛑 Risk Management
Strict stop loss: Day close below ₹2,200
A close below this level indicates weak demand and opens the risk of extended downside correction.
Partial profit booking recommended near Target 1.
Trail stop aggressively if price sustains above ₹2,630.
📚 Educational Notes
Golden Retracement (50%–78%) is where institutions seek value-based entries.
CHoCH ≠ Trend Reversal — it signals momentum loss, not instant bearishness.
Confirmation always comes from structure + demand holding, not prediction.
🔮 Probable Scenarios
Bullish Case:
Holding above ₹2,200 → Base formation → Gradual recovery toward ₹2,630 → ₹2,826–2,888.
Bearish Case:
Day close below ₹2,200 → Demand failure → Deeper corrective phase.
📌 Conclusion
HINDUNILVR is positioned at a critical inflection zone.
Risk is clearly defined, while upside potential remains asymmetric.
This is a wait-for-confirmation accumulation setup, not a chase trade.
⚠ DISCLAIMER
I am not a SEBI-registered analyst.
This analysis is for educational purposes only and should not be considered investment advice.
Always use your own analysis and risk management.

Bank of Japan Policy Decision: Global Market Impact AnalysisBank of Japan Interest Rate Decision (December 19)
Introduction : Why Japan’s Interest Rate Policy Matters
Japan’s monetary policy plays a critical role in the global financial system. For decades, the Bank of Japan (BoJ) maintained ultra-loose conditions, turning the Japanese yen into the world’s primary funding currency. Global investors borrow cheaply in JPY and deploy capital into higher-yielding assets such as equities, bonds, and cryptocurrencies.
Because of this structure, even a small shift in BoJ policy can trigger large cross-market reactions. The BoJ’s interest rate decision on December 19 is therefore a high-impact macro event with potential consequences for forex, global equities, bonds, gold, and crypto markets.
Scenario 1: If the Bank of Japan Raises Interest Rates
A rate hike would represent a historic policy shift and signal the early stages of monetary normalization.
Impact on Forex (USD/JPY & JPY Pairs)
* The Japanese yen (JPY) is likely to strengthen due to improved yield appeal
* USD/JPY may face strong bearish pressure
* Carry trades funded in JPY could unwind rapidly, increasing volatility
JPY crosses such as EUR/JPY, GBP/JPY, and AUD/JPY may also decline as risk exposure is reduced.
Impact on Global Equity Markets
* Japanese equities: Mixed to bearish bias due to a stronger yen hurting exporters
* Asian markets: Short-term weakness as financial conditions tighten
* US & European equities: Increased volatility and pressure on growth stocks
Overall, a rate hike may trigger a short-term global risk-off reaction driven by liquidity repricing rather than economic deterioration.
Impact on Crypto Markets (Bitcoin & Altcoins)
* Bitcoin: Short-term bearish pressure and higher volatility
* Altcoins: Likely underperformance due to higher risk sensitivity
* Macro-driven selling could create longer-term accumulation zones once volatility settles
Impact on Bonds, Gold & Risk Sentiment
* Bonds: Japanese and global yields may rise
* Gold: Short-term pressure from higher yields, medium-term support if risk aversion increases
* Risk sentiment: Shift toward defensive positioning and reduced leverage
Scenario 2: If the Bank of Japan Does NOT Raise Interest Rates
If rates remain unchanged, markets may view the decision as continued policy caution.
Expected Market Reactions
* JPY: Continued weakness
* USD/JPY: Bullish continuation
* Global equities & crypto: Supported by ongoing liquidity
* Risk sentiment: Risk-on behaviour likely to persist
Short-Term vs Medium-Term Outlook
Short-Term
* Rate hike: Sharp volatility, risk-off moves
* No hike: Relief rally in risk assets
Medium-Term
* Gradual tightening allows controlled market adjustment
* Continued loose policy supports assets but increases structural risks over time
Markets typically shift from news reaction to trend confirmation within weeks.
Educational Entry–Exit Examples (Not Financial Advice)
USD/JPY (Rate Hike):
* Bias: Bearish
* Concept: Breakdown → pullback → continuation
* Invalidation: Above recent swing high
Bitcoin (No Hike):
* Bias: Bullish
* Concept: Pullback after impulse
* Risk Note: Reduced size during news volatility
US Indices:
* Rate hike: Sell rallies near resistance
* No hike: Buy dips in confirmed trend
Conclusion: Key Takeaways for Traders
The Bank of Japan’s December 19 interest rate decision is a major global liquidity event. A rate hike would favour the yen while pressuring risk assets, whereas a no-change policy would support equities, cryptocurrencies, and carry trades. Traders should prioritise volatility management, confirmation from price action, and cross-market correlations over predictions and forecasts.
Stay tuned!
@Money_Dictators
Thank you :)

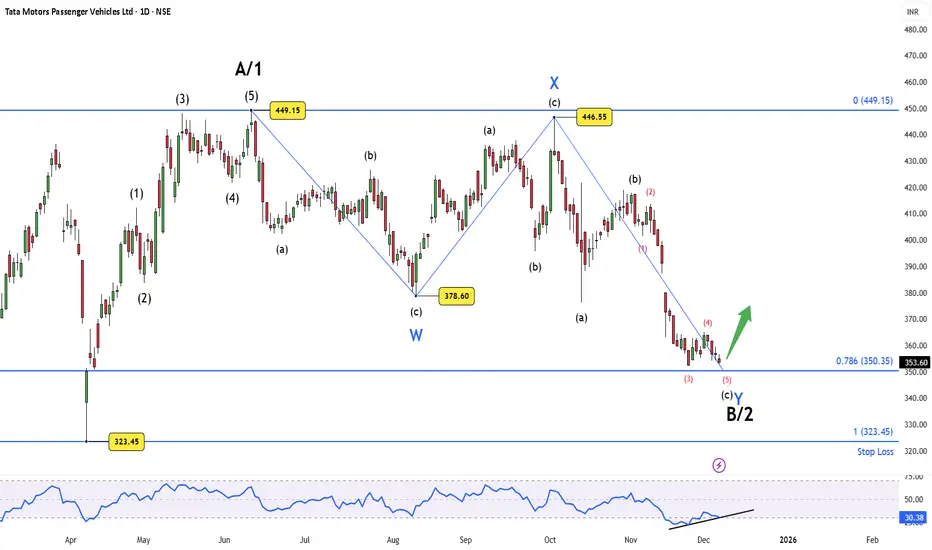
Tata Motors PV – Wave B/2 Near Completion, Bounce Zone ActivatedThe ongoing decline appears to be unfolding as a complex corrective structure, with Wave C of the larger Wave B/2 now approaching its typical termination area. Price has reached the 0.786 Fibonacci support at ₹350.35 — a level where deeper corrective phases frequently exhaust themselves.
Structurally, the final leg of Wave C shows a clear five-wave micro pattern, and downside momentum has begun to fade. The RSI is printing early bullish divergence, suggesting that sellers are losing strength even as price tests fresh lows. This combination often precedes a relief bounce within the broader framework.
As long as the price respects ₹323.45, this corrective interpretation remains valid and a bounce from the current zone is the preferred expectation. A decisive close below the invalidation level would signal that the correction is not yet complete and that a deeper retracement is unfolding.
Disclaimer: This analysis is for educational purposes only and does not constitute investment advice. Please do your own research (DYOR) before making any trading decisions.
gift nifty channel breakoutafter too long consolidation phase gift gave a positive breakout on hourly bases.. tomorrow any deep comes its an opportunity to take entry for long...

Updated Short term View for Nifty till January, 2026Wrap up:-
Earlier I mention that wave 5 is still in progress. But some counts i wrongly calculated. Now, wave 5 of Major wave1 is completed at 26104 and wave 2 is in progress. In wave 5, Nifty has made wxy pattern. Wave w has been completed at 25153 and wave x at 24587 and wave y at 26104.
In wave 2 of Major wave 1, Nifty again forming a wxy pattern. Wave w has been completed at 25318 and wave x at 26325 and wave y is in progress of which a is completed at 25891 and wave b is in progress.
Short Nifty below 25693 sl 26058 for a target of 24365-23949 till december, 2025 or mid of January, 2026.
Disclaimer: Sharing my personal market view — only for educational purpose not financial advice.

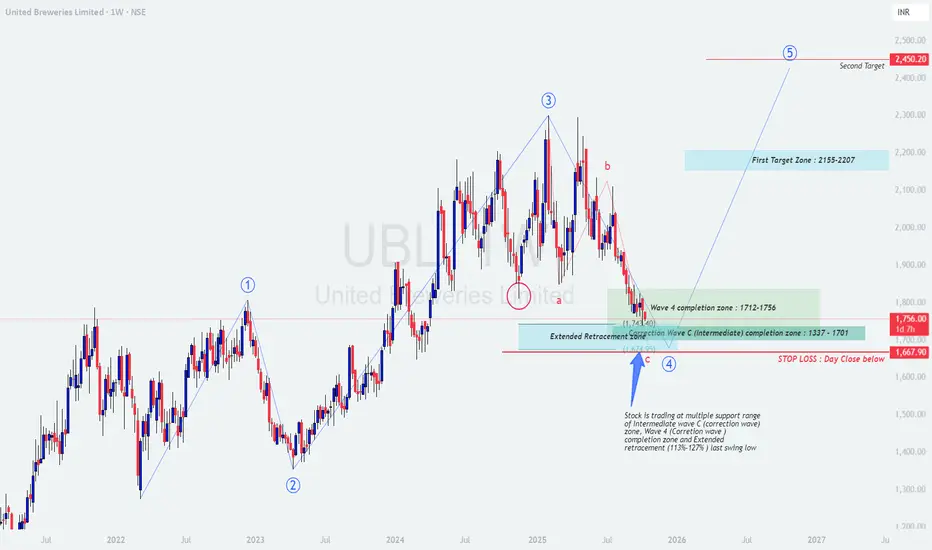
UBL (United Breweries) – Weekly Swing Trading PlanUBL (United Breweries) – Weekly Swing Trading Plan (Educational)
Structure overview
Price has completed a multi‑month corrective leg into a confluence support cluster: Wave‑4 completion zone 1712–1756 overlaps with the projected Wave‑C (intermediate) completion band 1701–1337 and the extended retracement window from the last swing 113%–127%. The market is attempting to base near this cluster with downside risk defined by the recent swing low.
Bias is accumulation-to-reversal as long as price holds above the invalidation level; confirmation improves on weekly higher low and break of the prior supply shelf.
Levels and plan
Buy zone (staggered): 1712–1756 for initial probes; add on confirmation above 1785–1800 on daily close.
Invalidation / Stop: Weekly or daily close below 1668 (recent low zone). If that fails, expect deeper extension into 1630/1600; stand aside and reassess.
Trigger confirmation: Bullish weekly candle with RSI/MACD positive cross or a daily structure break above 1825–1850 accompanied by rising volume.
First target zone: 2155–2207 (prior supply/FE confluence). Scale out 50–70% in this band.
Second target: 2450 area (projected Wave‑5/FE 1.0–1.272). Trail remainder using weekly higher‑low method.
Risk‑to‑reward: From a 1735 midpoint entry with 1668 stop, risk ≈ 67 points; to T1 midpoint 2180, reward ≈ 445 points (R≈6.6). Adjust to your execution.
Execution notes
Start with partial size in the zone; add only on strength (close back above broken EMAs or structure).
If price spikes into 1712–1756 and rejects with long lower wicks, use the next day’s high break as the tactical trigger.
If price closes below 1710 but recovers the next session and re‑enters the band, treat it as a bear trap only with clear momentum confirmation.
Trail stops to breakeven after a daily close above 1850; shift below each higher swing low on the way to T1.
Option tactics (if using derivatives)
Bull call spread when cash closes above 1825–1850: e.g., buy ATM call, sell +200 to +300 OTM to cap cost and decay.
For accumulation within 1712–1756, consider a calendar call to benefit from time if expecting a slower turn.
Exit or roll if price loses 1710 decisively; do not hold naked longs through invalidation.
Risk management
Position sizing : Risk a fixed % of equity per idea (commonly 0.5–1%) based on the distance to 1668.
Staggered entries reduce timing risk; never add if invalidation is threatened.
Respect weekly closes; a weekly close below 1668 cancels the bullish thesis until a fresh base forms.
Summary
Thesis: Corrective Wave‑C likely terminating around 1712–1756, setting up a potential Wave‑5 advance if 1668 holds.
Plan: Accumulate in 1712–1756, confirm above 1825–1850, aim T1 2155–2207 and T2 ~2450, with invalidation on a daily/weekly close below 1668.
Disclaimer: This post is for education, not investment advice or a trade recommendation; I am not a SEBI registered analyst .
NIFTY : Trading levels and Plan for 19-Dec-2025📘 NIFTY Trading Plan for 19-Dec-2025
(Chart reference: 15-min | Gap criteria considered: 100+ points)
Important Levels from Chart
Opening Resistance: 25,848
Last Intraday Resistance: 25,923 – 25,951
Upper Target / Supply: 25,985
Opening Support (No-Trade Zone): 25,763 – 25,814
Last Intraday Support: 25,677 – 25,703
Extreme Support: 25,594
🟢 1. GAP-UP OPENING (100+ Points)
If NIFTY opens above 25,848, it directly enters the overhead resistance structure.
🎓 Educational Explanation:
A gap-up opening indicates overnight positive sentiment, but price often reacts near prior supply zones due to profit booking. Professional traders avoid chasing and instead wait for acceptance above resistance or a healthy retest.
Plan of Action:
Sustaining above 25,848 for 10–15 minutes can allow pullback-based long entries.
First upside hurdle is 25,923–25,951 (last intraday resistance zone).
Acceptance above 25,951 may extend the move toward 25,985.
Rejection or exhaustion near 25,923–25,951 can trigger a pullback toward 25,848.
Option buyers should prefer ATM/ITM Calls only after confirmation; avoid buying at the opening spike.
🟡 2. FLAT OPENING
A flat open near 25,800–25,830 places NIFTY inside the Opening Support / No-Trade Zone.
🎓 Educational Explanation:
Flat opens represent market indecision. During such phases, price tends to trap early buyers and sellers. Direction becomes clear only after a range breakout or breakdown, making patience crucial.
Plan of Action:
Break and sustain above 25,848 shifts momentum toward 25,923–25,951.
Failure to cross 25,848 keeps price vulnerable to a downside test.
Breakdown below 25,763 opens downside toward 25,703–25,677.
Watch for bullish reversal patterns near 25,763–25,814 for bounce trades.
🔴 3. GAP-DOWN OPENING (100+ Points)
If NIFTY opens below 25,763, selling pressure may dominate early.
🎓 Educational Explanation:
Gap-down openings are often driven by fear. However, strong historical demand zones usually attract buyers looking for value, leading to short-covering bounces. Selling blindly at support increases risk.
Plan of Action:
First demand zone to observe is 25,703–25,677; look for rejection or base formation.
A bounce from this zone can retrace toward 25,763–25,814.
Sustained breakdown below 25,677 exposes the 25,594 level.
Any pullback toward 25,763 after breakdown becomes a selling-on-rise opportunity.
⚙️ Risk Management Tips for Options Traders 🛡️
Avoid trading in the first 5–10 minutes during gap days.
Do not buy options near resistance or sell near support—wait for confirmation.
Use time-based stop-loss (15–20 minutes) if the premium fails to move.
Risk only 1–2% of total capital per trade.
Prefer ATM options or vertical spreads to manage theta decay.
Book partial profits near marked resistance/support zones.
🧾 Summary & Conclusion
Above 25,848: Bulls stay active with targets 25,951 → 25,985.
Between 25,763–25,848: Market remains range-bound; patience is key.
Below 25,763: Sellers gain control unless buyers defend 25,703–25,677.
Focus on price behaviour at levels, not prediction.
Consistency comes from discipline, not frequent trades.
⚠️ Disclaimer
I am not a SEBI-registered analyst. This trading plan is for educational purposes only and should not be considered financial or investment advice. Please consult your financial advisor before taking any trades.

Nifty 1hrs timeframe wave analysis Nifty 1hrs time frame wave analysis.
Nifty trades in corrective waves as WXYXZ. The WXYX wave has completed and the Z wave is in progress. Price will trade below 25946 until it breaks the previous low of 25700 and completes the Z wave here. As soon as the complex correction is complete, a new impulse wave will emerge from here and create a new high.
Thanks
MKT Learner
Disclaimer
Here is my analysis, which I am sharing for educational purposes only

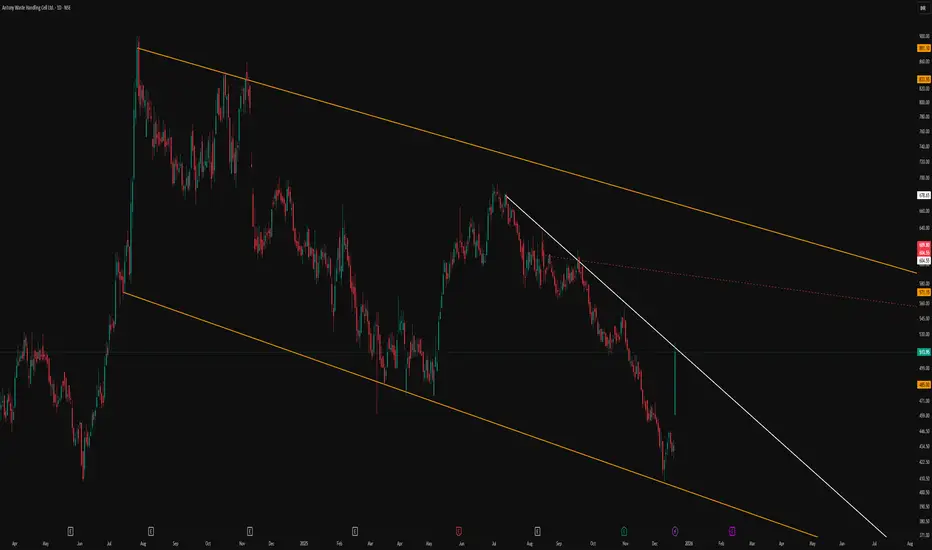
Classic Descending Channel With Clear Structural LevelsThe primary feature of this chart is the broad descending parallel channel marked by the orange lines, which frames the entire corrective phase in a neat, orderly manner. Price has repeatedly respected both the upper and lower boundaries, reinforcing the relevance of this channel as a dominant structure.
A trend‑changing resistance line is drawn in white, connecting swing highs and visually separating the prevailing downtrend from any potential shift in behavior. This line serves as a clear reference for how price has reacted to supply zones within the channel, without implying any future breakout or directional bias.
The red dotted line acts as an internal, hidden line derived from prior price interaction, helping to map out the internal rhythm of the move. Overall, the chart is intended purely as a structural illustration of how price respects channels and internal reference lines, without any forecast or trade signal.
Elliott Wave Analysis – XAUUSD December 18, 2025
1. Momentum Analysis
Daily (D1)
Daily momentum is showing early signs of a bearish reversal. However, confirmation is still required by waiting for today’s D1 candle close.
If the reversal is confirmed, this would suggest that Wave X is topping, and price is likely to move lower following D1 momentum to complete Wave Y.
H4
H4 momentum is currently declining. In the near term, this suggests:
- A corrective decline on H4, or
- Sideway consolidation until H4 momentum reverses back to the upside
H1
H1 momentum is showing signs of a bullish reversal, indicating:
- A potential short-term upward move, or
- Continued sideways movement within a tightening range
2. Elliott Wave Structure
Daily (D1)
The D1 wave structure remains largely unchanged from the previous plan.
However, with D1 momentum weakening and starting to reverse, the probability of a Wave X top forming within today or the next few sessions is increasing.
H4
On H4, price may still be developing Wave 5 (blue) of Wave C (red) within the larger Wave X structure.
Given that the D1 structure resembles a Flat pattern, a move toward or equal to Wave 3 high near 4396 remains a realistic scenario.
H1
Within Wave 5 (blue), we can observe an internal 5-wave structure (red).
At this stage, price may be forming:
- Wave 4 (red), or
- Wave 5 (red), depending on upcoming price behavior
Current advances are:
- Overlapping
- Lacking clear impulsive strength
When combined with declining H4 momentum, this leads to two primary scenarios.
3. Main Scenarios
🔹 Scenario 1: Wave 4 Triangle
Price remains in Wave 4, developing a triangle structure.
In this case:
- Wave d is likely complete
- Price is currently forming Wave e
📌 The expected termination zone for Wave e:
- Aligns with a bullish reversal in H4 momentum
- Converges with the lower boundary of the triangle
From Volume Profile analysis:
- Price is currently trading around the POC (Point of Control), which also aligns with the Wave 3 top
- Below, the 4301 zone represents a key liquidity boundary → this is the primary expectation for Wave e completion
- Further below, 4271 marks a strong High–Low volume boundary
⚠️ A daily close below 4271 would significantly increase the probability of a deeper bearish scenario.
🔹 Scenario 2: Wave 5 (Red) – Ending Triangle
Another high-probability scenario is that price is currently within Wave 5 (red).
This Wave 5 may be forming an Ending Triangle with an internal 5-wave black structure.
Key characteristics:
- Gradually rising price
- Strong overlap
- Weakening momentum
In this scenario:
- Price should remain supported above the current POC
- A final push higher toward 4365 is expected
- Completion of Wave 5 would likely be followed by a sharp and steep bearish move, which is typical after an ending triangle
📌 This scenario requires additional price confirmation, and updates will be provided as structure becomes clearer.
4. Trading Plan
Buy Zone: 4302 – 4300
Stop Loss: 4290
Take Profit Targets:
TP1: 4332
TP2: 4365
TP3: 4393

Nifty Analysis for Dec 18, 2025Wrap-up:
Nifty again made low of 25770 and did not sustain above 25915. Therefore, Wave 2 counts have been changed and is treated as completed once nifty breaks and sustains above 25876. Thereafter, Nifty will head towards wave 3.
What I’m Watching for Dec 18, 2025 🔍
Buy nifty above 25876 sl 25770 for a target of 26012-26134-26174.
Disclaimer: Sharing my personal market view — only for educational purpose not financial advice.

LIC of India – Double CorrectionDear Trader,
It appears that LIC of India is currently undergoing a double correction pattern. From 9 July 2025 (₹977) to 29 August 2025 (₹850), the price declined in a clear three-wave structure, which we can mark as Wave W.
Following this, from 29 August 2025 to 7 November 2025, the stock rebounded to ₹932, retracing approximately 61.8% of the prior decline. This retracement is typical behavior for a Wave X.
Since then, the price has resumed its downward trajectory. Based on Elliott Wave analysis, the ongoing move is likely forming Wave Y, with potential downside targets at:
- ₹835
- ₹816
- ₹808
These levels represent probable completion zones for Wave Y within the corrective structure.
Conclusion:
Traders should monitor price action closely as LIC approaches these support levels, which may provide opportunities for reversal or continuation depending on broader market conditions.

Shiba inu prediction today As of **December 18, 2025**, **Shiba Inu (SHIB)** trades at approximately **$0.0000075–$0.0000078 USD**, reflecting a **downward trend** with a roughly **4–5% decline** over the past 24 hours and broader weekly losses around **7–9%**.
### Current Market Status
- Live prices from major trackers (e.g., CoinMarketCap, CoinGecko, and recent updates) hover around **$0.0000075–$0.0000078**, with a market cap near **$4.4 billion**.
- Trading volume remains active but in a bearish broader crypto market context, with sentiment indicators showing **extreme fear**.
### Short-Term Prediction for Today
Analysts and technical indicators suggest **continued downward pressure or sideways consolidation** in the very short term (today/intraday).
- Many forecasts point to potential further dips before any rebound, with resistance levels around **$0.000008** and support near **$0.000007**.
- Short-term models (e.g., from CoinCodex and others) predict minor declines or flat movement today, potentially testing lower supports if broader market weakness persists.
- No major catalysts (like significant burns or announcements) appear imminent based on recent news, though whale movements (e.g., large transfers to exchanges) could add selling pressure.
### Key Influences
- **Bearish factors** — Declining trends in moving averages and low burn rates recently.
- **Potential upside** — Ecosystem developments like Shibarium milestones or accumulation signals could spark a bounce, but nothing definitive for today.
Cryptocurrency prices are highly volatile and influenced by overall market conditions (e.g., Bitcoin's performance). This is not financial advice—always DYOR and consider the risks. For real-time updates, check platforms like CoinMarketCap or CoinGecko. 🐕

BANK NIFTY Bounces Strongly – Trend Continuation LikelyBank Nifty is firmly trading inside a rising channel on the daily timeframe, maintaining a clear higher high–higher low structure. After a strong rally, the index is now consolidating near the upper half of the channel, which is a healthy sign in an ongoing uptrend.
The recent sideways movement is happening above a well-defined horizontal support, indicating that sellers are unable to push prices lower. This kind of consolidation after an upmove generally reflects time correction, not price correction, which keeps the bullish structure intact.
As long as Bank Nifty holds above this support base, the probability favours a fresh upside expansion towards the upper channel resistance. The projection marked on the chart aligns with the broader trend strength and momentum structure.
RSI is placed around the 50–55 zone, showing that momentum has cooled off without turning weak. This reset in RSI often provides fuel for the next trending leg rather than signaling a reversal.
Overall, Bank Nifty remains structurally strong, and this phase looks more like accumulation before continuation. A sustained move above the recent consolidation range can trigger the next impulsive rally, while only a breakdown below support would change the short-term outlook.

SENSEX : Trading levels and Plan 18-Dec-2025📘 SENSEX Trading Plan for 18-Dec-2025
(Timeframe reference: 15-min | Gap criteria: 300+ points)
Key Levels to Track (from chart):
Opening Resistance: 84,745
Last Intraday Resistance: 84,949
Upper Supply / Extended Target: 85,133
Opening Support: 84,399
Last Intraday Support: 84,003
Lower Support (Extreme): 83,832
🟢 1. GAP-UP OPENING (300+ Points)
If SENSEX opens well above 84,745, price directly enters the resistance/supply region.
🎓 Educational Explanation:
Large gap-ups usually indicate strong overnight sentiment, but they also invite profit booking near resistance. Institutions often test whether new buyers are willing to defend higher prices. Hence, a break–retest–continue structure is healthier than chasing the opening candle.
Plan of Action:
If price sustains above 84,745 for 10–15 minutes, wait for a pullback before considering longs.
First upside hurdle is 84,949; watch price behaviour and volume here.
Acceptance above 84,949 opens the path toward 85,133 (extended supply zone).
Strong rejection or exhaustion near 85,133 can lead to a pullback toward 84,949 → 84,745.
Option buyers should prefer ATM/ITM Calls only after confirmation; avoid chasing spikes at resistance.
🟡 2. FLAT OPENING
A flat open near 84,550–84,650 keeps SENSEX inside a balance area between support and resistance.
🎓 Educational Explanation:
Flat openings indicate indecision. Direction emerges only after one side shows commitment. The first 30 minutes define intraday structure; trading before that often leads to whipsaws.
Plan of Action:
Sustaining above 84,745 turns sentiment positive, targeting 84,949.
Failure to cross 84,745 keeps price range-bound with a downside risk toward 84,399.
Breakdown below 84,399 shifts control to sellers, opening the move toward 84,003.
Bullish reversal patterns near 84,399 can offer low-risk bounce trades toward 84,745.
🔴 3. GAP-DOWN OPENING (300+ Points)
If SENSEX opens below 84,399, early sentiment turns cautious.
🎓 Educational Explanation:
Large gap-downs are often emotion-driven. Smart money waits for price reaction at strong demand zones instead of selling into panic. Many intraday reversals begin from such zones after sellers exhaust.
Plan of Action:
First demand area to watch is 84,003; look for rejection candles or bullish divergence.
A bounce from 84,003 can retrace toward 84,399.
Sustained breakdown below 84,003 exposes 83,832, the extreme support.
Any pullback toward 84,399 after a breakdown becomes a selling-on-rise opportunity.
⚙️ Risk Management Tips for Options Traders 🛡️
Avoid trading in the first 5–10 minutes during 300+ point gap days.
Never buy options at resistance or sell at support—wait for confirmation.
Use time-based stop loss (15–20 minutes) if premium doesn’t move as expected.
Risk only 1–2% of capital per trade; position sizing matters more than accuracy.
Prefer ATM options or spreads during high IV to reduce decay risk.
Book partial profits near key resistance/support zones.
🧾 Summary & Conclusion
Above 84,745: Bulls remain active; targets 84,949 → 85,133.
Between 84,399–84,745: Market stays balanced; patience is key.
Below 84,399: Sellers gain control unless strong demand appears at 84,003.
Focus on structure, confirmation, and disciplined risk management, not prediction.
The best trades come from waiting for price to reach predefined levels.
⚠️ Disclaimer
I am not a SEBI-registered analyst. This trading plan is for educational purposes only and should not be considered as financial or investment advice. Please consult your financial advisor before taking any market positions.

NIFTY : Trading levels and Plan for 18-Dec-2025📘 NIFTY Trading Plan for 18-Dec-2025
(Timeframe reference: 15-min | Gap criteria: 100+ points)
Key Levels to Track (from chart):
Opening Resistance: 25,876
Last Intraday Resistance: 25,969 – 25,994
Higher Supply Zone: 26,080 – 26,140
Opening Support: 25,748 – 25,768
Last Intraday Support (Buyer’s Zone): 25,594 – 25,647
🟢 1. GAP-UP OPENING (100+ Points)
If NIFTY opens above 25,876, price directly enters the short-term resistance structure.
🎓 Educational Explanation:
A gap-up above resistance indicates overnight bullish sentiment, but such openings often attract profit booking by early buyers. Markets usually attempt to retest breakout zones before deciding continuation or reversal. Chasing price without confirmation increases risk.
Plan of Action:
If price sustains above 25,876 for 10–15 minutes, look for pullback-based long entries.
Upside targets remain 25,969–25,994, where supply is expected.
Strong breakout and acceptance above 25,994 can open the path toward 26,080–26,140.
Rejection or exhaustion candle near 25,994 may trigger a pullback toward 25,876.
Option buyers should prefer ATM/ITM calls only after retest confirmation, not at the opening spike.
🟡 2. FLAT OPENING
A flat open near 25,800–25,830 keeps NIFTY inside a balance zone.
🎓 Educational Explanation:
Flat opens are decision-making zones. Direction emerges only after buyers or sellers show commitment. The first 30 minutes form the intraday structure, and trading without confirmation leads to whipsaws.
Plan of Action:
Sustaining above 25,876 turns sentiment bullish, targeting 25,969–25,994.
Failure to cross 25,876 keeps price range-bound and vulnerable to pullbacks.
Breakdown below 25,768 shifts control to sellers, opening downside toward 25,647–25,594.
Bullish reversal patterns near 25,748–25,768 can offer low-risk long setups.
🔴 3. GAP-DOWN OPENING (100+ Points)
If NIFTY opens below 25,748, market sentiment turns cautious.
🎓 Educational Explanation:
Gap-downs are often emotion-driven. Initial selling pressure may look strong, but strong demand zones attract positional buyers. Smart traders wait for price behaviour at support instead of selling into panic.
Plan of Action:
First reaction zone: 25,594 – 25,647 (Buyer’s must-try zone).
Look for strong rejection candles or bullish divergence for bounce trades.
If price sustains below 25,594, weakness may extend further—avoid aggressive longs.
Any pullback toward 25,748–25,768 after breakdown becomes a selling-on-rise opportunity.
⚙️ Risk Management Tips for Options Traders 🛡️
Avoid trading in the first 5–10 minutes during gap openings.
Do not buy options at resistance or sell at support—wait for confirmation.
Use time-based stop loss (15–20 minutes) if premium doesn’t move.
Risk only 1–2% of capital per trade.
Prefer spreads or ATM options during high IV sessions.
Protect profits aggressively near resistance zones.
🧾 Summary & Conclusion
Above 25,876: Bulls stay active, targets 25,994 and above.
Between 25,768–25,876: Market remains indecisive—patience required.
Below 25,748: Sellers gain control unless strong demand emerges at 25,594.
Focus on structure, confirmation, and disciplined risk, not prediction.
Best trades come from waiting, not reacting emotionally.
⚠️ Disclaimer
I am not a SEBI-registered analyst. This trading plan is purely for educational purposes and should not be considered as financial or investment advice. Please consult your financial advisor before taking any trades.

Mahindra & Mahindra: Correction Phase Initiated from ATHFrom the recent all-time high near ₹3,795 , price action on the 4H timeframe shows a clear loss of impulsive structure. The initial decline from ATH is best interpreted as a leading diagonal , a common pattern that often kick-starts a broader corrective phase .
The diagonal unfolded Wave (1) with overlapping internal waves, confirming the corrective nature rather than trend continuation.
Currently, price appears to be attempting a Wave (2) retracement . Typical recovery zones lie between the 0.5–0.618 Fibonacci retracement (₹3,686–₹3,712) . As long as price remains below this band, the broader bias stays bearish , with scope for a stronger Wave (3) decline to follow.
Invalidation
This bearish count is invalidated above the ATH (₹3,795) . A move beyond this level would negate the diagonal structure and require a fresh bullish reassessment.
Summary
ATH rejection confirmed
Leading diagonal suggests corrective transition
Wave (2) retracement in progress
Below ATH -> downside risk remains active
Disclaimer
Disclaimer: This analysis is for educational purposes only and does not constitute investment advice. Please do your own research (DYOR) before making any trading decisions.
