Short-Term Trading vs. Long-Term Trading1. Time Horizon
Short-Term Trading:
Focuses on quick market moves. Trades last from a few minutes to a few days or weeks. The goal is to profit from immediate price fluctuations.
Long-Term Trading:
Built on patience. Positions are held for months, years, or even decades to benefit from long-term growth and compounding.
2. Core Objective
Short-Term Trading:
Capture small but frequent profits by exploiting volatility, momentum, and short-lived opportunities.
Long-Term Trading:
Build wealth steadily by participating in the long-term growth of businesses, sectors, or economies.
3. Analysis Style
Short-Term Trading:
Heavily dependent on technical analysis
Uses charts, patterns, indicators, volume, and price action
News and sentiment play a major role
Long-Term Trading:
Primarily driven by fundamental analysis
Focuses on earnings, growth potential, balance sheets, management quality, and industry trends
4. Market Noise vs. Market Value
Short-Term Trading:
Thrives on market noise. Small price movements and emotional reactions create trading opportunities.
Long-Term Trading:
Ignores daily noise. Concentrates on intrinsic value and long-term business strength.
5. Risk and Reward Profile
Short-Term Trading:
Higher risk per trade due to volatility
Risk is actively controlled through stop-losses
Frequent wins and losses
Long-Term Trading:
Lower day-to-day risk perception
Exposed to economic cycles and structural changes
Fewer decisions, but higher conviction required
6. Capital and Leverage
Short-Term Trading:
Often uses leverage to amplify small moves
Requires strict money management to avoid large drawdowns
Long-Term Trading:
Generally unleveraged
Capital grows through appreciation, dividends, and compounding
7. Emotional and Psychological Demand
Short-Term Trading:
Mentally intense and emotionally challenging
Requires fast decision-making and strong emotional control
Fear and greed must be managed daily
Long-Term Trading:
Emotionally calmer but tests patience
Requires discipline during market crashes and rallies
Conviction matters more than speed
8. Time Commitment
Short-Term Trading:
High time involvement
Needs constant monitoring during market hours
Can feel like a full-time profession
Long-Term Trading:
Low time involvement
Periodic review and rebalancing
Suitable for people with limited daily time
9. Cost and Tax Impact
Short-Term Trading:
Higher brokerage, transaction costs, and taxes
Profits can be reduced if costs are not controlled
Long-Term Trading:
Lower transaction frequency
Often more tax-efficient
Better net returns over time
10. Learning Curve
Short-Term Trading:
Steep learning curve
Requires backtesting, journaling, and continuous improvement
Long-Term Trading:
Gradual learning process
Emphasis on understanding businesses and macro trends
11. Lifestyle Compatibility
Short-Term Trading:
Best suited for active individuals who enjoy fast-paced environments
Requires focus, routine, and discipline
Long-Term Trading:
Ideal for those seeking financial growth alongside career or business
Less stress, more freedom
12. Wealth Creation Potential
Short-Term Trading:
Income-oriented approach
Success depends on consistency and risk control
Long-Term Trading:
Wealth-oriented approach
Compounding is the biggest advantage
13. Who Should Choose What?
Choose Short-Term Trading if you:
Enjoy active market participation
Can manage stress and emotions
Have time to monitor markets daily
Choose Long-Term Trading if you:
Believe in patience and compounding
Prefer stability over excitement
Want to grow wealth with minimal daily involvement
Final Takeaway
Short-term trading is about skill, speed, and discipline.
Long-term trading is about patience, conviction, and compounding.
Wave Analysis

MCX CRUDE: Wave C in Motion – Target ₹4,700 and Below (MCX Crude Oil Futures) Timeframe: Weekly (1W)
Key Observations
1. Wave Structure
Following the massive Super Cycle peak, Crude Oil is locked in an A-B-C Correction.
Wave A and Wave B are complete. We are currently navigating Wave C, which is historically the "flush out" move.
The breakdown from the recent consolidation confirms the bearish grip.
2. Key Resistance Zones
₹5,681 (Red Line): This is the immediate "Ceiling." The Bears are defending this level. Any rise to this level is a selling opportunity.
₹6,621: The major trend reversal point (Trendline Resistance).
3. Key Support & Targets
₹4,703 (Alt Bottom): The first logical target where the "Blue Trendline" offers support.
₹3,501 - ₹4,337 (Orange Box): This is the Final Destination for Wave C. This is where the Smart Money will enter for the next multi-year rally.
4. RSI and Momentum
RSI (Weekly): Trending at 42.50, well below the 50 neutral mark. This indicates that sellers are in control and the bottom is not yet in.
5. My Final View The trend is Bearish.
Action: Sell on Rise.
Warning: Do not catch the falling knife at ₹5,000. Wait for the deeper targets near ₹4,700 to book profit on shorts.
Disclaimer: Educational analysis only. Trade at your own risk.

gold spot viewgold spot cmp 4286 is in 5 wave
wave A 3500
wave B 3780
wave C 3170
wave D 3460
wave E 2700
gold spot 4382 above monthly close or sustain strongly is sl
view is for study purpose only , we are not recommend any trade or investment

WTI CRUDE: Wave C in Motion – Next Stop $50?XTIUSD (US Oil Spot) Timeframe: Weekly (1W)
Key Observations
1. Wave Structure
The market is deep within a massive A-B-C Correction following the Grand Super Cycle peak.
We are currently in Wave C (the final downward leg). This wave is active and is dragging prices toward the long-term trendline support.
The failure to break above the recent highs confirmed the start of this bearish sequence.
2. Key Resistance Zones
$68.55 (Red Line): This is the "Lid." As long as the price stays below this level, the Bears are in total control.
$62.30: Immediate resistance. Any bounce to this level is likely a selling opportunity.
3. Key Support Zones
$50.00 - $52.00 (Blue Trendline): This is the "Alt Bottom" target. The rising trendline intersects here, making it a high-probability reversal zone.
$44.55 (Orange Line): The ultimate structural floor.
4. RSI and Momentum
RSI (Weekly): Trading below 40. This confirms weak momentum with no signs of bullish divergence yet. The path of least resistance remains down.
5. My Final View (Straightforward & Simple) The trend is Bearish.
Action: Avoid aggressive Longs. The "knife" is still falling.
Strategy: Sell on rises near $60-$62.
Target: We expect a slow grind down to test the $50.00 psychological mark before a meaningful bottom is formed.
Disclaimer: This analysis is for educational purposes only. Trade at your own risk.
#CrudeOil
#WTI
#XTIUSD
#OilMarket
#EnergyMarkets
#Commodities
#CommodityAnalysis
#MarketStructure
#TechnicalAnalysis
#PriceAction
#TradingView

silver spot viewsilver spot cmp 62.70 is in 3 wave
4 wave 47.00, 43.00, 39.00, 35.00 take support continue 5 wave
65.00 above monthly close or sustain strongly is sl
view is only study purpose only , we are not recommend any trade or investment

ICICIBANK 1 Day Time Frame 📊 Current Live Price (approx): ₹1,364–1,365 on NSE as of this session.
🟢 Daily Pivot & Intraday Levels
(from pivot analysis)
Pivot Points (Standard / Daily):
Pivot: ~1363.8
Resistance 1 (R1): ~1371
Resistance 2 (R2): ~1377
Resistance 3 (R3): ~1385
Support Levels:
Support 1 (S1): ~1357
Support 2 (S2): ~1350
Support 3 (S3): ~1343
👉 Price staying above pivot ~1364 suggests slight short‑term strength; a break above R1 ~1371 could see extension toward ~1378–1385. Sustained breaks below S1/S2 may trigger momentum toward ~1350 or lower.

NIFTY 50: Decision Time – Breakout or Retest? (Roadmap)Ticker: NIFTY Timeframe: Daily (1D)
Key Observations
1. Wave Structure
The index is trading strictly within a Rising Parallel Channel, respecting the boundaries perfectly.
We are currently in the Blue Wave (3) sequence, which is the primary growth phase.
Internally, the market is pausing. It is deciding whether to launch the explosive Green Wave 3 immediately or retest the Green Wave 2 base first.
2. Key Resistance Zones
26,278 (Red Horizontal Line): This is the "Roof." The market has struggled to close above this level. A Daily Close above this confirms the next rally.
27,843 (Channel Top): Once 26,278 breaks, this is the first magnetic target.
3. Key Support Zones
24,977 (Red Trendline): This is the "Floor." The channel support aligns perfectly here.
24,655: The ultimate invalidation level for the short-term bullish view. As long as we hold this, the trend is Up.
4. RSI and Momentum
RSI (Daily): Currently neutral (around 50). This is healthy. It indicates the market has "cooled off" from the previous rally and is gathering energy for the next move without being overbought.
My Final View (Straightforward & Simple)
The trend is Bullish but currently stuck in a "Waiting Room."
Action: Do NOT chase in the middle.
Buy Strategy: Wait for a dip near 25,000 (Low Risk) OR a confirmed breakout above 26,278 (High Momentum).
Targets: 27,840 ➔ 30,720.
Disclaimer: This analysis is for educational purposes only. Trade at your own risk.
#NIFTY
#NIFTY50
#IndianMarkets
#StockMarketIndia
#IndexAnalysis
#MarketStructure
#TechnicalAnalysis
#PriceAction
#TradingView
#BiggerPicture

BAJAJ-AUTO 1 Month Time Frame 📊 Current Position
Last price: ~₹8,940 – ₹9,000 range.
52-week range: ₹7,089 – ₹9,490.
🔁 Near-Term Levels (1-Month Time Frame)
📈 Upside / Resistance Levels
These are prices where the stock may face selling pressure or pauses in a rally:
1. Immediate Resistance: ~₹9,100 – ₹9,150
2. Stronger Resistance: ~₹9,200 – ₹9,250
3. Positive Breakout Zone: Above ~₹9,250 – ₹9,300
Closing above these zones in sequence suggests short-term bullish momentum.
📉 Downside / Support Levels
These are key areas where the stock may find buying support if price dips:
1. Immediate Support: ~₹8,850 – ₹8,890
2. Next Support: ~₹8,750 – ₹8,780
3. Deeper Support: ~₹8,600 – ₹8,650
A breakdown below ₹8,850 could see retest of lower supports.
📊 Likely 1-Month Trading Range (Technical View)
Based on current trend and volatility, traders often expect the stock to fluctuate roughly between:
≈ ₹8,750 – ₹9,300 over a 4–6 week horizon, unless strong breakout/breakdown occurs.
This aligns with recent short-term forecast ranges from chart-based models.

Narrative-Driven MarketsHow Stories Move Prices More Than Numbers
Financial markets are often described as rational systems where prices reflect hard data such as earnings, interest rates, cash flows, and economic indicators. Yet, anyone who has observed markets closely knows that prices frequently move far ahead of fundamentals—or even in the opposite direction. This apparent contradiction is best explained by the concept of the narrative-driven market, where stories, beliefs, and collective imagination shape market behavior more powerfully than spreadsheets and models.
A narrative-driven market is one in which stories dominate decision-making. These stories can be about growth, disruption, fear, recovery, nationalism, technology, or even survival. Investors, traders, media, analysts, and policymakers all contribute to building and spreading these narratives. Once a narrative gains momentum, it influences expectations, risk appetite, capital flows, and ultimately prices.
The Power of Stories in Financial Markets
Human beings are natural storytellers. We understand the world not just through data, but through meaning. Markets are no exception. A balance sheet tells us what is, but a narrative tells us what could be. Investors do not buy stocks for past earnings; they buy them for future possibilities. Narratives fill the gap between uncertainty and action.
For example, the narrative of “a fast-growing digital economy” can lift valuations of technology companies even when profits are weak. Similarly, a narrative of “economic slowdown” can crush fundamentally strong stocks because fear overrides logic. In both cases, the story becomes stronger than the numbers.
How Narratives Are Born
Market narratives usually emerge from a combination of events and interpretation. A new technology, a policy change, a geopolitical conflict, a pandemic, or a central bank decision can act as the spark. Media headlines, expert opinions, social media discussions, and institutional reports then shape how that event is understood.
Over time, repetition reinforces belief. The more a narrative is discussed, the more credible it appears. Eventually, it becomes the “accepted truth” of the market—even if the underlying facts are still uncertain.
For instance, during periods of global liquidity, the narrative often becomes “buy every dip because central banks will support markets.” This belief itself encourages buying, making the narrative self-fulfilling.
Narratives and Market Cycles
Narratives evolve with market cycles.
Early cycle: Narratives are quiet and skeptical. Only a few believe in the new story.
Expansion phase: The narrative gains traction. Data starts supporting it, and prices rise steadily.
Euphoria: The narrative becomes extreme. Valuations are justified with phrases like “this time is different.” Risks are ignored.
Breakdown: Reality challenges the story. A trigger event causes doubt.
Collapse: The narrative reverses. Fear replaces optimism, often overshooting on the downside.
Understanding where a narrative sits in this cycle helps traders and investors avoid emotional decisions and crowd behavior.
Media and Social Amplification
In modern markets, narratives spread faster than ever. Financial news channels, Twitter (X), YouTube, Telegram, and WhatsApp groups amplify stories instantly. Algorithms prioritize emotional and sensational content, which often strengthens extreme narratives—both bullish and bearish.
Retail participation has further intensified narrative-driven moves. Coordinated belief, even without strong fundamentals, can drive sharp rallies or crashes. Price action then becomes the “proof” that the narrative is correct, attracting even more participants.
Fundamentals vs Narratives
It is important to note that narratives do not permanently replace fundamentals. In the long run, cash flows, profitability, and economic reality matter. However, in the short to medium term, narratives can stretch valuations far beyond fair value.
Successful market participants understand this balance. They do not dismiss fundamentals, but they also do not underestimate the power of belief. A fundamentally cheap stock can remain cheap if the narrative is negative. A fundamentally expensive stock can keep rising if the narrative remains strong.
Narratives in Different Asset Classes
Narrative-driven behavior is not limited to equities.
Commodities react strongly to stories of shortages, wars, or super cycles.
Currencies move on narratives of economic strength, capital flows, and political stability.
Crypto markets are almost entirely narrative-based, driven by adoption stories, regulation fears, and technological promises.
Bond markets respond to narratives around inflation, growth, and central bank credibility.
Each asset class has its own dominant storytellers and belief systems.
Trading and Investing in Narrative-Driven Markets
To operate effectively in narrative-driven markets, one must shift mindset. Instead of asking only “Is this cheap or expensive?”, a better question is “What story is the market currently believing?”
Key skills include:
Listening to dominant themes across media and market commentary
Observing price reaction to news rather than the news itself
Identifying when a narrative is strengthening or weakening
Recognizing emotional extremes such as greed and panic
Traders often benefit by aligning with strong narratives but exiting when signs of saturation appear. Long-term investors may wait for narrative collapse to accumulate quality assets at discounted prices.
The Risk of Blind Storytelling
While narratives create opportunity, they also create danger. Blind faith in a story can lead to bubbles and heavy losses. When narratives disconnect completely from reality, even small disappointments can cause violent reversals.
Discipline, risk management, and independent thinking are essential. The goal is not to reject narratives, but to use them consciously rather than emotionally.
Conclusion
A narrative-driven market reflects the deeply human nature of finance. Markets are not just mechanisms of capital allocation; they are arenas of belief, hope, fear, and imagination. Prices move not only on what is known, but on what is believed.
Those who understand narratives gain a powerful edge. They see markets not just as charts and ratios, but as evolving stories. By learning to read, question, and anticipate these stories, traders and investors can navigate volatility with greater clarity, confidence, and control.

Trading Breakouts and Fakeouts How to Identify Real Opportunities and Avoid Traps
Trading breakouts and fakeouts is one of the most popular yet challenging approaches in the financial markets. Traders across equities, commodities, forex, and derivatives closely watch key price levels where the market is expected to make a decisive move. While breakouts can lead to strong, profitable trends, fakeouts often result in losses and emotional frustration. Understanding the difference between the two, and learning how to trade them systematically, is critical for long-term trading success.
What Is a Breakout in Trading?
A breakout occurs when the price of an asset moves decisively above a resistance level or below a support level with increased momentum. These levels are usually formed by prior highs, lows, consolidation ranges, trendlines, or chart patterns such as triangles, rectangles, and head-and-shoulders formations.
Breakouts signal a potential shift in market sentiment. When resistance is broken, it suggests buyers have overpowered sellers. When support breaks, it indicates sellers have gained control. Traders aim to enter positions early in these moves to benefit from the expansion in volatility and price.
Why Breakouts Work
Breakouts work because markets tend to alternate between consolidation and expansion. During consolidation, price moves in a narrow range as buyers and sellers reach temporary balance. Once this balance breaks, price often moves rapidly as:
Stop-loss orders get triggered
New traders enter positions
Institutional traders increase exposure
This chain reaction creates momentum, which can lead to sustained trends.
Common Breakout Strategies
One of the simplest breakout strategies involves identifying a clear support or resistance level and entering a trade once price closes beyond that level. Traders often use:
Horizontal support and resistance
Chart patterns (flags, triangles, ranges)
Highs and lows of previous sessions
Volatility-based levels
Stops are usually placed just inside the broken range, while targets can be based on pattern projection, risk–reward ratios, or trailing stops.
The Role of Volume in Breakouts
Volume is a key confirmation tool in breakout trading. A genuine breakout is usually accompanied by higher-than-average volume, showing strong participation from market players. Low-volume breakouts are more likely to fail, as they indicate a lack of conviction.
In derivatives or futures markets, open interest combined with volume can further validate whether new positions are being built or existing ones are being closed.
What Is a Fakeout?
A fakeout occurs when price briefly breaks above resistance or below support but fails to sustain the move and quickly reverses back into the previous range. Fakeouts are common, especially in sideways or low-volatility markets.
These moves are often driven by:
Stop-loss hunting
False news reactions
Low liquidity periods
Retail trader overreaction
Fakeouts trap breakout traders and reward traders who take the opposite side at the right time.
Why Fakeouts Happen So Often
Markets are designed to find liquidity. Obvious support and resistance levels attract a large number of stop-loss and entry orders. Smart money or institutional players may push price beyond these levels to trigger orders, only to reverse the move once liquidity is absorbed.
Fakeouts are more frequent:
In choppy or range-bound markets
Near major economic announcements
During low-volume sessions
When levels are too obvious
How to Identify a Real Breakout vs a Fakeout
Distinguishing between a breakout and a fakeout requires combining multiple factors rather than relying on a single signal.
Key factors to analyze include:
Candle close: Strong breakouts usually close decisively beyond the level, not just wick through it
Volume confirmation: Higher volume supports breakout validity
Retest behavior: Real breakouts often retest the broken level and hold
Market context: Breakouts in trending markets have higher success rates
Time spent near the level: Strong bases lead to stronger breakouts
Trading Fakeouts as a Strategy
Instead of avoiding fakeouts, some traders specialize in trading them. Fakeout trading involves entering in the opposite direction once price fails to hold beyond a key level.
For example:
Price breaks above resistance
Fails to hold and closes back below
Seller enters short with stop above the fake breakout high
This strategy works best in range-bound markets and requires patience and strict risk control.
Risk Management in Breakout and Fakeout Trading
Risk management is crucial because not all breakouts will succeed. Traders should:
Risk only a small percentage of capital per trade
Use predefined stop-loss levels
Avoid overtrading multiple breakouts at once
Maintain a favorable risk–reward ratio (at least 1:2)
Without proper risk management, even a high win-rate strategy can result in losses.
Psychology Behind Breakouts and Fakeouts
Breakout trading tests trader psychology. Fear of missing out (FOMO) often pushes traders to enter too early, while fear of loss causes premature exits. Fakeouts exploit emotional decision-making, especially among inexperienced traders.
Successful traders remain disciplined, wait for confirmation, and accept that losses are part of the process. Emotional neutrality and consistency are more important than predicting every move correctly.
Best Timeframes for Breakout Trading
Breakouts occur on all timeframes, but their reliability varies. Higher timeframes (daily, weekly) tend to produce more reliable breakouts due to institutional participation. Lower timeframes (5-minute, 15-minute) have more noise and fakeouts but offer more frequent opportunities.
Traders should align breakout strategies with their trading style—scalping, day trading, or swing trading.
Breakouts in Different Markets
Stocks: Earnings, news, and sector momentum often drive breakouts
Forex: Breakouts frequently occur around sessions opens and macro news
Commodities: Supply-demand imbalances and global events fuel strong moves
Options: Breakouts often lead to volatility expansion, benefiting option buyers
Understanding market-specific behavior improves breakout accuracy.
Conclusion
Trading breakouts and fakeouts is both an art and a science. Breakouts offer the potential for strong trends and high rewards, while fakeouts serve as reminders that markets are unpredictable and often deceptive. The key to success lies in confirmation, context, and discipline.
By combining price action, volume analysis, market structure, and solid risk management, traders can improve their ability to identify genuine breakouts and avoid common traps. Rather than trying to be right every time, successful traders focus on consistency, probability, and long-term growth.

XAUUSD: Wave 4 Consolidation Ends - Target $4,950 Ticker: XAUUSDTimeframe: Daily (1D) Analysis: Elliott Wave / Macro
The Structural View:
Spot Gold is strictly following the Elliott Wave Grand Super Cycle. We are currently witnessing the Wave (4) correction/consolidation phase, which is essential to build momentum for the final rally.
Technical Breakdown:
The Base: The breakout above the $4,189 level (Blue Line) confirmed the bullish intent. This level now acts as critical structural support.
Wave 5 Sequence: We are initiating the final Wave (5). The internal subdivision shows we are preparing for the "Green Wave 3" extension.
RSI Reset: The consolidation has allowed the RSI to reset from overbought levels, giving the bulls room to push higher without exhaustion.
Key Levels to Watch:
Crucial Support: $4,247 (Immediate) & $4,189 (Structural).
Intermediate Target: $4,630
Grand Target (Cycle Peak): $4,825 - $4,947
Verdict:
Remain Bullish above $4,247. The path of least resistance remains up towards the $5,000 psychological zone.
Disclaimer: Educational analysis only. Manage your risk.

MCX GOLD: Wave 5 Begins - Target ₹1,57,000The Macro View:
Gold has successfully bounced from the Wave 4 correction zone. The structure on the Daily timeframe confirms we are initiating Wave (5) of the Grand Super Cycle.
Technical Observations:
Support Held: The price respected the 126,134 base (Wave 2 low), confirming the bullish structure.
Current Wave: We are currently in the internal Green Wave 3, which is historically the strongest part of the trend.
Time Cycle: The next major cycle turn is expected in late December/early Jan, which should coincide with a breakout above 140k.
Key Levels:
Invalidation Level: Close below 131,700.
Target Zone 1: 138,235
Target Zone 2: 152,425 - 157,913
Disclaimer:
This view is for educational purposes. Consult your financial advisor.

BANKNIFTY : Trading levels and Plan for 16-Dec-2025📘 BANK NIFTY – Advanced Educational Trading Plan for 16-Dec-2025
(With 200+ points Gap Logic • Market Structure Breakdown • Institutional Trading Concepts)
🧠 Market Structure & Context Before Scenarios
Before trading any opening scenario, understand how Bank Nifty is positioned:
Price is currently inside a compression zone between
59,302 (Opening Support) and 59,590 (Opening Resistance)
This zone acts like a value area, where institutions balance orders before moving the market.
Both Last Intraday Resistance (59,869–59,931) and Last Intraday Support (59,010–59,097) are liquidity pockets where big players previously defended their positions.
A breakout from these zones generally produces faster directional moves because liquidity gets absorbed.
Educational Principle:
📌 When price consolidates, energy is building. When price breaks out, that stored energy is released.
This mindset helps you filter high-probability trades.
🚀 Scenario 1: Gap-Up Opening (200+ Points)
A strong gap-up indicates overnight bullish sentiment and institutional buying interest.
However, not every gap-up sustains — many are “exhaustion gaps.”
🎯 Educational Breakdown of Gap-Ups
1. Understand the First 15-Min Candle Behavior
If the opening candle is strong and closes near its high → buyers are committed.
If it forms a long upper wick → early profit booking or liquidity grab.
Trading Logic:
Don't chase the first candle. Let institutions reveal their hand.
2. Sustaining Above 59,590 = Trend Day Possibility
If price builds higher lows above 59,590, you’re witnessing institutional accumulation.
The market may aim for 59,869–59,931, the next liquidity zone.
Why This Works:
📌 Sustaining above resistance means short sellers are trapped, fueling further upside.
3. Breakout of 59,931 → Explosive Move towards 60,076
This area has thin liquidity; once broken, price tends to move fast.
A retest of 59,900 zone becomes an excellent add-on opportunity.
4. Gap-Up Failure Pattern
If price opens above 59,590 but quickly falls back into the range, it indicates:
Weak buyers
Profit-booking
Liquidity hunt above resistance
Avoid longs immediately — instead, watch for a drop toward 59,302.
(Three-line spacing)
⚖️ Scenario 2: Flat Opening (±100 Points)
Flat opens are the most technical and the most reliable for structured setups.
✨ Educational Breakdown of Flat Openings
1. Why Flat Opens Are Neutral
Market is waiting for data or direction
Overnight positions are balanced
No immediate imbalance between buyers and sellers
This creates a perfect price discovery phase.
2. Opening Range Matters
The first 15-minute candle becomes your guiding structure.
A breakout of the candle’s high/low with retest often creates clean entries.
Key Principle:
📌 Trade the range breakout, not the noise inside the range.
3. Break Above 59,590 → Trend Creation
Wait for a break–retest–continuation pattern, not just a breakout wick.
4. Break Below 59,302 → Weak Structure
If price breaks and sustains below this zone, sellers gain control.
Next key target becomes 59,097, then potentially 58,592.
(Three-line spacing)
📉 Scenario 3: Gap-Down Opening (200+ Points)
Gap-downs reflect overnight bearishness, but also offer the best short-covering opportunities.
🔎 Educational Breakdown of Gap-Downs
1. Identify If It's a ‘Panic Gap’ or ‘News Gap’
Panic gaps reverse quickly.
News-driven gaps (global cues, macro triggers) sustain longer.
2. Support Zone 59,010–59,097 Is Critical
If this zone breaks with volume → expect continuation towards 58,592.
If this zone holds → expect a strong bounce.
Institutional Reasoning:
📌 Big players often accumulate at previous support zones because liquidity is high.
3. Reversal Pattern After Gap-Down = Best Long Setup
Morning star
Bullish engulfing
Higher low formation
Because short sellers close positions, creating a fast upside reaction.
4. Failed Breakdown = Most Powerful Opposite Move
If price breaks below 59,010 but quickly reclaims it, this traps breakout sellers.
This results in:
Rapid short covering
Price targeting 59,302 → 59,444 → 59,590
(Three-line spacing)
🛡️ Risk Management & Option Trader Education
📌 1. Spot Levels Are for Analysis — Premium Levels Are for Trading
Premiums do not move linearly with spot. Always place SL on premiums.
📌 2. Avoid Trading Against Strong Gap Momentum
25–30% of option trader losses come from trying to fade gaps early.
📌 3. Understand Implied Volatility (IV)
Rising IV → inflated premiums → poor risk–reward
Falling IV → better pricing for buyers
📌 4. Never Take Trades Inside the No-Trade Zone
The zone 59,302 – 59,590 is filled with liquidity traps.
📌 5. Use Position Sizing Formula
Risk per trade = 1% of capital
Position size = SL distance × quantity
📌 6. For Selling Options, Use Hedged Positions Only
Especially during gap days to avoid unlimited risk.
🧾 Summary & Professional Conclusion
Above 59,590 → Bias bullish; potential target 60,076.
Between 59,302 – 59,590 → Stay out; allow market to decide.
Below 59,097 → Weakness accelerates toward 58,592.
Best trades come from break–retest–continuation, not impulsive entries.
Read the market structure first — direction is more important than prediction.
⚠️ Disclaimer
I am not a SEBI-registered analyst. This analysis is solely for educational purposes and should not be considered investment advice. Trade using your own risk assessment and consult your financial advisor before making decisions.

Dow Jones Ind. Weekly UpdatedDJI Indices in now going Wave 3 super cycle degree target 60,000 USD minor correction possible so enter 43,000 - 40,000 level is good for long entry

Dow Jones Crash - 2026 Analysis (Elliott Wave)DJI Indices crash possible up to minimum 50 to 61.8% starts on Feb - mar 2026 forming leading diagonal pattern 5th wave completed soon last up move around 1000 points only then stars correction so traders and investors go short don't try long at this time

NIFTY : Trading levels and Plan for 15-Dec-2025📊 NIFTY – TRADING PLAN FOR 15 DEC 2025 (Rewritten & Improved)
Price closed near 26,014, exactly at a midpoint where both buyers and sellers showed activity.
Your directional arrows indicate:
Green arrows → Areas where buyers are expected to step in strongly; ideal long setups after confirmation
Red arrows → Areas where sellers take control after buyer exhaustion; ideal short setups after breakdown & retest
Orange arrows → Areas where price is indecisive; avoid trading until breakout or breakdown
🚀 1. GAP-UP OPENING (100+ points)
1. If Nifty opens between 26,093 – 26,138
• This region reflects a hesitation zone, as shown by the orange arrows.
• Buyers and sellers are both active; market is likely to range.
• No trade here until market shows clear direction.
• Watch for:
– A breakout above 26,138 → follow the green arrow path, buyers take control → Targets 26,257 → 26,294.
– A rejection from 26,138 and fall below 26,093 → follow red arrow path, sellers gain momentum → Target 25,947.
2. If market opens above 26,138
• According to the green directional arrows, buyers are ready to continue the rally.
• Best trade:
– Wait for a minor pullback into 26,138 area
– Enter long on bullish confirmation
• Target zone remains 26,257–26,294.
• Ideal for option buyers due to direction clarity.
3. If gap-up opens only slightly above 26,014 but below 26,093
• The chart arrows show mixed direction — no strong trend yet.
• Wait for confirmation.
• Only trade after:
– Break and retest above 26,093 (long)
– Break below 25,947 (short)
⚖ 2. FLAT OPENING (around 26,000)
1. Price moves into 26,093 zone first (orange arrows)
• This is a stalling region — price may oscillate, offering no clear setup.
• Avoid trading until breakout or breakdown.
• Once direction is chosen:
– Above 26,093 → follow green arrows → long opportunity
– Below 25,947 → follow red arrows → short opportunity
2. If 25,947 holds strongly after open
• Buyers are showing interest exactly where the green arrows begin.
• Good long setup after a higher-low or bullish candle pattern.
• Targets: 26,014 → 26,093 → 26,138.
3. If price rejects 26,093 and turns down sharply
• This is aligned with first red arrow structure.
• Short only when price breaks 25,947 with momentum and retests.
• Targets: 25,885 → 25,771.
📉 3. GAP-DOWN OPENING (100+ points)
1. Opening near 25,885
• Your green arrows show this as a strong buyer reaction zone.
• Expect a possible reversal or stabilisation.
• Long setup only after:
– Wick rejections
– CHoCH / BOS
– Retest of intraday level
• Upside targets: 25,947 → 26,014 → 26,093.
2. If 25,885 breaks and price fails retest
• This confirms the red arrows' downward continuation path.
• Best short entry:
– Break
– Retest
– Confirmation candle
• Targets: 25,771.
3. If price opens directly near 25,771
• This is where the strongest fight occurs before the market chooses direction — shown by mixed arrows.
• Avoid immediate entry.
• Only trade once:
– Strong reversal appears (long)
– Or level breaks and confirms (short)
🛡 RISK MANAGEMENT FOR OPTIONS TRADERS
1. Avoid trading the first 5 minutes, especially on gap days.
2. SL must be based on SPOT price, not premium.
3. Follow arrow direction strictly:
– Green arrows → Consider CE / long futures
– Red arrows → Consider PE / short futures
– Orange arrows → Avoid trades completely
4. Do not buy far OTM options during consolidation.
5. When in profit, trail SL — especially near 26,138 & 26,257 resistance.
6. Respect max loss limit: stop for the day if you hit 1–2% capital loss.
📌 SUMMARY & CONCLUSION
• Green arrows = Buyer strength zones → Best long setups with good R:R.
• Red arrows = Short continuation zones → Ideal areas to short after breakdown confirmation.
• Orange arrows = No-trade areas → Wait for breakout; don’t force trades.
• Above 26,138, bullish momentum increases.
• Below 25,947, bearish continuation strengthens.
• Profit booking expected at 26,257–26,294.
This plan aligns exactly with the direction suggested by your arrows and provides a clean, professional decision-making framework.
⚠ DISCLAIMER
I am not a SEBI-registered analyst.
This plan is only for educational purposes.
Trade using your own analysis and risk management.

DIOGONAL BREAK DOWN OF ETHERIUMETHUSD – Ending Diagonal Completed, Wave 5 Reversal Underway
Ethereum has completed a classic ending diagonal at the top of Wave (5), and the structure has now broken down exactly as expected.
Price action showed:
Clear loss of momentum near the upper diagonal boundary
A final push that failed to extend impulsively
A sharp reversal candle confirming the breakdown
Retracement into the 0.382–0.5 Fibonacci zone
This behavior aligns perfectly with Elliott Wave guidelines for an ending diagonal termination.
As long as ETH stays below the breakdown zone, the market opens room toward:
3029 (0.5 retracement)
2965 (Fib 1.0)
2929 (0.618 retracement)
Please like this podt if it helps you,folloe me to get updates

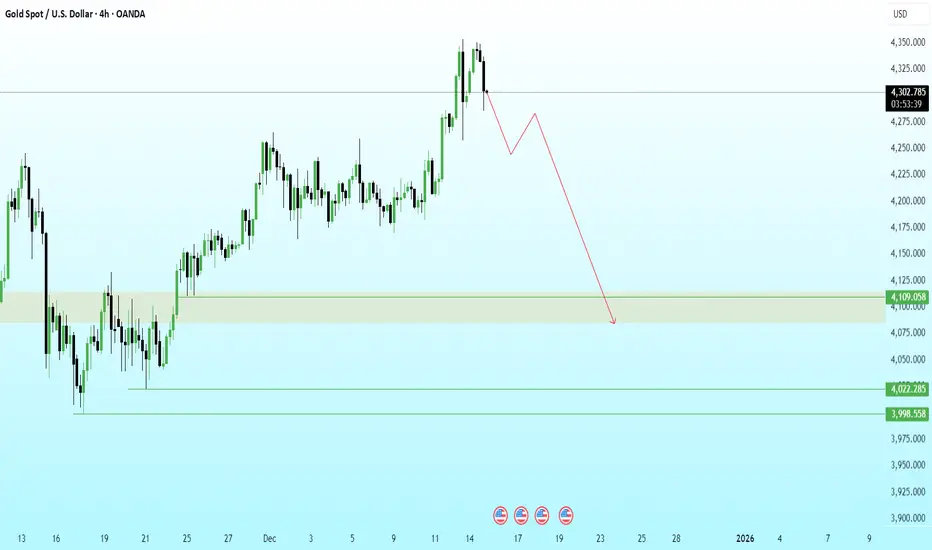
GOLD 4H | Liquidity Harvest Done… Now the Slide BeginsPrice engineered liquidity above the previous swing high and immediately delivered a sharp rejection, confirming a buy-side liquidity grab and the start of distribution.
Structure has now shifted bearish with a clear BOS from the premium zone. I’m expecting a mitigation leg before continuation lower.
The draw on liquidity sits inside the 4100–4080 demand imbalance, which aligns with unmitigated bullish orders from the prior accumulation phase.
If 4100 fails to hold on mitigation, the next liquidity pools rest at:
4022 (clean sell-side pocket)
3998 (final downside liquidity target)

Elliott Wave Analysis XAUUSD – Week 3 of December 2025
1. Momentum
Weekly (W1):
Weekly momentum is approaching the overbought zone. There is a high probability that in the coming week, W1 momentum will enter the overbought area and start showing signs of a bearish reversal.
Daily (D1):
D1 momentum is currently in the overbought zone and preparing to turn down. We need confirmation from a clear bearish D1 candle. Once confirmed, the market is likely to enter a corrective move lasting approximately 4–5 days.
H4:
H4 momentum has already turned bearish. However, it still needs around 2–3 more H4 candles to reach the oversold zone, indicating that short-term downside momentum remains intact.
2. Elliott Wave Structure
Weekly Timeframe (W1)
On the weekly chart, wave X (purple) appears to be in its final phase. Price is currently trading near the base of wave W, suggesting a high probability that this structure is forming a flat correction.
Key characteristics of a flat pattern:
- Price can retrace back to the origin of wave W.
- It may even exceed the W low/high and create a marginal new extreme.
- However, this breakout is typically limited before price reverses to complete wave Y.
In the current context, weekly momentum has not yet confirmed a bearish reversal. Therefore, the possibility of one final upward push in wave X cannot be ruled out before a larger decline begins.
Daily Timeframe (D1)
On the daily chart, wave X (purple) is developing as an ABC structure. At present:
- The red wave C has already completed a 5-wave internal structure.
- Price is now trading within the green wave 5 of wave C.
With D1 momentum already in the overbought zone, there is a high probability that green wave 5 is nearing completion. Once this wave ends, price is expected to decline to form wave Y.
However, an important caution remains:
- D1 momentum has not yet confirmed a bearish reversal.
- Therefore, attempting to catch the exact top of wave X carries risk.
- As discussed on the weekly timeframe, flat corrections can allow price to equal or slightly exceed the wave W level before reversing.
H4 Timeframe
Looking more closely at the H4 structure:
- The 5-wave sequence (1–2–3–4–5 in green) within the red wave C has completed.
- Wave 5 reached its projected target near 4334, after which price started to decline sharply.
H4 momentum still requires 2–3 candles to reach oversold conditions, suggesting:
- The current bearish leg still has room to extend.
- The most probable scenario is a continuation lower toward the POC zone (green line) around 4215 – 4187, followed by a corrective bounce.
If this scenario unfolds:
- The current decline is likely forming wave 1 down of a new 5-wave structure for wave Y.
- The subsequent recovery would be wave 2, typically unfolding as an ABC corrective move.
- This wave 2 rally would provide a high-probability sell opportunity, especially if H4 momentum rebounds into the overbought zone again.
3. Key Notes & Risk Awareness
One critical point to emphasize:
- Weekly momentum is preparing to enter the overbought zone and potentially reverse.
- Daily momentum is already overbought.
- This momentum confluence suggests that the coming decline could be more extended, aiming to push weekly momentum back toward oversold conditions.
In practice, weekly momentum often requires multiple oscillations (commonly around three reversals) to complete a full corrective cycle. Therefore:
- Patience is essential during this phase.
- Avoid prematurely adopting a long-term bullish bias.
- Always wait for price action confirmation.
This analysis represents a directional warning and scenario planning only. All expectations must be confirmed by real-time price behavior.
4. Conclusion
For the upcoming week, the primary bias favors a bearish corrective phase.
Detailed trading plans (entries, stop loss, and targets) will be updated daily as new price data becomes available.

ethereum longs activated im in long manage your riskim in eth longs from this level of entry and long targets risk your capital that ytou can lose and make profits as your levels its just a trade idea thats it

Part 1 Candle Stick patterns Option Trading in Indian Markets
In India, option trading is highly active in:
NIFTY
BANK NIFTY
FINNIFTY
Select stocks
Weekly expiries, high liquidity, and volatility make options attractive—but also challenging for beginners.

Nifty Analysis for Dec 15, 2025Wrap-up:
Nifty breaks and sustains above 25908. Therefore, b is completed at 25693 and now, Nifty will head towards its final wave c of wave y of wave 5 but before that it will retest the breakout level of 25908.
What I’m Watching for Dec 13, 2025 🔍
Sell nifty only intraday if it breaks and sustains below 26012 SL 26057 for a target of 25922-25904-25887.
Disclaimer: Sharing my personal market view — only for educational purpose not financial advice.
