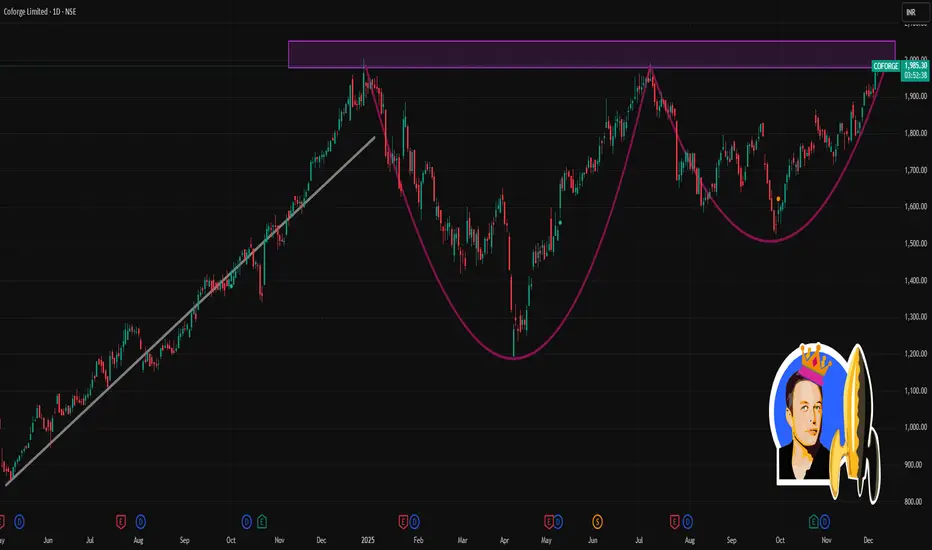
COFORGE 1 Day Time Frame 📈 Current Price & Range (as on recent close)
Last traded price: ~ ₹1,966.20
Day’s low–high: ~ ₹1,917.80 – ₹1,986.00
🧭 Key Moving‑Average & Technical Context
On daily chart, short‑ and medium‑term SMAs/EMAs (5‑, 10‑, 20‑, 50‑, 100‑, 200‑day) are all in “outperform” configuration — indicating bullish bias.
Other indicators on daily chart — RSI, MACD, Stochastic, ROC, CCI etc — are also showing strength (many in “outperform” zone).
⚠️ What to Monitor / What Can Happen
If Coforge breaks above ~₹1,986 with good volume — could extend higher, possibly retesting upper ranges near ₹2,000 (52‑week highs ~₹2,005).
If price falls below ~₹1,915 and fails to hold, next support zones around ~₹1,900 — and if that breaks, ~₹1,840‑₹1,850 becomes the important cushion.
Given strong moving‑average alignment plus bullish oscillator values, trend bias remains upward — but day‑to‑day volatility can still cause swings, so intraday trades should use tight stop‑loss.
Wave Analysis
Cadnle Patterns Mistakes Traders Make With Candle Patterns
Mistake 1: Trading Every Pattern
Not every hammer means buy; not every engulfing means reversal.
Mistake 2: Ignoring the Trend
Trend is king. Patterns against trend are less reliable.
Mistake 3: No Confirmation
Waiting for confirmation improves accuracy.
Mistake 4: Overlooking Market Structure
Support/resistance is more powerful than candle patterns.
Mistake 5: Using Candles Alone
Combine with other tools for best results.

Premium Chart Pattern Knowledge Psychological Foundations of Premium Patterns
Premium patterns are effective because they exploit:
1. Retail Traders’ Fear
People exit during fake breakouts.
2. Greed
People enter late into a move.
3. Manipulation
Institutions trigger false moves to collect liquidity.
4. Volume Behavior
Smart money enters quietly and exits loudly.
5. Market Cycles
Price moves in phases—accumulation, manipulation, trend, distribution.
Premium chart patterns help traders recognize these phases.

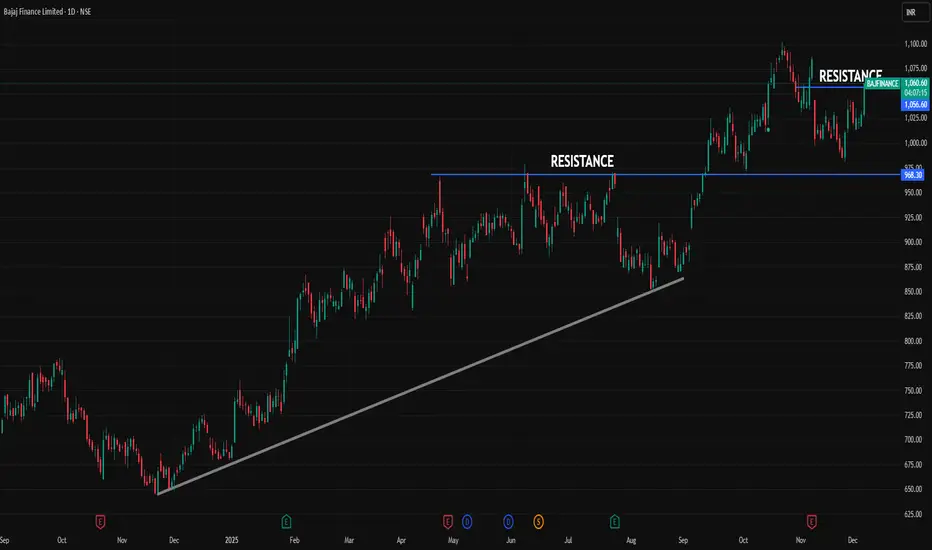
BAJFINANCE 1 Day Time Frame 📌 Latest Price Snapshot
Last quoted price: ~ ₹ 1,029.05
Today’s trading range: ~ ₹ 1,016.00 (low) to ₹ 1,032.30 (high)
52‑week high / low: ~ ₹ 1,102.50 / ₹ 668.55
⚠️ What to Watch / Trade‑Caveats (Intraday)
Pivot and support/resistance levels are dynamic — price could react differently depending on volume, broader market sentiment, and macro factors.
Since current price is already near resistance zone (~₹ 1,044 – 1,056), upside room may be limited — breakouts should be watched carefully, and risk of pullback exists.
On the downside, if price dips below ~₹ 1,019‑1,025, then the next support zone (~₹ 997‑₹ 978) becomes relevant.
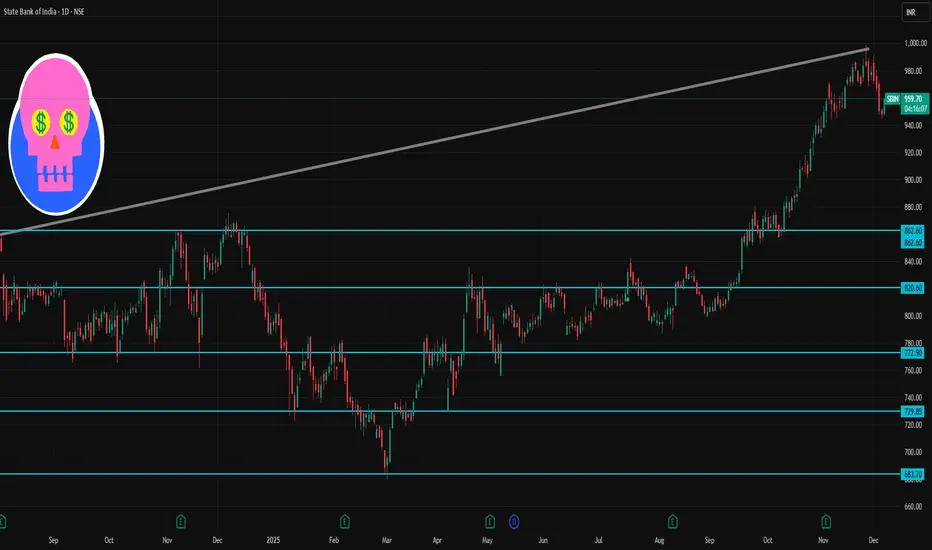
SBI 1 Day Time Frame 📌 Current Price Context
According to recent sources, SBI is trading around ₹949–₹957 (NSE/BSE) depending on the feed.
Its 52‑week trading range remains roughly ₹680 (low) to ₹999 (high).
🎯 What to Watch: Possible Scenarios
Bullish bias: If price holds above pivot (~₹988) and breaks above R1 (~₹994.5), watch for a move toward ~₹1005–₹1010+.
Neutral / Range‑bound: If price oscillates between support (~₹977–₹971) and pivot/resistance zone (~₹988–₹994), expect sideways movement.
Bearish bias: Break and close below S2/S3 (~₹971–₹960) might open downside — next major cushion near ~₹950–₹940.
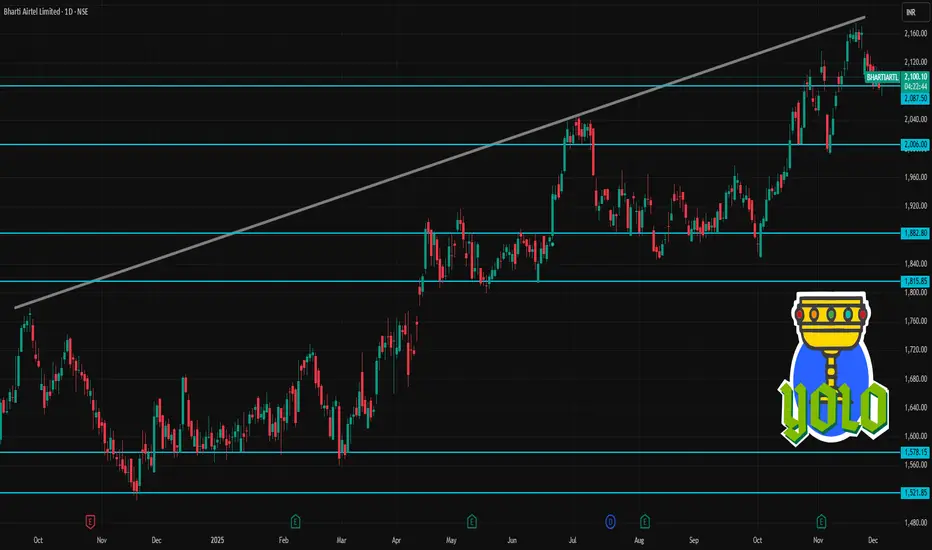
BHARTIARTL 1 Day Time Frame 📊 Current status
The latest price is about ₹ 2,103.8 (NSE/BSE) for Bharti Airtel.
Day’s trading range so far: roughly ₹ 2,090.00 – ₹ 2,106.10.
52‑week range: Low ≈ ₹ 1,559.50, High ≈ ₹ 2,174.50.
⚠️ What to watch out for / risk factors (intraday/trade‑view)
The stock has recently rallied a lot (52‑wk high not far behind), so upside may be limited unless there’s strong buying — there might be profit‑booking or consolidation.
Short‑term volatility could be high; intraday ranges are fairly wide.
External factors — broader index movements (Nifty / Sensex), sector sentiment, broader telecom/market news — could sway direction more than technicals.
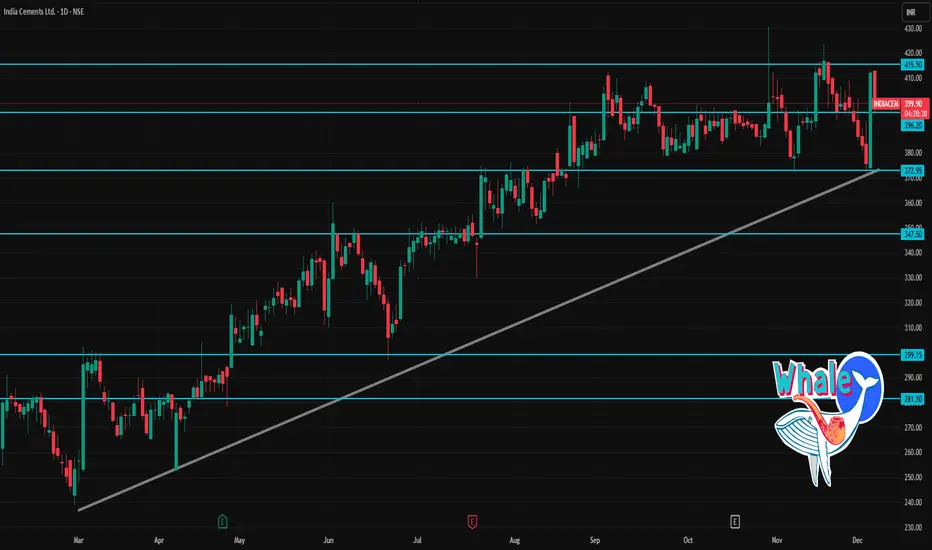
INDIACEM 1 Day Time Frame 📈 Key Recent Data & Context
Recent closing price was ~ ₹412.15, with VWAP ~ ₹402.10. That means price closed above VWAP — often seen as a short-term bullish signal.
The stock has experienced a significant volume spike recently (much higher than its 2-week average), which may suggest stronger conviction in current move.
According to one daily technical indicator set, the stock shows “neutral to slightly bullish” — RSI near mid-range, MACD modestly positive.
🔎 1-Day Pivot & Support / Resistance Levels
Using standard pivot-point calculations for INDIACEM:
Level Type Price (₹)
Daily Pivot 364.95
Support 1 (S1) 359.90
Support 2 (S2) 351.00
Support 3 (S3) 345.95
Resistance 1 (R1) 373.85
Resistance 2 (R2) 378.90
Resistance 3 (R3) 387.80
Interpretation:
If price retraces, the pivot ~ ₹365 may act as first “balancing” zone.
Key supports below are between ₹346–351 — failure below could weaken short-term bullishness.
Upside resistances from today’s pivot are ₹374 → ₹379 → ₹388 — crossing these may signal stronger bullish momentum for the day.
✅ My Trading-day “Game Plan” (Hypothetical)
If I were trading INDIACEM today (intraday or short-term):
Could consider a long entry if the stock sustains above ₹402–405, with stop-loss near ₹377–380 (just below R2/R3).
If price slips back and tests pivot ~ ₹365 or support ~ ₹350–355, that could be a buy-on-dip zone.
On the upside, a move beyond ₹388 could open up short-term upside toward ₹395–405 (given stock’s recent volatility).
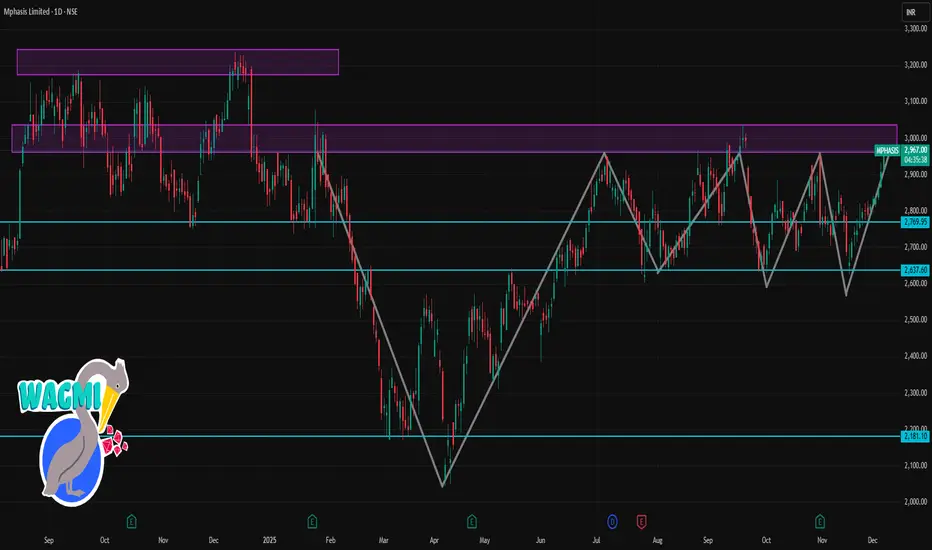
MPHASIS 1 Day Time Frame 📌 Key intraday / near-term levels & technicals
1. Current price (NSE) is around ₹2,908–₹2,927.
2. Day’s low ~ ₹2,865, day’s high ~ ₹2,933.
3. According to a recent “trade spotlight” technical view:
Immediate support near ₹2,800 (close to 20-day EMA).
Immediate resistance near ₹2,920. A clean breakout above this with volume might signal further upside.
If price dips below support zone (₹2,800), watch for weak momentum or a pullback.
4. Technical indicators (on daily chart) suggest a bullish / “buy” bias — moving averages (short and mid-term) are bullish.
5. According to one weekly-based analysis, key support/resistance zones for the week are: Support ~ ₹2,766.40, major support ~ ₹2,721.40; Resistance ~ ₹2,841.70, next resistance ~ ₹2,872.00.
✅ What this means for 1-day / short-term trading
If Mphasis stays above ~₹2,900 and breaks clearly above ~₹2,920 with volume → could test higher intraday levels or even aim for a swing up.
On a dip, watch ₹2,800 as first buffer/support; a drop below this might open possibility of larger retracement.
Given bullish structure, intraday bounce or continuation is likely if broader market supports IT/sector strength.
Thematic Trading Strategies1. What Is Thematic Trading?
Thematic trading is an approach that identifies and invests in powerful macro trends (“themes”) rather than individual stocks in isolation. These themes may include:
Artificial intelligence and automation
Clean energy and sustainability
Electric vehicles (EVs)
Digital transformation
Cybersecurity
Space exploration
Biotechnology advancements
Shifting demographics (aging populations, rising middle class)
Geopolitical realignments
Consumption trends (premiumisation, digital retail)
Instead of selecting stocks purely based on historical performance, thematic traders focus on where the world is heading, and then choose assets that are positioned to benefit from that direction.
2. Why Thematic Trading Is Growing Rapidly
Several structural reasons explain its rising popularity:
a) Long-Term Visibility
Mega trends like renewable energy adoption or AI penetration unfold over decades, providing a clearer long-term direction compared to cyclical sectors.
b) Innovation-Driven Growth
Technological disruptions create exponential opportunities. Companies aligned with these innovations often deliver outsized returns.
c) Investors Want Purpose-Driven Portfolios
Thematic portfolios allow investors to align their investments with personal beliefs—such as sustainability, robotics, or healthcare advancement.
d) Easier Access Through ETFs & Basket Products
Dozens of thematic ETFs now offer exposure to specific trends, making participation easier.
3. Core Elements of a Thematic Trading Strategy
To build a strong thematic strategy, traders analyze three dimensions: the trend, the beneficiaries, and the timing.
a) Identifying the Theme
A strong theme usually has:
Long-term structural drivers
Global policy support (like green energy subsidies)
Strong demand-side and supply-side catalysts
Early or mid-stage development (not fully priced in)
b) Theme Validation
For validation, traders study:
Growth forecasts
Industry adoption rates
Scientific or technological feasibility
Capital inflows into the sector
Market size expansion
Regulatory environment
c) Mapping the Value Chain
Once the theme is established, traders look at the value chain:
For example, in Electric Vehicles:
Battery manufacturers
Lithium/cobalt miners
EV OEMs
Charging infrastructure providers
Software and sensor companies
Understanding the value chain helps discover early movers and high-growth segments.
d) Selecting Instruments
Thematic trading can be executed using:
Individual stocks
ETFs & sector baskets
Index futures
Options (for leverage & hedging)
Commodity plays related to the theme
Global stocks or ADRs
4. Types of Thematic Trading Strategies
**1. Technological Themes
These are the most widely followed themes today, due to rapid digital transformation.
Key examples:
Artificial Intelligence
Machine Learning & Automation
Robotics
Cybersecurity
Cloud computing
FinTech & digital payments
Why attractive?
Tech themes offer exponential growth potential as adoption scales globally.
2. Sustainability & Clean Energy Themes
Driven by global climate commitments and government incentives:
Solar and wind energy
Hydrogen fuel economy
Electric vehicles
Waste management & recycling
Water purification
Green metals (lithium, copper, nickel)
Why attractive?
Clean energy is expected to dominate global energy transition, providing decades of investment opportunity.
3. Healthcare & Biotechnology Themes
These include:
mRNA technology
Genomics & DNA sequencing
Precision medicine
AI-driven medical diagnostics
Senior care & aging population industries
Why attractive?
Healthcare demand grows steadily with demographic shifts and breakthroughs.
4. Demographic Themes
These focus on changes in population structures:
Rising middle class in Asia
Aging populations in Japan, Europe
Urbanization in developing economies
Millennial and Gen Z consumption patterns
Why attractive?
Demographic shifts drive predictable long-term market behavior.
5. Geopolitical & Macro Themes
These arise due to global realignments:
Defence and aerospace sector uptrend
Commodity supercycles
Reshoring of manufacturing
Supply-chain diversification
Currency realignments
Why attractive?
These themes often have strong policy and budgetary backing.
6. Consumer Behavior Themes
Based on changing lifestyles:
Digital commerce boom
Subscription economy
Luxury consumption growth
Health & wellness industry
Travel and experiential spending
Why attractive?
Consumer preferences shape long-lasting corporate winners.
5. How To Build a Thematic Portfolio
A systematic approach ensures risk-managed exposure.
Step 1: Define the Theme
Example: "AI adoption in enterprise workflows"
Step 2: Evaluate Theme Drivers
Corporate AI spending
Cloud migration
Data infrastructure growth
Step 3: Map the Value Chain
Semiconductors
Data centers
Software & AI service providers
Hardware companies
Step 4: Select Stocks or ETFs
Choose leaders + emerging disruptors.
Step 5: Portfolio Allocation
Balance between:
High-growth stocks
Value chain diversification
Geographical spread
Step 6: Risk Management
Stop-loss
Portfolio rebalancing
Diversification across themes
6. Benefits of Thematic Trading
a) High Growth Potential
Themes like AI and clean energy can outperform traditional sectors.
b) Long-Term Visibility
Themes often remain relevant for years, reducing dependency on short-term volatility.
c) Innovation Exposure
Provides access to cutting-edge technologies before mainstream adoption.
d) Easier Diversification
ETFs offer broader exposure with fewer stock-specific risks.
7. Risks in Thematic Trading
a) Overhype Risk
Trends can become overpriced quickly due to speculative demand.
b) Technological Uncertainty
Some innovations fail to reach commercial viability.
c) Regulatory Risks
Government rule changes can impact themes like crypto or clean energy.
d) Concentration Risk
Too much focus on a single theme reduces diversification.
e) Timing Risk
Entering a theme at its peak can lead to long drawdowns.
8. Examples of Popular Thematic Trades
AI Boom (2023–2025)
Benefited:
Chipmakers
Cloud platforms
AI software companies
EV and Battery Metals Surge
Lithium and copper saw explosive demand.
Cybersecurity Uptick
Driven by ransomware growth and global cyber threats.
Green Energy Push
Solar, hydrogen, and EV charging firms gained substantial traction.
9. Best Practices for Thematic Traders
Study multi-year macro reports
Focus on value chain leaders
Avoid hype-driven buying
Diversify across multiple themes
Use ETFs when unsure about specific stocks
Regularly review theme performance
Balance high-risk innovation stocks with stable players
Conclusion
Thematic trading strategies provide a powerful framework for capturing long-term transformative trends shaping global markets. By focusing on structural changes—technological, economic, environmental, or demographic—traders can design portfolios that benefit from multi-year compounding growth. While thematic trading offers enormous potential, it also requires disciplined research, smart diversification, and timing awareness.
When done correctly, thematic trading not only provides strong returns but also aligns investments with the future direction of global progress.

Mastering Technical Analysis1. The Foundation of Technical Analysis
1.1 Principles of Technical Analysis
There are three foundational beliefs:
Market discounts everything
All news, earnings, economic conditions, and trader behavior are reflected in the price.
Prices move in trends
Trends are the backbone of technical analysis. Recognizing them early can help traders ride large moves.
History repeats itself
Market participants often react in similar patterns when facing similar situations, creating recurring chart patterns.
1.2 Importance of Market Psychology
Technical analysis works significantly because chart patterns reflect fear, greed, and crowd behavior.
For example:
Panic selling forms long red candles.
Euphoria forms sharp upside breakouts.
Uncertainty appears as consolidation zones.
Understanding the psychology behind price action is as important as the patterns themselves.
2. Understanding Chart Types
2.1 Line Chart
Simple but less detailed—connects closing prices. Good for long-term view.
2.2 Bar Chart
Shows open, high, low, and close. Used by professional traders.
2.3 Candlestick Chart
The most popular chart type.
Candles visually display market sentiment and price behavior within a specific period.
Candlestick patterns like Doji, Hammer, Shooting Star, and Engulfing help identify reversals and continuations.
3. Market Structure: The Backbone of Technical Trading
3.1 Trend Analysis
There are three market phases:
Uptrend: Higher highs (HH) and higher lows (HL)
Downtrend: Lower highs (LH) and lower lows (LL)
Sideways: Price moves in a range
Identifying these phases determines whether you should buy, sell, or wait.
3.2 Support and Resistance
Support is where the price tends to stop falling.
Resistance is where the price tends to stop rising.
These levels help traders:
Predict market turning points
Set stop-loss orders
Identify breakout opportunities
3.3 Breakouts and Fakeouts
Breakouts happen when price crosses a support/resistance with strong volume.
But the market often creates fakeouts—temporary breakouts to trap traders.
Volume confirmation, retests, and candlestick strength help differentiate real breakouts from false ones.
4. Chart Patterns Every Trader Must Master
4.1 Continuation Patterns
These indicate that the current trend is likely to continue:
Flags
Pennants
Ascending/Descending triangles
Cup and handle
4.2 Reversal Patterns
These signal a potential change in direction:
Head and Shoulders
Double Top / Double Bottom
Inverse Head and Shoulders
Rounding bottom
Recognizing these patterns early can help traders catch major trend reversals.
5. Candlestick Patterns – Reading Market Sentiment
Candlestick patterns are a language of the market. Key patterns include:
5.1 Bullish Patterns
Hammer
Bullish Engulfing
Morning Star
Piercing Pattern
5.2 Bearish Patterns
Shooting Star
Bearish Engulfing
Evening Star
Dark Cloud Cover
5.3 Indecision Candles
Doji
Spinning Top
These patterns reveal buyers’ and sellers’ strength at crucial price zones.
6. Technical Indicators and Oscillators
Indicators help confirm price action, not replace it.
6.1 Moving Averages
Used to identify trend direction.
SMA (Simple Moving Average)
EMA (Exponential Moving Average) – reacts faster
Popular combinations:
20 EMA – short-term trend
50 EMA – medium trend
200 EMA – long-term trend
6.2 RSI (Relative Strength Index)
Shows overbought (>70) and oversold (<30) levels.
Useful for reversal spotting.
6.3 MACD (Moving Average Convergence Divergence)
Shows momentum and trend strength.
MACD crosses often indicate trend changes.
6.4 Bollinger Bands
Used for volatility analysis.
Price touching upper/lower bands often signals overextension.
6.5 Volume Indicators
Volume is the fuel of price movements.
Rising volume = strong trend
Falling volume = weak trend
7. Time Frames and Multi-Timeframe Analysis
7.1 Types of Time Frames
Short-term: 1 min, 5 min, 15 min
Medium-term: 1 hour, 4 hours, Daily
Long-term: Weekly, Monthly
7.2 Multi-Timeframe Approach
Professional traders check:
Higher time frame for trend
Mid time frame for confirmation
Lower time frame for entries
This improves accuracy and avoids false signals.
8. Risk Management – The Core of Mastery
No technical strategy works without proper risk management.
Key principles:
Never risk more than 1–2% per trade
Always use a stop loss
Maintain a risk–reward ratio of at least 1:2
Position size should match account size
Risk management ensures survival during losing streaks—and growth during winning periods.
9. Building a Technical Trading Strategy
A complete trading system includes:
Market selection
Entry rules
Exit rules
Risk management
Position sizing
Trading psychology
Your strategy should answer:
When to trade
When NOT to trade
How much to trade
When to exit
A good strategy focuses on simplicity and consistency.
10. Trading Psychology & Discipline
Technical analysis is only 30% of successful trading—psychology is the remaining 70%.
Mastering emotions like fear, greed, frustration, and impulsiveness is essential.
Top traders follow routines, journal their trades, and avoid overtrading.
You must learn:
Patience
Discipline
Emotional neutrality
Avoiding revenge trading
Accepting losses as part of the game
11. Backtesting and Continuous Improvement
Backtesting means testing your strategy on historical data.
It helps validate whether your approach has an edge.
You also need:
Forward testing
Paper trading
Reviewing performance
Tweaking strategies regularly
Professional traders continuously refine their methods.
Conclusion
Mastering technical analysis is a journey—not a one-day skill. It requires understanding price behavior, recognizing chart patterns, using indicators effectively, and managing risk with discipline. With practice, patience, and continuous learning, you can gain the confidence to analyze any chart and make informed trading decisions.

Elliott Wave Analysis XAUUSD – 5/12/2025
1. Momentum Analysis
D1:
Daily momentum has begun moving into the oversold zone, indicating that the current corrective phase may be nearing completion. We will wait for a bullish daily candle to confirm the reversal.
H4:
H4 momentum is declining, suggesting that price may continue to drop or move sideways to bring momentum into the oversold area.
H1:
H1 momentum is currently rising, so the market may see a short-term upward move or sideways action at this timeframe.
________________________________________
2. Elliott Wave Structure
D1 – Higher-Timeframe Structure
Price remains within the green ABC structure of wave X.
With D1 momentum entering the oversold zone and preparing to reverse, the market may continue upward for 4–5 days.
The upward momentum range on D1 is quite large, meaning wave C could push higher toward the previous top or even exceed it—potentially forming an expanded flat or even initiating a new uptrend. We will continue monitoring to refine the strategy.
________________________________________
H4 – Medium-Term Wave Count
Price is currently forming green wave 4, developing mostly sideways.
A strong bullish candle will likely confirm that wave 4 is complete, allowing the market to begin green wave 5.
Projected target for wave 5 (green): 4329
________________________________________
H1 – Short-Term Structure
Price is fluctuating inside a major liquidity zone:
• Upper liquidity zone: 4184 – 4245
• Lower thin-liquidity zone: 4144 – 4184
This creates two possible scenarios:
________________________________________
Scenario 1 – Black ABC correction
If price closes below 4184, it will break through the thin-liquidity zone.
In this case:
• Wave C (black) targets 4144, where C = A
• If price drops deeper into the green wave 1 area → the current wave count becomes invalid, and a new structure will be updated accordingly
________________________________________
Scenario 2 – Triangle structure for wave 4
If price fails to break below 4184, the triangle pattern for wave 4 remains valid.
The two red trendlines outline this structure, and price may currently be in wave d or e.
We will wait for a strong bullish candle breaking the upper triangle boundary to trigger a breakout entry.
________________________________________
3. Trading Plan
Triangle scenario
• Wait for a bullish breakout above the upper boundary.
ABC correction scenario
• Wait for price to reach 4144 to trigger the buy setup.
________________________________________
✅ Buy Zone: 4146 – 4144
❌ SL: 4124
🎯 TP1: 4184
🎯 TP2: 4245
🎯 TP3: 4329

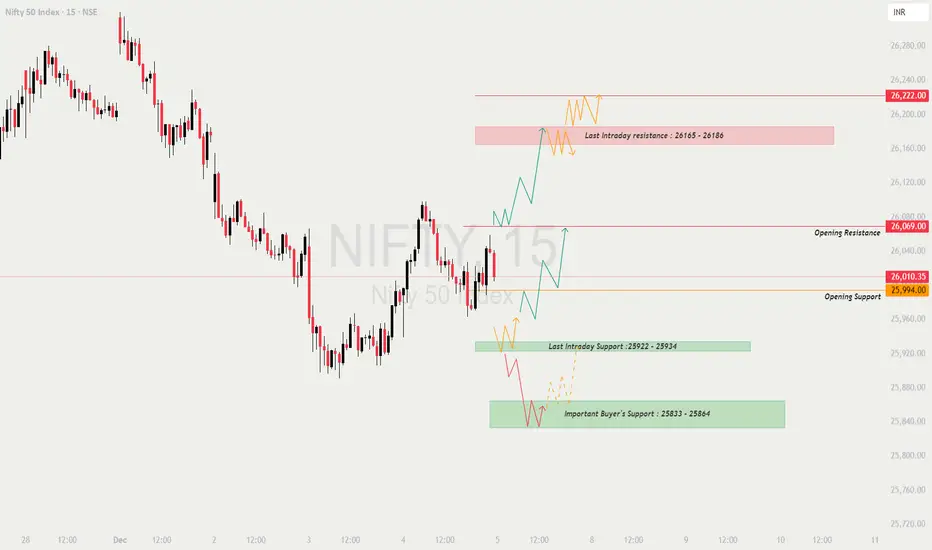
NIFTY : Trading levels and Plan for 05-Dec-2025📊 NIFTY TRADING PLAN — 05 DEC 2025
Price closed near 26,010, sitting between Opening Resistance (26,069) and Opening Support (25,994).
The structure is recovering from a corrective fall, but Nifty must break above 26,069 to show strength, while downside liquidity still sits at Last Intraday Support (25,922–25,934) and the deeper Important Buyer’s Support (25,833–25,864).
Market will likely react strongly to these zones.
🚀 1. GAP-UP OPENING (100+ points)
A gap-up near or above 26,110–26,150 will place Nifty closer to the major resistance zone.
1. If price opens above 26,069 and holds (positive sign)
• Avoid chasing the first candle.
• Wait for a retest of 26,069 — this confirms buyers are genuinely strong.
• If retest holds → Long entry toward 26,165 → 26,186 (Resistance Zone).
• Partial booking advisable inside the resistance box.
2. If gap-up opens directly inside 26,165–26,186 (Last Intraday Resistance)
• High probability of rejection and profit booking.
• Avoid fresh longs in the resistance box.
• Look for reversal wicks → Possible short trade back toward 26,069.
3. If breakout sustains above 26,186
• Momentum expansion likely.
• Upside target becomes 26,222.
• Partial profit booking recommended due to stretched move.
📌 Educational Note:
Gap-ups often trigger emotional buying. Retest entries reduce risk and align you with institutional flow.
⚖ 2. FLAT OPENING (Near 26,000 ± 40 pts)
A flat open provides the cleanest structure and the most reliable intraday setups.
1. If price sustains above 26,069
• Strong sign of buyer intent.
• Long setups activate above 26,069 with targets: 26,165 → 26,186 → 26,222.
• Protect the trade with tight SL under the breakout zone.
2. If price rejects 26,069
• Look for bearish wick patterns or CHoCH.
• Potential drop toward 25,994.
• Break below 25,994 → Trend weakens → Next stop 25,922.
3. If price trades between 25,994–26,069
• Expect range movement.
• Buy low (25,994) and sell high (26,069) only with confirmation.
• Avoid aggressive trades inside the range.
📌 Educational Note:
Flat opens allow price action to show its true direction—higher-lows indicate bullishness, lower-highs signal weakness.
📉 3. GAP-DOWN OPENING (100+ points)
A gap-down near 25,900–25,940 puts the market into key demand territory.
1. If gap-down opens inside Last Intraday Support (25,922–25,934)
• Never short this zone blindly — expect buyer reactions.
• Look for reversal signs: hammer, bullish engulfing, CHoCH.
• If reversal confirmed → Long toward 25,994 → 26,069.
2. If gap-down opens directly into Important Buyer’s Support (25,833–25,864)
• This is a strong liquidity pocket.
• Ideal for bullish reversal trading.
• Watch price action carefully — if reversal prints → Long toward 25,922 → 25,994.
3. If support breaks decisively below 25,833
• Avoid chasing breakdown.
• Wait for retest of 25,833–25,864.
• If retest rejects → Short toward 25,770 → 25,720 (measured move targets).
📌 Educational Note:
Gap-downs often act as liquidity traps. Smart money accumulates aggressively before price reverses upward. Always wait for confirmation.
🛡 RISK MANAGEMENT TIPS FOR OPTIONS TRADERS
1. Avoid the first 5 minutes on a gap-up or gap-down day.
The market needs to stabilise.
2. Do NOT buy far OTM options after a big gap.
Premium crush eats your capital.
3. Always keep a price-level-based stop-loss, not a premium-based SL.
4. Follow 1–2% maximum risk per trade.
5. When IV is high → Prefer selling strategies (credit spreads).
When IV is low → Option buying becomes favourable.
6. Book partial profits at key zones such as 25,994, 26,069, 26,165.
7. Never revenge trade. Reset your mind after a stop-loss hit.
📌 SUMMARY & CONCLUSION
• Bullish bias above 26,069, with upside targets 26,165 → 26,186 → 26,222.
• Range-bound behaviour expected between 25,994–26,069.
• Strong bullish reversal zones below:
– 25,922–25,934
– 25,833–25,864
• Gap openings must always be traded with retests and confirmations.
• Stick to structure, avoid emotional entries, and respect your stop-loss.
⚠ DISCLAIMER
I am not a SEBI-registered analyst.
This trading plan is for educational purposes only and should not be considered investment advice.
Market conditions can change rapidly—trade using your own judgment and strict risk management.
NATURALGAS in Demand/Support zone - Buying opportunity?
TF: 1 hour
CMP: 4.4550
The decline from the top is zig/zag (overlapping structure), hence, I feel that there could be one more move pending on the upside.. If not break of the swing high, at least a retracement of 60-75% is potentially on the cards.
Price is now at the Demand/support zone
Price is taking support at the AVWAP
ABC correction seems to be nearing it's completion (script could make one more low or equal low below 4.4216)
This could very well be the W leg of a complex correction.. but still, a bounce is imminent.
My view:
Definitely not a place to initiate fresh shorts..
Trail your existing short positions with tight SL (as the price moves strongly in a single bar itself)
Wait for confirmation to for LONG set up.
Disclaimer: I am not a SEBI registered Analyst and this is not a trading advise. Views are personal and for educational purpose only. Please consult your Financial Advisor for any investment decisions. Please consider my views only to get a different perspective (FOR or AGAINST your views). Please don't trade FNO based on my views. If you like my analysis and learnt something from it, please give a BOOST. Feel free to express your thoughts and questions in the comments section.

IDFC First Bank Daily Chart – Swing Entry Breakout This daily chart of IDFC First Bank captures a strong primary uptrend from the Daily Demand Zone, followed by a consolidation and pullback that created a higher‑low base above the previous resistance band. Price has triggered a SWING ENTRY from this zone and is now moving inside a defined risk‑reward box toward the Trail Target/Target 1 region near the prior high, with the SL placed just below the consolidation floor. As long as price holds above the swing entry band and short‑term moving averages, the setup reflects trend continuation with a structured path for scaling out profits on further strength.
#IDFCFirstBank #IDFCFIRSTB #SwingEntry #BreakoutTrading #TrendContinuation
#NSEStocks #IndianStockMarket #TechnicalAnalysis #ChartAnalysis #PriceAction
#SwingTrading #TradingSetup #RiskReward #PositionalTrade #StockMarketIndia


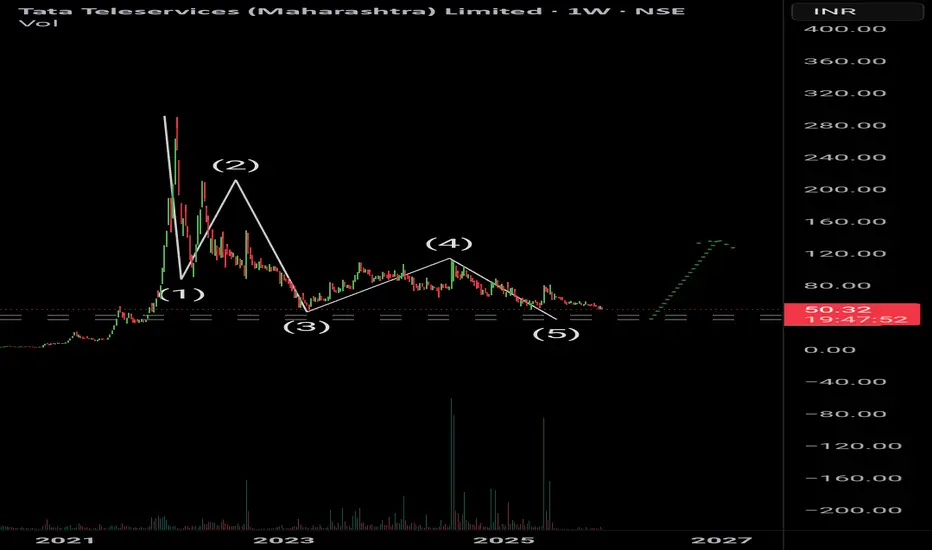
TTML – Elliott Wave Structure Suggests One More Leg Down Before TTML has been consistently showing sell pressure on every bounce, indicating that the current downtrend is still in control. Based on the Elliott Wave count, the chart structure suggests that Wave (5) may not be fully complete yet.
The ongoing correction hints at more downside pain, with price likely to test the ₹40–₹38 support zone. This area aligns with multiple historical support levels and also fits well with the final leg of the Elliott Wave structure.
If the stock holds this demand zone, a strong reversal toward the ₹150–₹155 region becomes highly probable, marking a potential start of a larger bullish cycle.
Trading Plan (For Investors)
Accumulation Zone: ₹38 (±2)
Stop Loss: ₹35
Target: ₹155
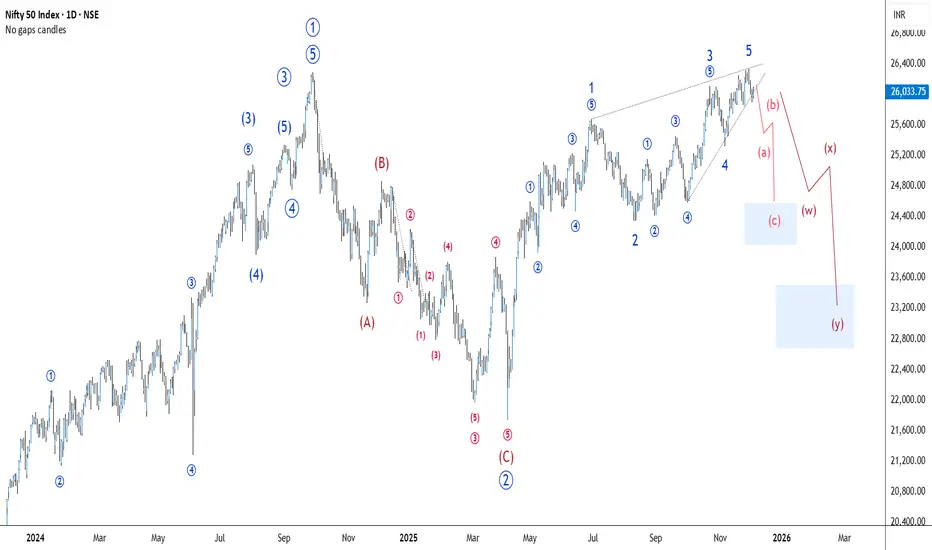
Nifty Minor Correction Retrace up to 61.8% so wait for longNifty Minor degree wave 5 Competed Contracting Leading Diagonal Pattern form so correction possible up to 61.8% level wait for long
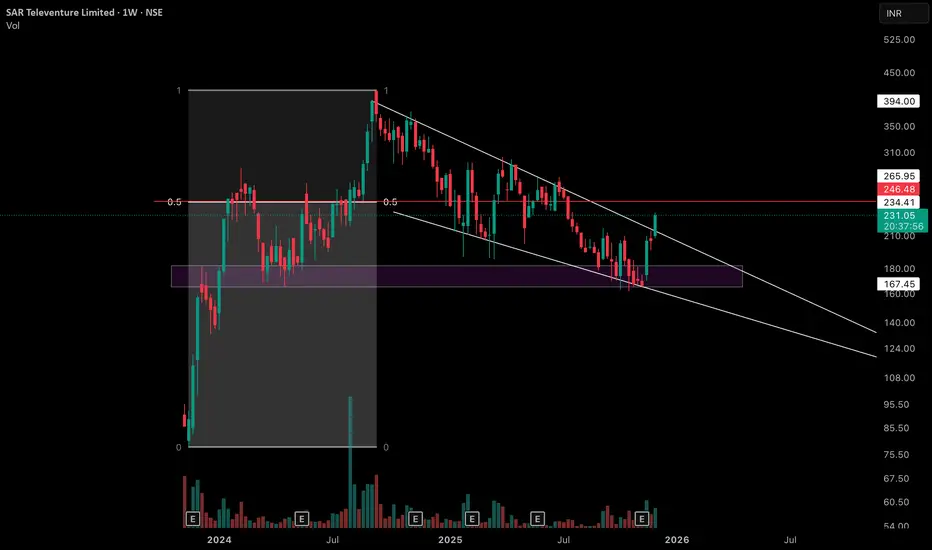
Weekly Equilibrium at Former Supply Zone with 4 observationsObservation 1 - On this weekly chart of SAR Televenture Limited, price has created an interesting equilibrium between the major swing low and the all‑time high swing high, with the 0.5 level highlighted by the red horizontal line as a key mid‑point reference.
Observation 2 - The purple zone marked on the chart was earlier a clear supply / resistance area but has now flipped into a support zone, getting respected multiple times over the past several weeks.
Observation 3 - After printing its all‑time high, price has moved into a sequence of lower highs and lower lows, but each leg has remained relatively controlled instead of showing any one‑sided, sharp liquidation move. This creates a broader consolidation structure where volatility is present yet contained.
Observation 4 - The white lines on the chart represent the upper and lower rejection boundaries of this consolidation channel, and most of the recent candles are developing within these two lines.
Disclaimer: This post is purely for educational and informational purposes, intended to study price structure and market behavior on the weekly timeframe. It is not investment advice or a recommendation to buy or sell any security; traders and investors should do their own research and consult a registered financial professional before making any decisions.
GBPUSD – Weekly Elliott Wave Analysis | Primary Bull & Alt Bear🔍 Detailed Explanation of Analysis
GBPUSD has been moving inside a well-defined ascending channel after bottoming near 1.0356 in 2022. The structure since then appears to be forming an Elliott Wave impulsive cycle, suggesting the market may have completed a corrective phase and is preparing for a larger bullish trend continuation.
The pattern from 1.0356 shows:
Wave (1) from 1.0356 to 1.3140
Wave (2) correction back to 1.1800 range
Wave (3) in progress toward significantly higher levels
The recent sideways movement looks like a minor wave (4) correction within the larger wave (3)
The corrective A-B-C shown near the recent high indicates a completed correction rather than trend reversal.
📍 Primary Bullish Scenario
The bullish structure remains valid as long as price stays above 1.2770 support.
Why bullish?
🔹 Price respecting long-term rising trendline
🔹 Completed corrective A-B-C structure
🔹 RSI rebounding from support zone showing momentum returning
🔹 Price forming higher highs & higher lows since 2022 bottom
Upside Target Zones
Target Zone Expected Wave Reason
1.3830 Key breakout point / neckline
1.4289 – 1.4577 Wave (3) Fibonacci extension area
1.5955 – 1.6650 Major resistance for wave (4)
1.7019 – 1.7655 Wave (5) completion zone
Maximum projection: 1.8600 Super bullish extension scenario
A weekly close above 1.3830 will confirm strong upside acceleration and open the door toward wave 3 expansion.
📉 Alternate Bearish Scenario
If GBPUSD fails to hold above 1.2770, correction could extend into deeper levels.
Downside Levels
Level Purpose
1.2099 Strong historical support
1.0356 Worst-case scenario – retest of wave II
Bearish invalidation for bullish outlook
❌ Weekly close below 1.2770 will negate bullish setup and confirm extended Wave (2) correction.
📊 RSI Technical View
RSI has bounced from near the 40 level, a typical wave 4 low zone
No bearish divergence yet on weekly structure
Suggests correction finishing and trend resuming soon
🎯 Summary
📌 Primary Trend: Bullish continuation above 1.2770
📌 Near-term target: Breakout above 1.3830 will signal strong upside
📌 Wave (3) under development aiming toward 1.4577 → 1.5955
📌 Alternative bearish scenario only if 1.2770 fails
⚠ Disclaimer
This is a technical analysis study for educational purposes only. Not trading or investment advice. Always manage risk.

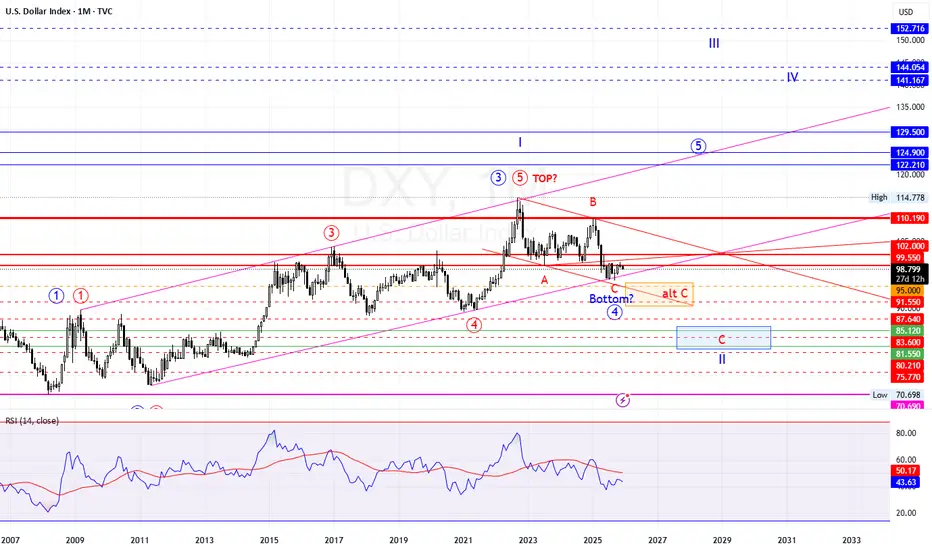
DXY – Monthly Elliott Wave Analysis | Major Support Test AheadDXY – Monthly Elliott Wave Analysis | Major Support Test Ahead - DEC 2025
Previous Analysis:
The US Dollar Index (DXY) appears to be completing a major corrective (A-B-C) structure after topping around 114.78, which is potentially the Wave ⑤ top of a long-term cycle. The index has retraced significantly and is now testing an important support zone that will determine the next long-term direction.
📍 Key Technical Highlights
🔹 Wave ⑤ Top: Formed near 114.78
🔹 Completed Wave A & B, currently in Wave C decline
🔹 Price retesting long-term trendline and Fib support area
🔹 Possible Wave (4) bottom in progress – confirmation pending
📈 Key Resistance Levels
Level Description
99.55 Immediate rejection zone
102.00 Major breakout confirmation
110.19 Strong structural resistance
114.78 Previous cycle high
📉 Key Support / C-Wave Target Zone
Support Range Notes
91.55 – 90.65 Near-term support
87.64 Structural support
83.60 – 81.55 High-probability Wave C completion zone
75.77 – 70.69 Extreme correction scenario
🔍 RSI Observation
RSI forming bullish divergence
Testing long-term support trend from 2008-2011 lows
Indicates downtrend exhaustion signs, but needs confirmation
Scenario Outlook
🟥 Bearish Continuation Preferred
As long as 99.55 – 102.00 holds as resistance,
➡️ Probability favors continuation lower into 83–81 zone to complete Wave II
🟩 Bullish Breakout Invalidates
A monthly close above 102.00
➡️ Could signal trend reversal targeting:
110.19
122.21
129.50
even 152+ in Wave III
Conclusion
📌 Long-term correction likely not finished
📌 Major bottom expected in 83–81 region unless 102 breaks
📌 Wave II final stage approaching – watch price action closely
Disclaimer
Elliott Wave analysis for educational purposes only. Not financial advice. Trade with proper risk management.
#dxy #usdx #dollarindex #dollar #index #indexes #indices #usd #eur #eurusd #fiber #currency #currencies
Part 6 Learn Institutional TradingRisks & Disclosures: Essential Terms
a) Market Risk
Options move faster than stock prices; losses can be sudden.
b) Volatility Risk
Option prices are sensitive to market volatility (VIX). High volatility increases premium.
c) Time Decay (Theta)
Options lose value as expiry approaches — especially out-of-money options.
d) Liquidity Risk
Low-volume contracts may have difficulty in entering/exiting positions.
e) Assignment Risk for Sellers
Sellers can be assigned at any time on expiry day.
f) Slippage
Rapid price movements may cause orders to execute at worse prices.

Part 4 Learn Institutional TradingTrading Rules & Conditions Set by SEBI & Exchanges
a) KYC & Risk Disclosure
KYC and Risk Disclosure Documents (RDD) are mandatory before enabling F&O trading.
b) Contract Specifications
Every option contract has pre-defined:
Strike intervals
Lot size
Tick size
Expiry cycle (weekly/monthly)
c) No Guarantee of Profit
Exchanges emphasize that options are risky; brokers must warn traders.
d) No Insider Trading
Traders cannot use non-public information for trading.
e) Brokers Must Provide Transparency
Brokers need to show:
Margin reports
Contract notes
Daily ledger reports

NZD/CAD in daily time frameLooks like NZD/CAD bullish in daily time frame, once can go long on this pair for an Target of 0.84725
