Bajaj finance Day ChartBajaj Finance A motive wave is formed from 949 to 1102. After this the price has formed a corrective as ABC. From here minimum wave x can be formed or next impulse wave will be formed. If wave x is related then there is a possibility of complex correction. In that condition wave second will become deeper. After that also there is anticipation of long third wave.
Thank you
MKT Learner
Disclaimer
This post is not a recommendation for buying or selling. It is for educational purposes only.
Wave Analysis

Natural Gas Analysis in Daily TFNatural Gas completed in Leading Diagonal Pattern wave 1 cycle degree completed now in correction phase so don't go long immediately wait up to fib retrace 61.8% and wave ((4)) sweep then go long target Cycle degree wave 1 and 2 extension of 161.8 level may be reach in 2026 or 2027

Nifty Analysis for Dec 09/10/11, 2025Wrap-up:
Nifty is forming a wxy pattern in wave C of major wave 5 has completed wave w at 25153 and wave x at 24587 and heading towards internal wave y of wave 5. In wave y, wave a is completed at 26104 and b is expected to be completed at 25728 once nifty breaks and sustains above 25908. Thereafter, Nifty will head towards its final wave c of wave y of wave 5.
What I’m Watching for Dec 09/10/11, 2025 🔍
Buy nifty if it breaks and sustains above 25908 for at least 25 min. SL 25728 for a target of 26142-26093.
Disclaimer: Sharing my personal market view — only for educational purpose not financial advice.

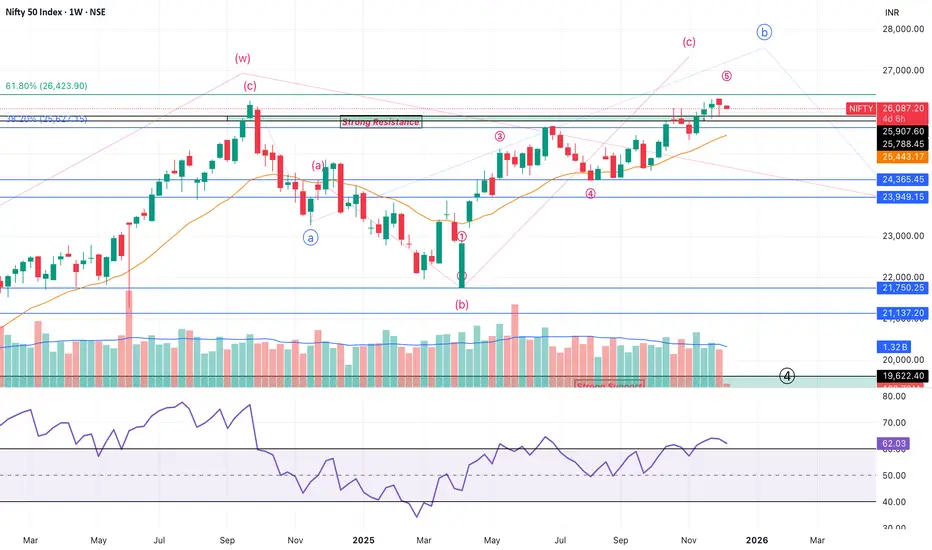
Nifty Short term view from December, 2025 to March/April 2026Wrap up:-
After breaking ATH, Wave X of Nifty has been shifted further and whole of the pattern has been changed. Now, wave w of major wave X is treated as completed at 26277 and wave x of Major wave X is running of which wave a of x of X was completed at 23263 and wave b of x of X is running. Internal wave b of wave b of x of X is completed at 21743 and heading towards wave c.
Min. projection of final wave 5 of internal wave c is achieved at 25627 and heading towards its second target 26423. Final target can be found from its internal wave 5 in lower time frame.
Expectation:- Wave 5 is expected to be completed in Dec, 2025 or Mid of January, 2026 and thereafter, correction in Nifty starts from Mid January, 2026 to March/April 2026.
Disclaimer: Sharing my personal market view — only for educational purpose not financial advice.
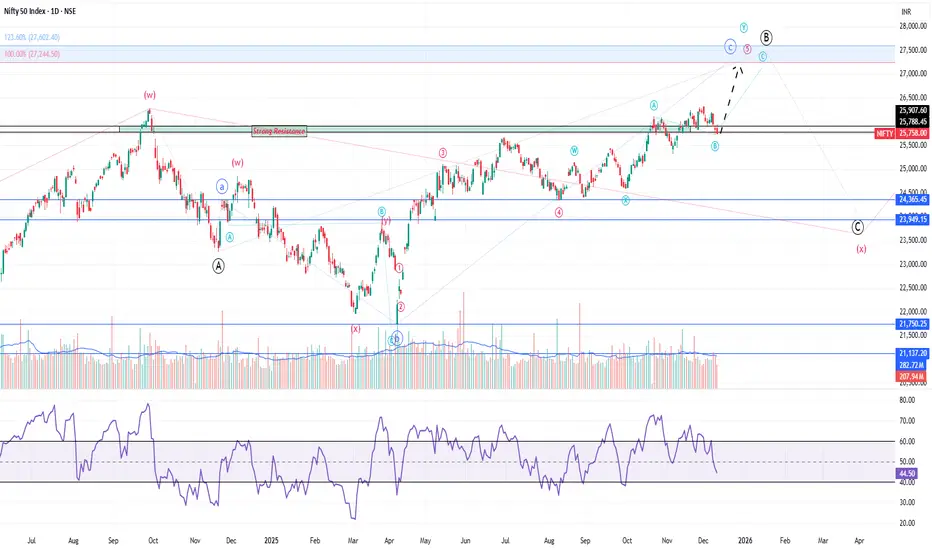
Positional View in Nifty till december, 2025 and January, 2026Wrap up:-
In wave 5 of c of b of X, Nifty is making wxy pattern. Wave w has been completed at 25153 and wave x at 24587 and heading towards internal wave y of wave 5.
In wave y of wave 5, Nifty has completed wave a at 26104 and b at 25728 and heading towards its wave c for a target of 27244.
Buy Nifty at cmp 25758 sl 25728 for a target of 27244 till december, 2025 or mid of january, 2026.
Disclaimer: Sharing my personal market view — only for educational purpose not financial advice.
GOLD MCX VIEWGold now 5wave ,Gold price 135390 above sustain Stop loss
Wave A 131500
Wave B 134500
Wave c 128000

IGL in Correction PhaseIGL is in long correction phase, one can bet for long term buy once it reaches the level of 165.
Long term Target = 360

Part 1 Candle Stick Patterns How Traders Use Options
a. Directional Trading
Buying call/put based on expected movement.
Example:
If NIFTY is bullish → Buy Call
If NIFTY is bearish → Buy Put
b. Non-Directional Trading
Option sellers earn money when the market stays in a range.
c. Breakout Trading
Buy options during breakout of support/resistance.
d. Hedging
Long-term investors buy puts to protect portfolios.

Hindalco: Terminal Wedge, Reversal Risk HighStructural Context
Initially, I considered the decline from 864 toward 770 as a standard ABC correction. But the drop from Wave 2 was far too sharp and drove RSI into deep oversold territory — behaviour that aligns better with impulsive price action.
Because of this, the move is treated as a developing 1-2-3 rather than a corrective ABC.
This adjustment also aligns perfectly with the broader structure: a completed Wave 3 at 770.15, followed by a three-wave recovery into Wave 4.
Wave 4 Completion – Ending Diagonal + Fibonacci Symmetry
Wave C of the larger Wave 4(ABC Flat) shows a clean ending-diagonal wedge, and Wave (v) within it reached the 1.618 extension of Wave (i) measured from Wave (iv).
This Fibonacci precision adds strong weight to the interpretation that Wave 4 has completed at 833.50.
With this level established, the minor bounce into Wave (ii) now acts as the corrective pullback before the expected third wave down.
Invalidation remains at the 1.618 level around 833.50 — any move above that would negate the immediate bearish view.
Path Ahead – Toward Wave 5
As long as 833.50 holds, the expectation is for a five-wave decline toward the previous structural support near 770.15, completing Wave 5.
Wave (iii) should ideally accelerate, and momentum confirmation will be key as price moves into the mid-780s.
Disclaimer
This analysis is for educational purposes only and does not constitute investment advice. Please do your own research (DYOR) before making any trading decisions.

GBP/AUD in Consolidation PhaseWave Analysis: Market is in deep Correction and consolidation phase, Looks like strong impulse is expected with an Target mentioned in the chart

Nifty Analysis for Dec 12, 2025Wrap-up:
Nifty breaks and sustains above 25908. Therefore, b is completed at 25695 and now, Nifty will head towards its final wave c of wave y of wave 5 but before that it will retest the breakout level of 25908.
What I’m Watching for Dec 12, 2025 🔍
Sell nifty only intraday if it breaks and sustains below 25965 SL 26038 for a target of 25916-25900-25887.
Disclaimer: Sharing my personal market view — only for educational purpose not financial advice.

Candle Patterns Candle Patterns and Volume Profile
Volume profile defines where most trading activity occurs.
Key zones:
VAL (Value Area Low) → Strong buy zone
VAH (Value Area High) → Strong sell zone
POC (Point of Control) → Strong rejection or acceptance
High Volume Node (HVN) → Reversal zones
Low Volume Node (LVN) → Breakout zones
Combine candle patterns:
Example setups:
Bullish Engulfing at VAL
Shooting Star at VAH
Pin Bar at LVN breakout
Inside Bar at HVN compression
This combination gives professional-level accuracy.

Silver Mcx ViewSilver Now Wave 5 Silver Price 200933 Above Sustain Sl
Wave A 187000
Wave B 196000
Wave c 169000

Financial Market Types: A Comprehensive Overview1. Capital Markets
Capital markets are financial markets where long-term securities with maturities of more than one year are traded. These markets are crucial for raising funds for long-term investments in projects, infrastructure, and corporate expansion. Capital markets are broadly divided into primary markets and secondary markets.
a. Primary Market
The primary market is also known as the new issue market. In this market, companies and governments raise funds by issuing new securities. Investors purchase these securities directly from the issuer, and the funds raised are utilized for capital expenditure, research and development, or expansion projects. The most common instruments in the primary market include:
Equity shares: Stocks issued by companies to raise ownership capital.
Bonds: Debt instruments issued by corporations or governments.
Debentures and preference shares: Long-term financial instruments that provide fixed income to investors.
The primary market plays a crucial role in facilitating economic growth by channeling savings into productive investments.
b. Secondary Market
Once securities are issued in the primary market, they are traded in the secondary market, also called the stock market. Investors buy and sell existing securities, creating liquidity and price discovery. The secondary market ensures that investors can convert their holdings into cash easily. Prominent examples include:
Stock exchanges: Organized exchanges like the New York Stock Exchange (NYSE), NASDAQ, and National Stock Exchange (NSE) in India.
Over-the-counter (OTC) markets: Decentralized markets where securities are traded directly between parties without an organized exchange.
The secondary market’s efficiency affects the attractiveness of primary market investments, as investors consider the ease of exit before investing.
2. Money Markets
The money market is a segment of the financial market that deals with short-term debt instruments, typically with maturities of less than one year. This market facilitates liquidity management for governments, banks, and corporations. It is considered low-risk and is essential for meeting short-term funding requirements. Key instruments include:
Treasury bills (T-bills): Short-term government securities with maturities ranging from a few days to one year.
Commercial paper (CP): Unsecured short-term debt issued by corporations to meet working capital needs.
Certificates of deposit (CDs): Time deposits issued by banks that offer fixed interest rates.
Repurchase agreements (Repos): Short-term loans backed by securities as collateral.
Money markets are critical for ensuring financial stability, providing a mechanism for central banks to control liquidity and interest rates.
3. Foreign Exchange Markets (Forex)
The foreign exchange market is where currencies are traded. It is the largest financial market in the world, operating 24 hours a day, and plays a vital role in facilitating international trade and investment. Participants include banks, multinational corporations, hedge funds, and individual investors. Major functions include:
Currency conversion: Facilitating global trade by allowing the exchange of one currency for another.
Hedging foreign exchange risk: Protecting businesses and investors from currency fluctuations using forward contracts, options, and swaps.
Speculation: Traders attempt to profit from changes in exchange rates.
The forex market is highly liquid, decentralized, and influenced by economic policies, geopolitical events, and interest rate differentials.
4. Derivatives Markets
Derivatives are financial instruments whose value is derived from an underlying asset, such as stocks, bonds, commodities, currencies, or indices. Derivatives markets provide mechanisms for hedging, speculation, and arbitrage. The two main categories are:
Futures and Forwards: Contracts obligating the purchase or sale of an asset at a predetermined price on a specific future date. Futures are standardized and traded on exchanges, while forwards are customized OTC contracts.
Options: Contracts giving the buyer the right, but not the obligation, to buy or sell an asset at a predetermined price before a specific date.
Swaps: Agreements to exchange cash flows or financial instruments, commonly used for interest rate or currency risk management.
Derivatives markets are critical for risk management in modern financial systems. They allow companies to lock in prices and manage exposure to fluctuating markets.
5. Commodity Markets
Commodity markets are platforms for trading raw materials or primary products. These markets facilitate price discovery, hedging against price volatility, and investment opportunities. They are divided into:
Physical markets: Commodities are bought and sold in tangible form, such as agricultural produce, metals, and energy resources.
Futures markets: Standardized contracts for future delivery of commodities, allowing producers and consumers to hedge against price changes.
Major commodities include gold, silver, crude oil, wheat, and natural gas. Commodity markets are sensitive to supply-demand dynamics, geopolitical events, and global economic trends.
6. Cryptocurrency and Digital Asset Markets
With technological advancement, digital assets like cryptocurrencies, non-fungible tokens (NFTs), and blockchain-based securities have emerged. These markets operate on decentralized platforms, allowing peer-to-peer trading. Key features include:
High volatility: Digital assets can experience rapid price movements.
Decentralization: Transactions are conducted without intermediaries through blockchain technology.
Innovation and adoption: Cryptocurrencies offer alternative investment options and new financial services such as decentralized finance (DeFi).
Though relatively new, cryptocurrency markets are increasingly integrated into traditional financial systems.
7. Bond Markets
Bond markets, also known as debt markets, are segments where fixed-income securities are issued and traded. Governments, municipalities, and corporations issue bonds to finance projects. Types of bonds include:
Government bonds: Considered low-risk and issued by national governments.
Corporate bonds: Issued by companies to raise capital; riskier than government bonds.
Municipal bonds: Issued by local authorities to fund public projects.
Bond markets are critical for long-term financing and provide a stable investment option for risk-averse investors.
8. Over-the-Counter (OTC) Markets
OTC markets are decentralized markets where trading occurs directly between two parties without a formal exchange. They handle securities, derivatives, and currencies. OTC markets are flexible, allowing customized contracts, but they carry higher counterparty risk. OTC trading is essential for assets not listed on exchanges and for large institutional transactions.
9. Interbank Markets
Interbank markets are specialized markets where banks lend to and borrow from one another to manage liquidity. They play a vital role in money market operations and interest rate determination. Instruments traded include overnight loans, certificates of deposit, and foreign exchange swaps. Interbank markets are crucial for banking stability and smooth functioning of the financial system.
10. Emerging Markets
Emerging financial markets refer to rapidly developing economies that are integrating into the global financial system. They offer higher growth potential but carry higher risk due to political, economic, and currency uncertainties. Examples include India, Brazil, and South Africa. These markets include equities, bonds, derivatives, and currency trading and attract both domestic and foreign investors.
Conclusion
Financial markets are the backbone of modern economies, facilitating capital allocation, liquidity, risk management, and economic growth. They range from traditional equity, debt, and money markets to advanced derivative, forex, commodity, and digital asset markets. Each type of market serves a unique function, caters to different participants, and operates under specific regulatory frameworks. By understanding the structure and role of these markets, investors can make informed decisions, companies can access necessary capital, and policymakers can maintain economic stability.
Financial markets continue to evolve with technology, globalization, and innovation. The integration of digital platforms, algorithmic trading, and decentralized finance is transforming traditional market mechanisms, making financial markets more accessible, efficient, and dynamic. For participants, comprehending the diversity and nuances of financial markets is essential to navigate opportunities and risks effectively.

Bank Nifty Outlook: Structure, Levels,and the Bigger Wave 5 PatBank Nifty continues to trade inside a well-defined rising channel after completing an impulsive 5-wave advance from the October lows. The recent correction has been shallow and held firmly above key channel support, suggesting that a larger trend continuation may be underway.
Price is currently attempting to form a higher low above the 59500-59150 zone, which keeps the bullish structure intact.
1. Wave Structure
The index has completed a clear 1-2-3-4-5 sequence.
Wave 4 was shallow and did not break structural supports.
Price is now attempting to begin the next leg, which could unfold as the larger Wave (5).
As long as the index holds above the mid-channel, the bullish wave count remains valid.
2. Key Resistance Zones
These levels must be cleared for strong continuation:
60150 – First breakout trigger
60500 – Short-term resistance
61140 – Mid-channel breakout level
62770 – Wave 3 zone of the larger degree
63900 – Upper channel resistance
68140 – Big-picture Wave 5 target zone
A sustained close above 60500 is the first confirmation.
A breakout above 61140 ignites momentum toward 62770 and 63900.
3. Key Support Zones
Supports remain layered and well-structured:
59500 – First immediate support
59150 – Strong base support
58570 – Channel support
57628 – Major wave 2 retracement region
56850 – Line-in-the-sand support
55355 – Last strong support (wave 2 box)
A drop below 58570 delays the bullish view, while a fall below 57628 shifts sentiment to short-term bearish.
4. RSI and Momentum
RSI is rising from lower levels, showing early momentum recovery after a corrective decline.
No bearish divergence at the moment, which supports the continuation bias.
5. Overall View
Bank Nifty maintains a bullish bias as long as it trades above 58570-57628.
The structure continues to favor buy on dips until the rising channel is broken.
A breakout above 60150-60500 could begin a new leg of upside, targeting:
61140
62770
63900
68140 (bigger picture)
Short-term dips into 59500 or 59150 remain attractive zones for buyers as long as the overall channel structure is protected.
Disclaimer
This analysis is for educational purposes only and reflects personal market interpretation.
Not investment or trading advice.
#BankNifty #NiftyBank #BankNiftyAnalysis #PriceActionTrading #TradingView #TechnicalAnalysis #ChartAnalysis #ElliottWave #SwingTrading #NSEIndia #IndexTrading #MarketOutlook

Part 10 Trade Like Institutions What Are Options?
Options are derivative instruments—their value is derived from an underlying asset such as Nifty, Bank Nifty, stock, commodity, or currency.
An option is a contract that gives the trader:
Right, but not the obligation,
To buy or sell an underlying asset,
At a fixed price (Strike Price),
On or before a specific date (Expiry Date).
Because you have a choice, these instruments are called “Options.”

MARUTI 1 Week Time Frame 📌 Current Price Context
MARUTI is trading around ₹16,470 – ₹16,480 on NSE/BSE today, near recent intraday highs.
📊 Key 1-Week Levels (Support & Resistance)
📈 Resistance Levels
These are upside price zones where selling pressure may appear:
Immediate Resistance (R1): ~₹16,463 – ₹16,488 — the primary near-term ceiling.
Secondary Resistance (R2): ~₹16,644 — next barrier if price sustains above R1.
Higher Resistance (R3): ~₹16,950 — a broader breakout level for the week.
📉 Support Levels
These are downside zones that could act as buying interest:
Immediate Support (S1): ~₹15,976 — first key floor for this week.
Support 2 (S2): ~₹15,670 — deeper support if price slips below S1.
Lower Support (S3): ~₹15,489 — significant lower buffer area for buyers.
Short-term intraday support ~₹16,100 – ₹15,975 — near current trading range.
📊 Pivot Levels (Weekly Reference) — useful for short-term traders
Standard weekly pivot analysis shows:
Weekly Pivot: ~₹16,157
S1: ~₹15,976
S2: ~₹15,670
R1: ~₹16,463
R2: ~₹16,644
R3: ~₹16,950

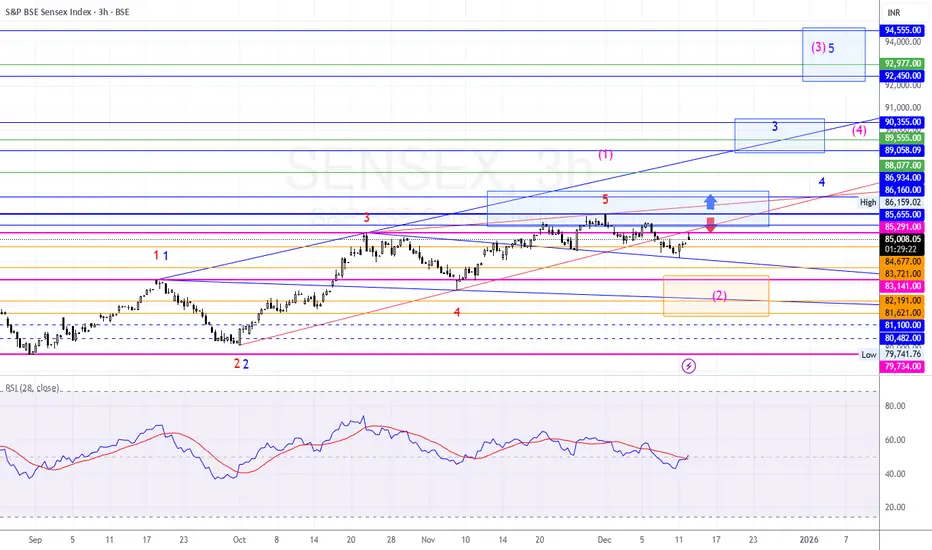
Sensex Key Levels and Market OutlookStructure:
Sensex continues to respect the medium-term bullish channel. The recent pullback into the support band around 84,300 – 83,700 has likely completed wave 4, and the index is now attempting a fresh upside rotation.
Scenario 1 – Bullish Continuation (Most Probable)
Price reclaimed the breakout zone near 85,291 – 85,655.
Sustaining above this band confirms upward strength.
Immediate target zone → 86,934 – 88,058 (Wave 3 internal zone).
Strong extension possible into the 90,355 cluster, aligning with Wave (3) resistance.
Trigger: Clean breakout above 85,655 - momentum opens toward the blue target box.
Scenario 2 – Deeper Wave (2) Retest (Moderate Probability)
If Sensex re-rejects 85,291 / 85,655, it may revisit the orange demand zone.
Key support cluster → 83,721 – 82,191.
This zone is still bullish structurally as long as 81,100 is protected.
A dip into this zone prepares a stronger Wave 3 rally later.
Scenario 3 – Bearish Breakdown (Low Probability)
Breakdown below 82,191 - opens retest of major weekly support at 81,100 → 80,482.
Only a close below 79,734 invalidates the bullish Elliott Wave structure.
RSI Observation
RSI has turned upward from mid-range, matching price reaction from support.
No bearish divergence currently.
Supports probability of a continued upward leg.
Major Levels
Upside:
86,160 - 86,934 - 88,058 - 89,555 - 90,355 - 92,450 - 94,555
Downside:
84,677 - 83,721 - 82,191 - 81,100 - 80,482 - 79,734 (critical)
Summary
Sensex is at a decision point. Holding above 85,291–85,655 keeps bulls fully in control, targeting 86.9k - 88k - 90.3k.
Rejection here only delays the upside; deeper support test remains structurally bullish as long as 79,734 holds.
Disclaimer
This is purely for educational and chart-study purposes. Not financial advice. Do your own research before trading.
Crude oil in Consolidation phaseAs per Current Market view, Crude oil is in long Consolidation, Once the consolidation is completed, Crude can be expected for an upmove with an Target of $65, then if possible it can reach up to 120$

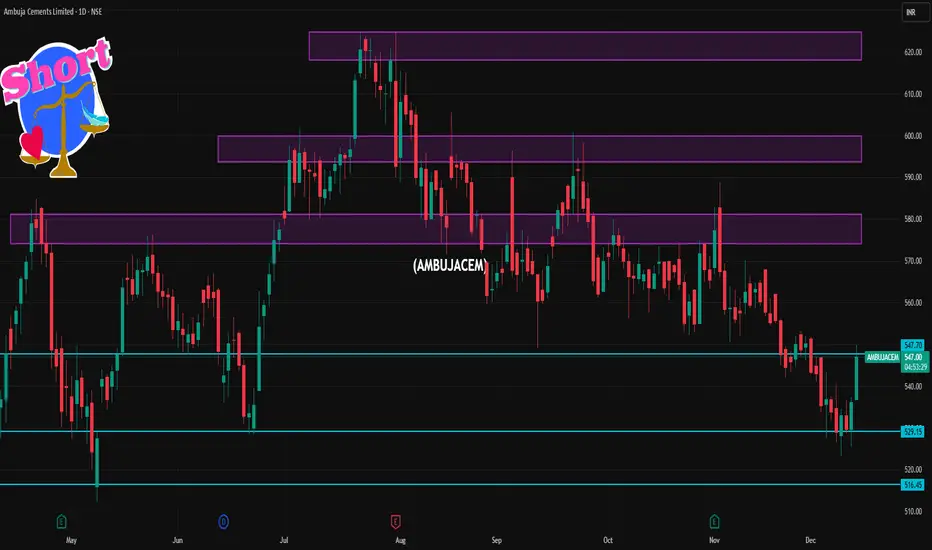
AMBUJACEM 1 Day Time Frame 📌 Current Price (approx)
• Trading around ₹536–₹547 as of today’s session.
📊 Daily Support & Resistance Levels
🔹 Pivot / Key Levels (from technical pivot calculations)
Daily Pivot Zone: ~₹534–₹549
Daily Support Levels:
S1: ~₹531–₹532
S2: ~₹525–₹528
S3: ~₹516–₹521
Daily Resistance Levels:
R1: ~₹540–₹544
R2: ~₹545–₹552
R3: ~₹552–₹559
🔹 Trading Range Today (Observed)
Day Low: ~₹525–₹526
Day High: ~₹537–₹549 range so far.
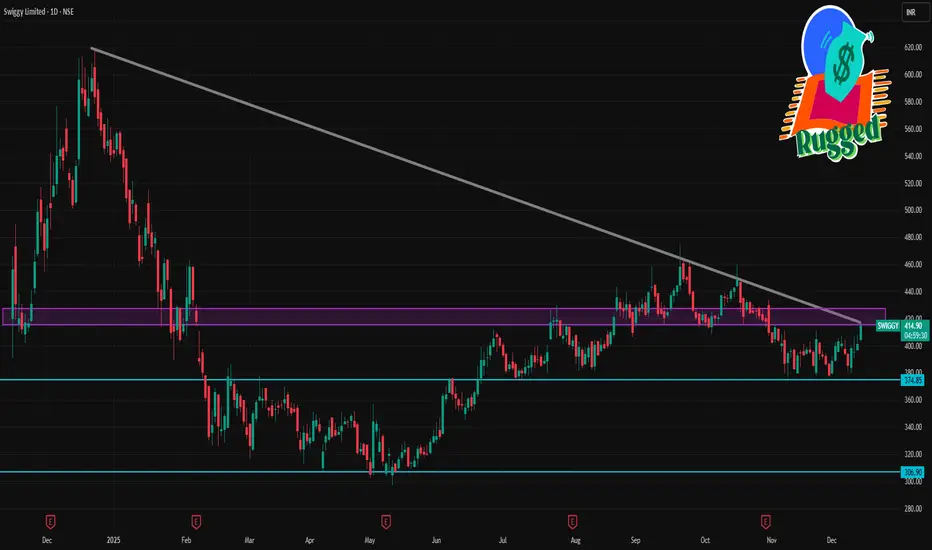
SWIGGY 1 Day Time Frame 📈 Latest Price Context (Today’s Trading)
📍 Approx Live Price: ~₹401 INR on NSE during today’s session with intraday swings between ~₹396 and ₹408.
📊 Daily Support & Resistance Levels (1-Day Chart)
🔹 Key Resistance
R1: ~₹404–₹406 — first resistance from intraday pivot/octave levels.
R2: ~₹409–₹414 — next resistance zone.
R3: ~₹420+ — extended weekly resistance.
🔸 Key Support
S1: ~₹388–₹390 — immediate support area.
S2: ~₹380–₹383 — secondary support closer to recent intraday lows.
S3: ~₹371–₹375 — deeper support if prices break down sharply.
🔁 Pivot
Daily Pivot Point: ~₹397–₹398 zone.
This pivot acts as the centerline bias — above it suggests bullish lean today, below it suggests selling pressure today.
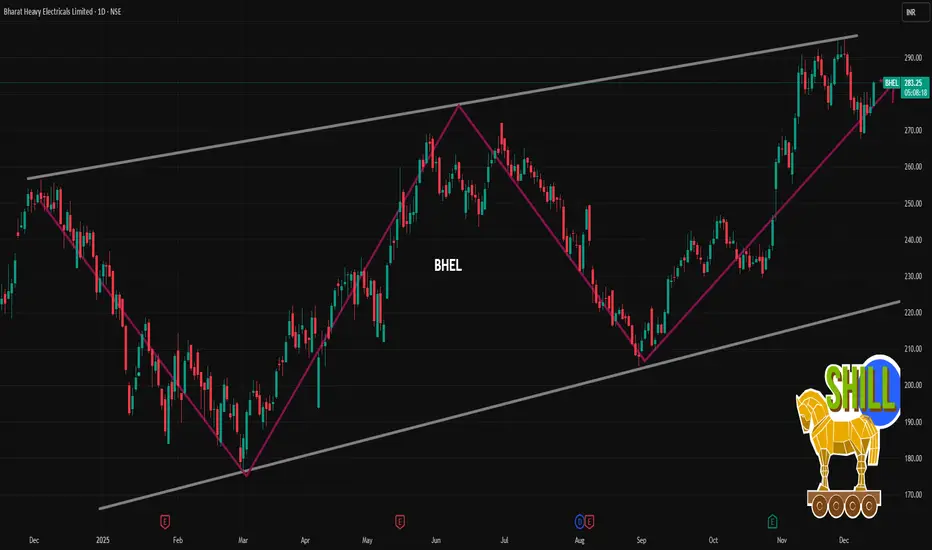
BHEL 1 Day Time Frame 📈 Live/Latest Price (1-Day View)
Current Price (approx): ~₹280.50–₹283.30 per share on NSE (latest intraday range) based on market data today.
Today’s Intraday High/Low: Roughly ₹273–₹279+ so far.
Previous Close / Today Open:
• Previous close near ₹277.75.
• Open around ₹275–₹286 depending on platform/time.
52-Week Range: Low ~₹176, High ~₹291–₹295+.
📊 1-Day Price Change
Recent trading shows relatively small daily movement indicating modest volatility typical of larger PSU stocks.
Gold 1H - Will 4287 Liquidity Cap Price or 4248 Reload Demand?🟡 XAUUSD – Intraday Smart Money Plan | by Ryan_TitanTrader (12/12)
📈 Market Context
Gold remains highly sensitive to political and inflation narratives after former U.S. President Donald Trump stated he “inherited the worst inflation in history” but now sees prices cooling rapidly.
This rhetoric adds uncertainty to inflation expectations and future rate paths, keeping USD flows unstable intraday.
For gold, this environment favors engineered liquidity sweeps rather than clean directional continuation, as institutions exploit both inflation hedging demand and short-term USD strength.
On H1, price is trading inside a rising structure with clear liquidity resting above recent highs and demand stacked below the mid-range — a textbook Smart Money setup.
🔎 Technical Framework – Smart Money Structure (1H)
Current Phase: Expansion after BOS, now pausing into premium
Key Idea: Expect a liquidity sweep into premium (4285–4287) or discount (4250–4248) before true displacement
Structural Notes:
• Prior BOS + CHoCH confirms bullish context
• Price currently reacting inside a rising channel
• Liquidity is clearly defined on both edges
Liquidity Zones & Triggers:
• 🔴 SELL GOLD 4285 – 4287 | SL 4295
• 🟢 BUY GOLD 4250 – 4248 | SL 4240
Institutional Flow Expectation:
sweep → MSS/CHoCH → BOS → displacement → FVG/OB retest → expansion
🎯 Execution Rules (matching your exact zones)
🔴 SELL GOLD 4285 – 4287 | SL 4295
Rules:
✔ Liquidity sweep above recent highs into premium
✔ Bearish MSS / CHoCH on M5–M15
✔ Downside BOS with strong bearish displacement
✔ Entry via bearish FVG refill or refined supply OB
Targets:
1. 4270
2. 4258
3. 4250 – 4248
🟢 BUY GOLD 4250 – 4248 | SL 4240
Rules:
✔ Liquidity grab below channel support / equal lows
✔ Bullish MSS / CHoCH confirms demand takeover
✔ Upside BOS + impulsive displacement from discount
✔ Entry via bullish FVG fill or demand OB retest
Targets:
1. 4265
2. 4280
3. 4287 – extension if momentum holds
⚠️ Risk Notes
• Trump’s inflation comments can trigger sharp sentiment flips → wait for structure, not headlines
• Avoid entries without clear BOS + displacement
• Don’t trade mid-range noise inside compression
• Reduce size if volatility spikes during U.S. news hours
📍 Summary
Today’s gold setup is pure liquidity engineering:
• A 4287 sweep may trigger bearish structure back into 4250
or
• A 4248 liquidity grab could reload bullish flow toward 4280–4287
Let structure confirm — Smart Money reacts, retail predicts. ⚡️
📌 Follow @Ryan_TitanTrader for daily Smart Money gold breakdowns.
