Part 12 Trading Master ClassCall Options
A call option benefits the buyer when the price of the underlying asset goes up.
For example, if a stock is trading at ₹100 and you buy a call option with strike price ₹105, you expect the price to rise above ₹105 before expiry. If the stock goes to ₹120, you can buy it at ₹105 and profit from the difference (minus premium). If it stays below ₹105, your loss is limited only to the premium paid.
Put Options
A put option benefits the buyer when the price of the underlying asset goes down.
If a stock trades at ₹100 and you buy a put with a strike price of ₹95, you expect it to fall. If the stock goes to ₹80, you can sell at ₹95 and keep the difference as profit. If price stays above ₹95, your maximum loss is only the premium.
Wave Analysis

Part 11 Trading Master Class What Are Options?
Options are financial contracts that give the buyer the right, but not the obligation, to buy or sell an underlying asset at a predetermined price (called the strike price) before or on a specific date. Unlike shares, which give ownership, options only provide trading rights.
There are two main types of options:
Call Option – gives the right to buy.
Put Option – gives the right to sell.
The buyer of an option pays a premium, while the seller (or writer) receives the premium and must fulfill the contract if the buyer exercises it.

XAUUSD is skyrocketing after the Adam & Eve pattern!OANDA:XAUUSD is really interesting right now. The price seems likely to rise further after the formation of the Adam & Eve pattern. With such an easy-to-remember name, the Adam & Eve pattern is one of the most memorable. Below, I’ll explain the reasons and how to easily recognize it.
The Adam pattern is characterized by a sharp drop, followed by a quick recovery, forming a "V" on the chart. High, sharp, and aggressive! You could say it's more "masculine."
On the other hand, the Eve pattern develops more slowly. The price becomes more rounded, forming a wider and smoother base before rising again, creating a shape similar to the letter "U." Softer, more curved, and more "feminine."
Combining these two elements gives us the Adam & Eve pattern, which often signals a potential trend reversal. Especially when accompanied by fundamental analysis or other strong technical indicators.
This pattern will stick in your mind when you connect its shapes to the male and female aspects. A pattern that's truly hard to forget.

XAUUSD - GOLD - Trying to catch TOP is like chasing your crush# Here are the key factors currently supporting gold:
Momentum remains bullish:
#GOLD has gained as markets increasingly price in a potential Federal Reserve interest rate cut.
Gold continues to be regarded as a safe-haven and hedge asset. Amid economic uncertainty, inflation concerns, geopolitical risks, and sustained demand from central banks and investors, gold retains its primary drivers.
# Here are the key technical levels to watch over the next month:
According to recent chart data:
The immediate support region is approximately $4,110–$4,010, which serves as a pivot zone. A break below this level could lead to further downside toward $3,817–$3,683.
On the upside, a breakout above $4,282–$4,325 could pave the way for a move toward $4,450–$4,550.
Target-6
If the current bullish momentum persists and supportive fundamental conditions remain in place, gold may target the level marked as 6 on the chart.
#Here are the factors most likely to influence the movement of XAU/USD in the near future:
1. U.S. interest rates and Federal Reserve policy.
2. U.S. economic data and inflation figures.
3. Strength or weakness of the U.S. dollar: Since gold is priced in U.S. dollars, a weaker dollar typically supports higher gold prices.
4. Geopolitical risk and global uncertainty: Global instability, trade tensions, or major macroeconomic concerns often drive investors toward gold as a safe-haven asset.
Conclusion
Gold will remain strong as long as key support levels hold and market sentiment remains favorable. With momentum in its favor, any dips are likely to present buying opportunities, while a clean breakout could initiate the next leg higher.
~ Disclaimer ~
High Risk Investment
Trading or investing in assets like crypto, equity, or commodities carries high risk and may not suit all investors.
Analysis on this channel uses recent technical data and market sentiment from web sources for informational and educational purposes only, not financial advice. Trading involves high risks, and past performance does not guarantee future results. Always conduct your own research or consult a SEBI-registered advisor before investing or trading.
This channel, Render With Me, is not responsible for any financial loss arising directly or indirectly from using or relying on this information.

Gold Bulls vs Bears: Who Will Win the $4,100 Battle?🧭 Market Overview
Current Price Zone: Gold is trading near $4,141.27, slightly below recent highs around $4,200.
52-Week Range: From a low of $2,583.49 to a high of $4,381.60, indicating strong bullish momentum over the past year.
Recent Action: Price is consolidating between $4,040 and $4,080, suggesting a pause after a multi-month rally.
📊 Technical Indicators
Trend: Long-term bullish, but short-term momentum is neutral to slightly bearish.
Support Zones:
$3,987: 55-day SMA, acting as a dynamic support.
$3,886: Weekly low, a key horizontal support level.
Resistance Zones:
$4,245: November high, first major resistance.
$4,380: All-time high, ultimate bullish target.
Momentum Indicators:
RSI and MACD show weakening bullish momentum.
Stochastics and Williams %R suggest potential overbought conditions.
📐 Chart Analysis
Demand Zone: The grey rectangle around $4,173.23 likely marks a support area where buyers previously stepped in.
Stop-Loss Zone: The red rectangle below current price could represent a risk threshold for long positions.
Take-Profit Zone: The upper grey rectangle suggests a bullish target zone, possibly aligned with the $4,245–$4,380 resistance band.
Time Markers: Vertical red dashed lines may indicate key news events or session starts that influenced volatility.
🧠 Strategic Insights
Bullish Scenario: A breakout above $4,245 could trigger a run toward $4,380. Traders may look for confirmation via volume spikes or bullish candlestick patterns.
Bearish Scenario: A breakdown below $4,040 could expose the $3,987 and $3,886 supports. Watch for bearish divergence in momentum indicators.
Neutral Bias: Until price breaks out of the current range, scalping or range-bound strategies may be more effective than trend-following.
🛠 Trade Setup Suggestions
Entry: Consider entries near $4,100 if bullish signals emerge (e.g., bullish engulfing, MACD crossover).
Stop-Loss: Below $4,040 or $3,987 depending on risk tolerance.
Take-Profit: Target $4,245 initially, with extended targets at $4,380 if momentum continues.
🔍 Final Thoughts
Gold’s technical landscape is rich with opportunity but demands precision. The current consolidation phase is a battleground between bulls and bears. Traders should stay nimble, monitor macroeconomic cues (like Fed rate decisions), and adjust risk management accordingly.

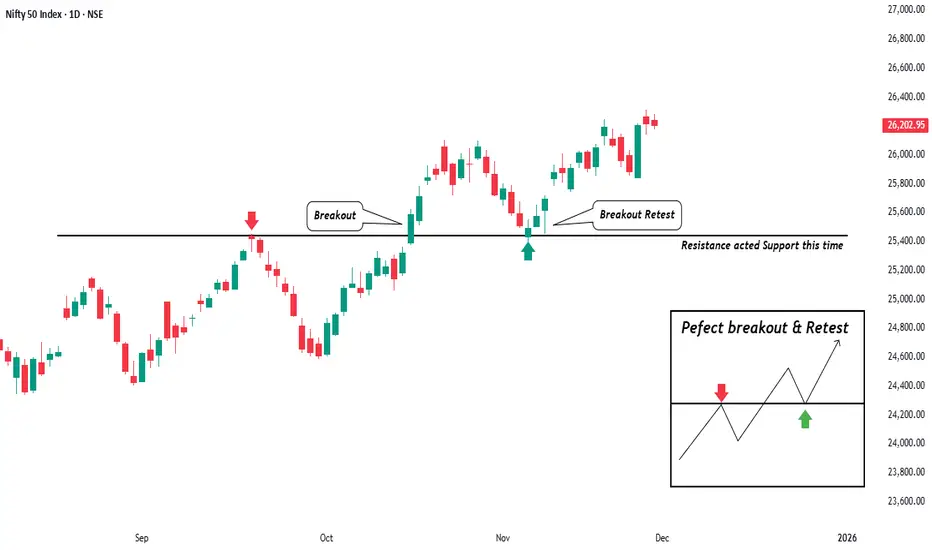
Breakout Retest Perfect PictureHello TradingView community, friends, and fellow traders.
I hope everyone is doing well with patience and clarity. Sharing a fresh price action observation on Nifty that clearly shows one of the most important concepts every trader should understand how the market behaves after a breakout.
On this chart, price had been facing repeated rejection from the same area, showing that it was a strong resistance zone. Sellers were clearly active at that level and price struggled to move higher. When price finally broke above this level with strength, it was the first sign that buyers were starting to take control.
What makes this setup valuable is not just the breakout itself, but what happened next. Instead of continuing straight upward, price came back to test the same area from above. This is the moment where most traders get confused, and many exit early or panic. In reality, this retest is the market checking whether the breakout was genuine or not.
When the old resistance starts acting as a support, it confirms something very important the market has accepted a new price range. This shift is known as role reversal, where selling pressure is replaced by buying interest. It also shows that buyers are now willing to defend the same level that sellers once controlled.
This is why breakouts should not be chased blindly. A breakout without confirmation often leads to false signals, but a breakout followed by a successful retest builds trust in the structure. The retest gives traders a chance to see whether the level holds and whether the trend is likely to continue.
As long as price remains above this support zone, the bias stays positive and the trend favors buyers. If price starts closing below this level, it would indicate weakness and failure of structure. The chart always gives clarity we just need to read it without emotion.
The biggest lesson here is patience. Markets reward those who wait for confirmation, not those who rush for entries. Breakout shows intention, but retest shows strength.
I hope this idea helps you see structure more clearly and trade with more confidence. Always remember, price action is not random. It tells a story, and every level has meaning if you know how to read it.
Wishing you all clarity, discipline, and consistency in your trading journey.
Trade safe and stay focused.
Regards- Amit.
BITCOIN is ready for ALL TIME HIGH !! Bitcoin is making Rising channel on a weekly timeframe
In which its making 5 wave structure
Also Bitcoin has given the breakout of Head and shoulder pattern, and BTC has achieved its Linear Target and now down 35%
Also while going up Bitcoin is making Rising channel
Both are indicating super bullish pattern in Bitcoin
In Rising channel, Bitcoin is making 5 wave structure and now last leg of Rising channel is coming around 148000/150000 range
Also Head and shoulder of pattern target (Log chart) is coming around 180000/190000
Bitcoing will achieve both the targets but let Bitcoin come around 150000 and then we can expect 190000 targets in months to come
For next 1 year, Expecting super bullishness in the Bitcoin
Thank You !!

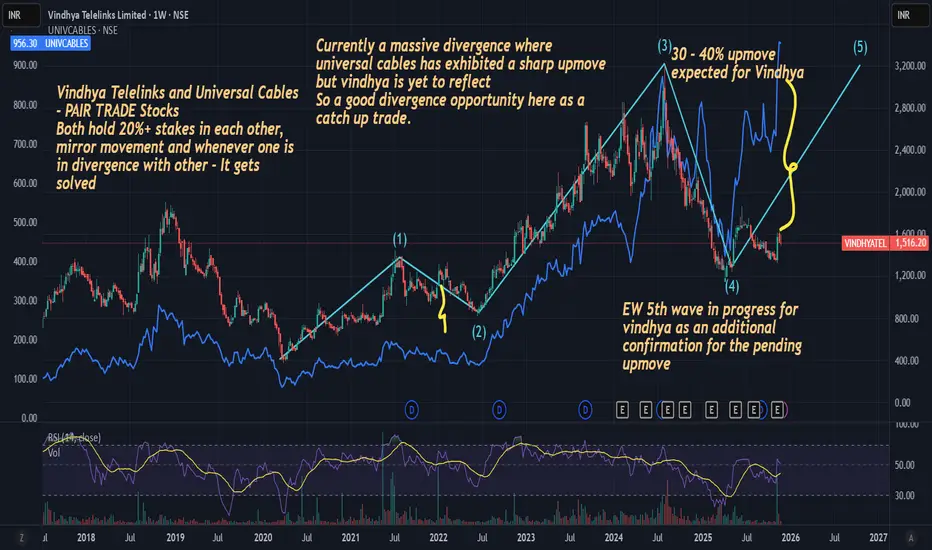
Vindhya Telelinks - Ripe for a Solid Upmove + A divergence playVindhya Telelinks has started with 5th EW wave, marking a last pending bull move for the stock
The Stock is also a pair trade play alongside another scrip Universal Cables. Both hold individual stakes in each other and have a long history of complementing moves together. Can check with the Chart
Here divergences between two are often created and stocks catch up with each other.
Currently Vindhya telelinks hasn't moved compared to Universal cable's move that's been done already.
Hence the EW 5th wave + divergence upmove is an additional confirmation for a strong 30-40% upmove from current levels.
NIFTY BLOW OFF TOP WITH GDP DATAI see nifty forming a blow off top on monday with the Gdp data of 8.2 of q2 ..
monthly, weekly, daily top open high same
Later falls by 18800 in the black wxy pattern forming bigger time frame wave a.
Even the last leg of uside forming diamteric bow tie pattern of neo wave theory..
ABCDEFG.. all are coming close to complete..
this December will be great to watch..
If it happen in the said time line then we are going to see a big bear market..
Welcome to 1929 again.. Fingers crossed..
* ONLY FOR TUTORIAL PURPOSE, DONOT TRADE ON THIS VIEW..

Part 9 Trading Master ClassRisks in Option Trading
1. High Losses for Option Sellers
Naked call sellers face unlimited loss potential.
2. Time Decay
An option loses value as it approaches expiry.
3. Complex Pricing
Options require understanding of volatility, Greeks, and probability.
4. Liquidity Problems
Illiquid options cause slippage and wide bid-ask spreads.
5. Emotional Trading
Fast-moving markets can cause panic among new traders.

Technical Analysis vs Fundamental Analysis1. Introduction
Financial markets are influenced by a vast network of economic, psychological, and structural forces. To understand price movements, one must either study the intrinsic value of an asset or analyze its price behavior. This is where fundamental and technical analysis come into play.
Fundamental analysis evaluates securities by examining economic, financial, and qualitative factors. Its purpose is to estimate the true value (fair value) of a stock, commodity, or currency.
Technical analysis, on the other hand, focuses solely on market data—primarily price and volume—to forecast future price movements. It assumes that all known fundamentals are already reflected in price.
2. What Is Fundamental Analysis?
Fundamental analysis studies the underlying factors influencing a company or economy. It aims to determine whether an asset is overvalued, undervalued, or fairly valued.
Key Components of Fundamental Analysis
a) Financial Statements
Investors examine:
Balance sheet (assets, liabilities, equity)
Income statement (revenue, net profit)
Cash flow statement (cash inflow/outflow)
These help measure profitability, leverage, growth, liquidity, and operational efficiency.
b) Economic Indicators
Macro factors influence overall market conditions:
GDP growth
Inflation
Interest rates
Employment data
Fiscal and monetary policy
For example, rising interest rates often reduce stock market returns.
c) Industry Analysis
Analyzing:
Industry growth rate
Competition
Market share
Regulatory environment
A strong company in a weak industry may still underperform.
d) Qualitative Aspects
These include:
Management quality
Corporate governance
Brand value
Innovation and product pipeline
Customer loyalty
Such factors often drive long-term performance.
e) Valuation Models
Popular methods include:
Discounted Cash Flow (DCF)
Price-to-Earnings (P/E) ratio
Price-to-Book (P/B) ratio
EV/EBITDA
Dividend Discount Model (DDM)
These help estimate fair value compared to the market price.
3. What Is Technical Analysis?
Technical analysis predicts future price movements based on historical market data such as price, volume, and market sentiment. It is commonly used by traders rather than long-term investors.
Key Components of Technical Analysis
a) Price Charts
Different chart types help visualize market patterns:
Candlestick charts
Line charts
Bar charts
Heikin-Ashi
Candlestick patterns like Doji, Hammer, and Engulfing reveal market psychology.
b) Indicators and Oscillators
Traders use mathematical tools to identify trends, strength, and reversals:
Moving Averages (MA)
RSI (Relative Strength Index)
MACD
Bollinger Bands
Stochastic Oscillator
Volume indicators
Each provides signals on market entry and exit.
c) Chart Patterns
Patterns help anticipate future price movements:
Head and Shoulders
Double Top/Double Bottom
Triangles
Flags and Pennants
Cup and handle
These patterns often repeat due to consistent human behavior.
d) Trend Analysis
One of the most important principles:
Uptrend (higher highs, higher lows)
Downtrend (lower highs, lower lows)
Sideways trend (range-bound market)
Traders follow the trend to reduce risks.
e) Support and Resistance
Key price zones where buying/selling pressure increases:
Support: where price tends to bounce up
Resistance: where price tends to fall back
Breakouts and breakdowns are major trading signals.
4. Philosophy Behind Both Analyses
Fundamental Analysis Philosophy
Market price does not always reflect true value.
Over time, price will converge toward intrinsic value.
Best for long-term investors who want to buy undervalued assets.
Technical Analysis Philosophy
Price discounts everything (news, emotions, fundamentals).
Price moves in trends.
Market psychology causes patterns that repeat over time.
Best for traders focusing on short to medium time frames.
5. Time Horizon Differences
Fundamental Analysis
Long-term approach (months to years)
Used by investors, mutual funds, and institutional players
Suitable for wealth creation
Technical Analysis
Short-term to medium-term (minutes to weeks)
Used by day traders, swing traders, scalpers
Suitable for frequent trading
6. Advantages and Limitations
A) Fundamental Analysis – Pros
Helps identify long-term investment opportunities
Provides deep understanding of a company
Works well for building wealth
Useful for identifying high-quality businesses
Fundamental Analysis – Cons
Time-consuming and complex
Markets can remain irrational longer than expected
Not effective for short-term trading
Sudden news/events can invalidate analysis
B) Technical Analysis – Pros
Helps with precise entry and exit timing
Works in all markets (stocks, forex, crypto, commodities)
Quick and efficient
Useful even without deep company knowledge
Technical Analysis – Cons
False signals are common
Over-reliance can lead to overtrading
Requires discipline and psychological control
Patterns may fail during high volatility
7. Which One Should You Use?
For Long-term Investors
Fundamental analysis is superior because it focuses on:
business strength
financial health
long-term growth potential
It helps identify companies that compound wealth over time.
For Short-term Traders
Technical analysis works better due to:
market-timing capabilities
entry/exit precision
chart-based signals
Short-term price movement is mostly driven by psychology, liquidity, and volatility—technical tools capture this better.
8. Combining Both Approaches (Best Practice)
Many professionals use a hybrid approach, known as Techno-Fundamental Analysis.
Example Strategy:
Use fundamental analysis to identify strong companies.
Use technical analysis to find the right entry point.
This method gives investors both quality and proper timing.
9. Conclusion
Technical analysis and fundamental analysis are powerful tools, each serving different purposes in trading and investing. Fundamental analysis focuses on understanding value, financial health, and long-term prospects of assets. Technical analysis emphasizes price behavior, market psychology, and timing of trades.
An ideal market participant should understand both; investors rely more on fundamentals, while traders depend heavily on technical tools. Combining both approaches enhances decision-making and offers the best balance of knowledge and timing—crucial for consistent success in financial markets.
Option Chain Analysis1. Understanding the Structure of an Option Chain
An option chain typically has two halves:
Left side → Call Options (CE)
Right side → Put Options (PE)
Each row corresponds to a strike price, and each strike shows several key data points:
Common Columns in CE & PE:
OI (Open Interest) – Total active contracts that are not yet closed.
Change in OI – Shows whether new positions are being built (addition) or squared off (reduction).
Volume – Number of contracts traded during the day.
LTP (Last Traded Price) – Price of the option premium.
Bid/Ask Prices – Best current buy and sell prices.
Implied Volatility (IV) – Market expectation of volatility.
The strike price sits in the center of the table, dividing Call and Put data.
2. Why Option Chain Matters
Option chain analysis allows a trader to:
✓ Identify trend direction
Increasing call writing may suggest bearish sentiment, while heavy put writing may suggest bullish sentiment.
✓ Spot support and resistance
High Put OI indicates strong support.
High Call OI indicates strong resistance.
✓ Understand market liquidity
Higher OI and volume mean more active participation and better entry/exit execution.
✓ Track institutional activity
Big spikes in OI usually represent large participants (FII, proprietary desks).
✓ Predict short-term price movements
Based on the balance between CE and PE data.
3. Key Components of Option Chain Analysis
A. Open Interest (OI)
(Open Interest is the heart of option chain analysis.)
Rising OI + rising price → Long Build-Up
Rising OI + falling price → Short Build-Up
Falling OI + rising price → Short Covering
Falling OI + falling price → Long Unwinding
These combinations provide clues about ongoing market activity.
B. Change in Open Interest
This tells you what is happening today.
Example:
If Put OI is rising fast, traders expect the market to stay above that strike → support.
If Call OI is rising sharply, traders expect resistance at that strike.
C. Option Premium and LTP Movement
Premiums often rise due to:
Trend strength
Increased volatility (IV)
Time remaining to expiry
Premiums collapse due to:
Trend reversal
Drop in IV
Time decay (theta)
D. Implied Volatility (IV)
IV reflects expected movement.
High IV → high uncertainty → expensive options
Low IV → low uncertainty → cheaper options
IV also jumps ahead of major events such as RBI policy, budget, US Fed meetings, elections, etc.
4. Identifying Support & Resistance from Option Chain
This is one of the most practical uses of option chain.
A. Finding Support Levels
Support is identified by:
Highest Put OI
Sharp increase in Put OI
Put writers actively defending a strike
Put writers (sellers) are usually strong hands, so they provide floor/ support.
For example:
If 22,000 PE has the highest OI, then 22,000 becomes strong support.
B. Finding Resistance Levels
Resistance is identified by:
Highest Call OI
Big Call OI additions
CE writers defending a strike
If 22,300 CE has the highest OI, then 22,300 becomes strong resistance.
5. PCR (Put-Call Ratio) Analysis
PCR is a sentiment indicator extracted from the option chain:
PCR = Total Put OI / Total Call OI
Interpretation:
PCR > 1 → bullish sentiment (more puts written)
PCR < 1 → bearish sentiment (more calls written)
PCR around 0.8–1.2 → neutral market
PCR extremes:
Around 1.5–1.8 → overbought (possibility of downtrend soon)
Around 0.5 or lower → oversold (possibility of uptrend)
6. OI and Price Action Combination
Combining price action with OI gives the highest accuracy.
Bullish Signs
Increasing Put OI at lower strikes
Decreasing Call OI
Price closing above major CE writing zones
PCR rising
Bearish Signs
Increasing Call OI at higher strikes
Heavy CE writing above spot
Price closing below major PE supports
PCR declining
Sideways Signals
Both CE and PE addition at surrounding strikes
Narrow PCR near 1.0
Option premiums decaying fast
7. Option Chain Traps and Short Squeezes
Option chain also reveals squeeze situations:
Short Squeeze (Bullish Explosion)
Heavy Call OI begins to unwind
Price breaks above resistance
CE writers forced to exit → premiums rise sharply
Long Liquidation (Bearish Slide)
Heavy Put OI unwinds
Price breaks below support
PE premiums shoot up
These moves are usually fast and violent.
8. How to Use Option Chain for Intraday Trading
Intraday traders use:
A. Change in OI (minute-by-minute)
This reveals immediate momentum.
B. Straddle & Strangle Levels
High combined premium = expected movement range.
C. ATM (At-the-Money) Behavior
If ATM call OI rises → bearish
If ATM put OI rises → bullish
D. Premium Breakout Zones
Sharp change in CE or PE premium suggests a trending move starting.
9. Expiry Day Option Chain Analysis
Expiry days are different because:
Time decay is extreme
OI changes rapidly
Range-bound behavior is common
On expiry:
Highest CE + PE OI combination often predicts the max pain level (where sellers profit the most)
Prices tend to gravitate around this level
10. Max Pain Theory
Max Pain = Strike price where option buyers lose maximum money.
It is calculated from the option chain.
On expiry day, price often moves toward max pain.
11. Option Chain for Swing and Positional Trading
Positional traders use:
Total OI across all strikes
IV trends
Monthly expiry data
Support/resistance based on long-term OI
If Put OI is high for next month → bullish for swing trades.
If Call OI dominates → bearish.
12. Mistakes Traders Make in Option Chain Reading
Only checking OI without price action
Ignoring IV changes
Misinterpreting unwinding phases
Trading without considering broader market events
Following high OI blindly without confirming by price behavior
Option chain should be combined with technical analysis for best results.
13. Practical Example Summary (How a Trader Should Use the Chain)
Identify highest PE OI → support
Identify highest CE OI → resistance
Analyze Change in OI → fresh positions being created
Check PCR → market sentiment
Observe IV → volatility expectations
Track premium movement → strength of buyers or sellers
Combine with price action to confirm trend
Final Thoughts
Option Chain Analysis is a vital skill for traders in index and stock derivatives. It reveals the psychology of option writers, helps identify crucial levels, indicates short-term momentum, and offers insights into market direction. When used properly along with charting tools, it significantly enhances accuracy in intraday, swing, and expiry trading.
A small correction likelyHerohonda CMP 6174
Gap - since runaway gaps form in the middle of the move, I have used the box to measure it on the right. The same height box on top of it is telling the rally is over.
Elliott- since wave 1 and wave 5 are generally equal, mkt geometry is telling the current highs is a potential strong resistance.
Composite- the oscillator under the MA cross is very negative. Which is confirming the resistance in price.
Conclusion - A three wave abc correction should bring the stock back to 5300. So we are taking about a 15% correction and thats not a lot considering its stupendous rise from the lows. The setup further confirms the correction that we are waiting for.

CAD/CHF Short term Sell IdeaAs per wave analysis, CAD/CHF looks bearish for short term for an target of 0.56810

Gold 4H – Can XAUUSD reject 4245 before diving into 4140?📈 Market Context
Gold rallied as the U.S. dollar closed softer on repriced Fed rate-cut expectations, with market headline flow confirming USD finishes lower and gold rallies on renewed cuts timing debates — a setup that encourages external liquidity raiding before weekly direction is revealed. Forex Factory
4H conditions are classic for liquidity engineering: price trades near balanced mid-range flows, institutions exploit USD weakness into weekly open, and both buyer/seller pools are vulnerable to strategic sweeping before expansion.
Expect volatility spikes around U.S. session opens and PMI headline catalysts.
🔎 Technical Analysis (4H / SMC View)
🟢 Buy Zone: 4140–4138
SL: 4130
TP targets: 4175 → 4200 → 4220 → 4250 → 4280+
Rationale:
• Discount zone beneath 4H liquidity shelf
• Demand mitigation + accumulation narrative after sweep
🔴 Sell Zone: 4245–4247
SL: 4255
TP targets: 4220 → 4200 → 4175 → 4150 → 4140
Rationale:
• Premium supply above equal-high liquidity
• 4H imbalance magnet below waiting to be filled
⚠️ Risk Management Notes
• Wait for M15 ChoCH / BOS confirmation before entries — avoid blind positioning.
• Expect wider spreads and wick manipulation on USD headline releases.
• Avoid trading 10–20 minutes before high-impact USD news (PMI, Fed speakers).
• Scale partials at each TP level, let runners work only after confirmation is printed.
Summary
Gold remains in 4H rangebound engineering territory where Smart Money is likely to sweep premium above 4245, deliver a correction to 4140, then seek a validated bullish reaction from discount demand on confirmed USD volatility.
Patience and confirmation first. Liquidity always wins.
🚀 Follow @Ryan_TitanTrader for more weekly SMC setups

Part 6 Learn Institutional TradingWhy Trade Options?
Options offer several strategic advantages:
a. Hedging
Investors use options to protect their portfolio. For example, buying a put option can insure against a fall in stock prices, similar to buying insurance.
b. Speculation
Traders can bet on price movements—up, down, or even sideways—using options.
c. Income Generation
Many traders sell options (covered calls, cash-secured puts) to earn regular premiums.
d. Leverage
Options allow control of large positions with a relatively small amount of capital.

Part 3 Learn Institutional Trading What Are Options?
An option is a contract that gives the buyer the right, but not the obligation, to buy or sell an underlying asset at a predetermined price—known as the strike price—before or on a specific date called the expiry.
There are two types of options:
Call Option – Gives the right to buy an asset.
Put Option – Gives the right to sell an asset.
The buyer of an option pays a fee called the premium, which is the price of the contract.
In India, stock options follow an American-style exercise, allowing early exercise, while index options are European-style, meaning they can only be exercised on expiry day.

Gold 4H – Liquidity Plays Ahead of Fed Minutes & PMI Data🥇 XAUUSD – Weekly Smart Money Outlook | by Ryan_TitanTrader
📈 Market Context
Gold continues to trade inside a controlled 4H consolidation as markets brace for a highly event-driven week: U.S. PMI releases, updated Fed guidance, and renewed debates over the timing of future rate cuts.
Recent data has shown mixed momentum — softer employment trends but steady business activity — keeping the dollar volatile and gold reactive near mid-range liquidity.
Institutional flows remain cautious, reducing aggressive positioning ahead of major macro catalysts. This environment typically leads to engineered sweeps on both sides of the range as Smart Money hunts liquidity before revealing direction.
Expect short-term volatility spikes, especially around U.S. session opens and PMI releases.
🔎 Technical Analysis (4H / SMC View)
• Price is navigating a minor bearish structure, forming lower highs while protecting deeper liquidity beneath 4020.
• The recent 4H BOS + corrective pullback suggests the market may generate a liquidity grab toward the discount zone before any strong bullish leg develops.
• A Premium Sell Zone at 4225–4227 sits above resting liquidity, making it an ideal region for stop hunts and short-term distribution.
• The Discount Buy Zone at 4010–4008 aligns with structural reaction points, unmitigated demand, and a liquidity shelf — ideal for accumulation.
• Mid-range liquidity around 4060–4080 may be swept before the market chooses a larger weekly direction.
🟢 Buy Zone: 4010–4008
SL: 4000
TP targets: 4085 → 4120 → 4175 → 4220
Rationale:
• Deep discount zone beneath 4H liquidity
• Confluence of demand + structural mitigation
• High probability of engineered sweep before bullish expansion
🔴 Sell Zone: 4225–4227
SL: 4235
TP targets: 4175 → 4120 → 4060 → 4015
Rationale:
• Premium supply above equal-high liquidity
• Favors stop hunt + distribution before correction
• Aligns with previous 4H rejection and imbalance fill
⚠️ Risk Management Notes
• Wait for M15 ChoCH / BOS inside each zone before entering — avoid blind entries.
• Expect spreads and liquidity manipulation around news: US PMI, Fed speeches, and data surprises.
• Avoid trading 10–20 minutes before high-impact events.
• Scale partial profits at each structural target to secure gains and let runners develop.
✅ Summary
Gold remains trapped in a structured 4H range where Smart Money is likely to sweep one side before delivering a decisive expansion.
Discounted buys at 4010–4008 and premium sells at 4225–4227 remain the highest-probability weekly setups.
Stay patient, respect liquidity, and follow confirmation.
🔔 FOLLOW @Ryan_TitanTrader for more weekly SMC setups 🚀

CADJPY could keep rising furtherOANDA:CADJPY The market has been on a clear upward trajectory for some time, with each swing reaching higher peaks and forming higher lows. The rising trendline has been the driving force behind this momentum.
Following the recent surge, the price has pulled back slightly, forming a textbook bullish flag pattern.
This is the kind of price action you want to see in a strong uptrend—a controlled retracement with a minor dip, without any aggressive selling pressure.
The bears have failed to break the low, and the bullish momentum remains intact. As a result, the overall trend continues to hold steady.
Right now, the price is breaking out of the flag pattern, and it looks like this trend is poised to continue.
As long as the price stays above the trendline and doesn’t breach the flag's low, my outlook remains bullish.
My target is set at 113.150.

“GOLD MEGA RALLY: Road to $6,500 — Super-Cycle in Full Power
Gold has broken above $4,200/oz, confirming that a super-cycle has officially started. The breakout is not just technical — it is backed by global liquidity, record central-bank demand, and collapsing real yields.
My view: Gold is preparing for a parabolic rally toward $6,500 next year, where a major cycle top is likely to form.
🔥 Why Gold Can Hit $6,500
* Liquidity Cycle Turning Up
Fed QT slowdown + rising expectations of QE → strongest setup for commodities in a decade.
* Historic Central Bank Buying
China, India, Middle East are accumulating gold aggressively → long-term supply squeeze.
* Inflation Pressure Still Alive
Sticky inflation + slowing growth = real yields trending lower → ultra-bullish for gold.
* Geopolitical Premium
Safe-haven flows accelerating with every global conflict headline

Part 2 Ride The Big Moves Option Trading in India (NSE)
Popular tradable contracts:
NIFTY 50 (weekly & monthly expiry)
BANK NIFTY (weekly expiry)
FINNIFTY (weekly expiry)
MIDCAP NIFTY
Stock Options
Lot sizes:
Nifty: 25
Bank Nifty: 15
Finnifty: 40 (subject to change by NSE)
Stock options have higher margins and different lot sizes.

Gold H1 – Will 4212 Hold and Drop to 4160 Today?🟡 XAUUSD – Intraday Smart Money Plan | by Ryan_TitanTrader (27/11)
📈 Market Context
Gold is currently trading within a rising institutional channel after strong H1 displacement. The market is compressing into a liquidity-rich consolidation phase — a classic Smart Money trap environment before engineered expansion.
What Smart Money desks are targeting today:
• Expectation of USD strength shaping bearish bias
• Liquidity sweeps above internal range highs
• Consolidation fakeouts to induce retail mis-positioning
• CHoCH/BOS confirmation required before real directional move
The chart shows equal liquidity zones positioned at premium (sell opportunity) and discount (re-entry buy region).
🔎 Technical Framework – Smart Money Structure (H1)
Current state = Accumulation / Redistribution phase
Liquidity map highlighted zones:
• Premium liquidity zone: 4212 – 4214 (target for short trap)
• Discount liquidity origin zone: 4165 – 4163 (higher timeframe demand re-entry)
• Equilibrium / Chop zone: 4180 – 4195 (no trade unless displaced)
• Trendline support: ~4173 region (must break for downside continuation)
Expected sequence:
Sweep → CHoCH/MSS → BOS → Displacement → Retest (FVG/OB) → Expansion
🎯 Trade Plans for Today
🔴 SELL GOLD 4212 – 4214 | SL 4222
Thesis: Liquidity sweep at premium highs before bearish displacement
Entry activation rules (must wait):
• Price taps 4214 liquidity pocket
• Bearish CHoCH/MSS + BOS down on M5–M15
• Entry taken at FVG fill or order block retest after BOS
Targets:
1. 4200 (first reaction)
2. 4187 – 4185 (BOS retest zone)
3. 4170 (channel mid-equilibrium)
4. 4165 – 4163 (H1 demand retest / profit core)
🟢 BUY GOLD 4165 – 4163 | SL 4143
Thesis: Discount origin tap for impulse continuation buy
Entry activation rules (must wait):
• Price sweeps into 4163 pool
• Bullish CHoCH/MSS + BOS up on M5–M15
• Strong bullish rejection wick + FVG fill confirmation
Targets:
1. 4185 – 4187 reclaim zone
2. 4200+ institutional expansion target
3. 4212+ premium revisit
⚠️ Risk Management
• Avoid trading inside 4180 – 4195 unless displaced
• Do NOT interpret sweeps as trend entries — they are traps
• SL = structure invalidation, no averaging in consolidation
• Reduce size during monetary headlines unless MSS confirms
📝 Summary
Gold is currently in engineered liquidity mode. Expect either:
• Sweep 4214 → MSS/BOS down → drop into 4163 discount retest,
or
• Tap 4163 → bullish MSS/BOS up → expand toward 4200 – 4212+
Today = confirmation-based execution only, not trend chasing.
📍 Follow @Ryan_TitanTrader for daily Smart Money updates.

Part 1 Ride The Big Moves Types of Option Trading Strategies
a. Bullish Strategies
Long Call – Buy CE
Bull Call Spread – Buy CE and Sell higher CE
Cash Secured Put – Sell PE with intention to buy shares
b. Bearish Strategies
Long Put – Buy PE
Bear Put Spread – Buy PE and Sell lower PE
Covered Call – Sell CE while holding shares
c. Neutral Strategies
Straddle – Buy both CE and PE
Strangle – Buy OTM CE and PE
Iron Condor – Sell CE & PE with hedges to capture premium
Butterfly Spread – Low risk, limited profit strategy
Neutral strategies are popular on weekly expiry days when markets stay range-bound.
