Mind boggling rally in SilverSilver | Daily & Weekly Elliott Wave Perspective
A truly mind-boggling rally is unfolding in Silver.
This daily chart shows only a part of a much larger impulsive structure that becomes clearer on the weekly timeframe. The advance has been in motion since April 2025, and the internal wave development is text-book so far.
On the daily chart:
Wave 1 and wave 3 are equal in length, a classic Elliott Wave relationship.
Wave 5 is clearly extended, yet not complete at present.
The structure remains impulsive, supported by shallow corrections and strong upside momentum.
However, the bigger message comes from the weekly chart:
The ongoing move is still part of a larger degree wave 3.
This implies that what we are witnessing on the daily chart is only a sub-wave within a much broader bullish phase.
Completion of this weekly wave structure points to significantly higher levels ahead, well beyond what the daily projection alone suggests.
As long as the impulsive structure holds and key supports remain intact, the broader trend in Silver continues to favor higher targets over time. Corrections, when they occur, should be viewed in the context of a powerful higher-degree advance rather than a trend reversal.
Patience and perspective are crucial at this stage of the cycle.
Like this post if it helps you.Follow me to get updates
Wave Analysis

Elliott Wave Analysis – XAUUSD | November 15, 2025
Momentum
– Daily (D1) momentum is currently compressing and overlapping, with early signs of a potential reversal starting to appear. We need to wait for clear confirmation from D1 momentum; once confirmed, the market is likely to experience at least several bearish days.
– H4 momentum is currently preparing to reverse to the upside. Therefore, during today’s session, we expect a short-term bullish move lasting at least several H4 candles.
– H1 momentum is also preparing to reverse higher, suggesting that in the near term, price may form a short-term bullish move.
Wave Structure
– On the D1 timeframe, under the newly updated wave labeling, price is currently trading around the top of Wave 5. We continue to wait for confirmation of a bearish reversal from D1 momentum, which is highly likely to mark the peak of Wave 5.
– On the H4 timeframe, price action near the top of Wave 5 shows overlapping wave structures. Combined with D1 momentum preparing to reverse lower, this indicates that the bullish trend is weakening. The scenario of Wave 5 developing into an ending triangle is gradually becoming clearer.
– On the H1 timeframe, the low of the black Wave 4 has been confirmed around the 4566 price zone. If the current decline breaks below this level, it would strongly suggest that black Wave 5 has already completed and the market has entered a corrective phase.
– From the Volume Profile perspective, strong support is identified around the 4581 zone. Together with H1 and H4 momentum being in the oversold area and preparing to reverse higher, we expect the current pullback to be Wave 2 within the bullish structure of black Wave 5.
– The target area for the current corrective move is expected to complete around this support region, which is also the preferred area for executing buy positions.
– However, due to the ongoing wave overlap, the possibility of Wave 5 forming an ending triangle cannot be ruled out. At this stage, it is still too early to confirm this scenario; therefore, continued observation and confirmation are required.
– The upside targets for black Wave 5 remain unchanged at the 4654 and 4706 zones. According to yesterday’s plan, we continue to look for sell opportunities around these areas. Nevertheless, under the current conditions, special caution is required at the 4654 zone, and short positions should only be considered after clear confirmation.
Trading Plan
– Buy Now: 4591 – 4589
– Stop Loss: 4571
– TP1: 4622
– TP2: 4654

S&P 500: Late-Stage Structure Worth WatchingThe S&P 500’s recent advance is showing overlapping price action and narrowing ranges , raising the possibility of a developing Ending Diagonal near the highs.
Internally, the move lacks impulsive strength , with Wave (v) struggling for follow-through and RSI hovering around the mid-50s, suggesting momentum is not confirming price . This behavior is more typical of a terminal phase than a trend expansion.
That said, this is not a confirmed top . A break below the lower diagonal would support the bearish case, while strong acceptance above recent highs would invalidate the diagonal view.
For now, this remains a caution zone , not a conviction call.
Disclaimer: This analysis is for educational purposes only and does not constitute investment advice. Please do your own research (DYOR) before making any trading decisions.

Gold isn’t trending today — it’s rotating to engineer liquidity.🟡 XAUUSD – Intraday Smart Money Trading Plan
📈 Market Context
Gold remains structurally bullish on the higher timeframes, following a strong expansion into previous highs. However, today’s price action is not impulsive. Momentum has slowed, and the market is transitioning into a rotation and rebalancing phase.
With USD volatility, shifting Treasury yields, and ongoing rate-cut speculation, Smart Money is no longer chasing price. Instead, liquidity is being manufactured between premium and discount zones through inducement, stop hunts, and controlled pullbacks.
Today is about execution, not prediction.
🔎 Technical Framework – Smart Money Structure (H1–M15)
Market Phase:
HTF bias: Bullish (BOS confirmed)
Intraday: Corrective rotation after buy-side liquidity delivery
Key Observations:
Buy-side liquidity has already been taken
Price is rotating, not expanding impulsively
Internal FVG acts as a downside magnet
Discount demand aligns with HTF EMA + order blocks
💧 Liquidity Zones & Trade Scenarios
🔴 SELL XAUUSD 4643 | SL 4648
Narrative: Premium Distribution
Price may retrace into a premium zone where Smart Money looks to distribute positions after inducing late buyers.
Entry Conditions:
✔ Price taps the 4643 premium zone
✔ Liquidity sweep above recent highs
✔ Bearish MSS / CHoCH on M5–M15
✔ Clear downside BOS
✔ Entry via bearish FVG or supply OB
Targets:
4610 — internal reaction
4585 — main liquidity pool
Trail aggressively (distribution setup)
🟢 BUY XAUUSD 4580 | SL 4574
Narrative: Discount Accumulation
A deeper pullback into discount may be used to reload long positions before the next expansion phase.
Entry Conditions:
✔ Sell-side liquidity sweep into 4580
✔ Confluence with discount zone + OB + FVG
✔ Bullish MSS / CHoCH on M5–M15
✔ Strong upside BOS with displacement
✔ Entry via refined bullish order block
Targets:
4620 — first reaction
4680 — internal liquidity
4720+ — ATH continuation if expansion resumes
🧠 Expected Institutional Flow
Liquidity sweep → MSS / CHoCH → BOS → Displacement → OB/FVG retest → Expansion
No sweep → no trade
No structure → no entry
⚠️ Risk Management Notes
Highs are liquidity traps, not breakout zones
Expect false breaks during news volatility
No entry without confirmation (MSS + BOS)
Reduce size near premium extremes
📍 Summary
Gold is bullish by structure, but today’s movement is rotational:
4643 may deliver a Smart Money sell
4580 may reload longs for the next push higher
Let liquidity move first.
Let structure confirm second.
Smart Money controls the game. ⚡️

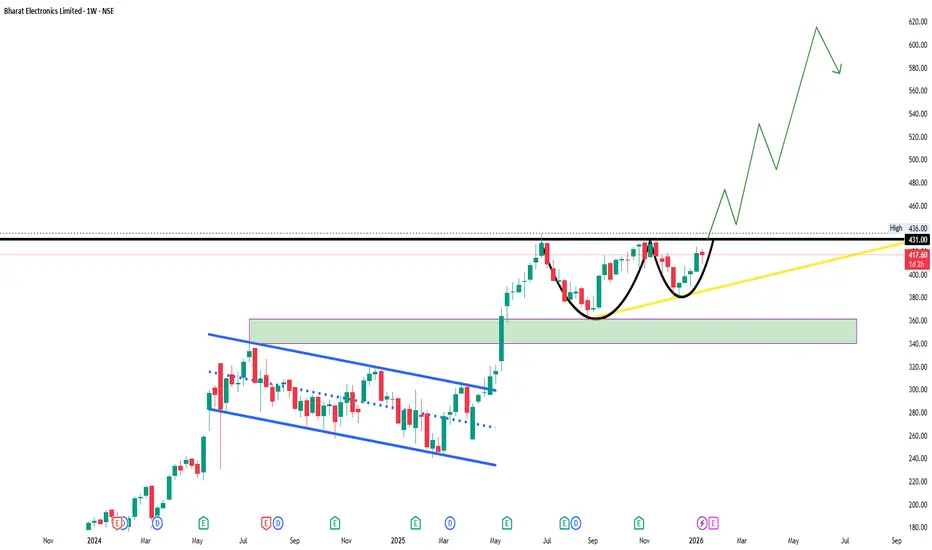
BELBEL
bullish trend is Showing on the chart.
buy signals in
technical indicators and
cup with handle chart pattern.
BUYING RANGE 400/410
Watch for a breakout above 430/440 to sustain the bullish trend. If the resistance holds, there could be a retest towards 340/360 and an uptrend from here.
BTCUSD Short Setup | Swing Sell | Risk DefinedBTCUSD short setup based on higher timeframe resistance.
• Direction: Sell
• Timeframe: Daily
• Stop Loss: 98,000
• Target: 84,000
• Risk is clearly defined on the chart
This idea is shared for educational purposes only.
No financial advice.

XAU/USD Technical analysisGold remains in a **broader bullish structure**, but near-term price action is corrective and volatile.
**Trend & Structure (1H / 5M):**
* Price is holding **above key demand at 4,580–4,590**, indicating buyers are still defending the trend.
* The broader structure remains **higher highs & higher lows**, but momentum has slowed near resistance.
* Short-term recovery from the recent dip suggests a **pullback within an uptrend**, not a trend reversal yet.
**Key Levels:**
* **Immediate Resistance:** 4,615 → 4,650 (supply zone / previous highs)
* **Support:** 4,590 → 4,580 (intraday demand)
* **Major Support:** 4,550 (trend invalidation if broken)
**Indicators:**
* **RSI:** Recovering from oversold levels, showing bullish divergence → supports bounce scenario.
* **Stochastic RSI:** Overbought on lower timeframe, hinting at possible short-term consolidation.
* **Moving Averages / VWAP:** Price is attempting to reclaim short-term averages, which is constructive if sustained.
**Bias:**
* **Bullish above 4,580** with consolidation
* **Break and hold above 4,650** opens continuation toward new highs
* **Failure below 4,580** may trigger a deeper correction toward 4,550
**Summary:**
Gold is in a **healthy consolidation phase after a strong rally**. As long as price holds above key demand, dips are likely to attract buyers, while upside confirmation requires a decisive breakout above resistance.

Candle Patterns Knowledge Candlestick patterns zoom in and show you immediate price behavior — the battle happening inside intraday or single-session price movement.
Candles reveal:
1. Momentum
2. Rejection
3. Strength of buyers/sellers
4. Trend continuation or reversal
5. Low-risk entries and exits
COMMON MISTAKES TO AVOID
Trading every pattern without context
Ignoring volume confirmation
Not waiting for candle close
Using patterns in low-liquidity markets
Overtrading inside small timeframes
Neglecting market trend
Placing stop losses too tight

Chart Patterns Knowledge Chart patterns are large-scale formations that take place over hours, days, weeks, or even months. They give you a bird’s-eye view of how price is evolving. Most chart patterns fall into three categories:
1. Reversal Patterns
2. Continuation Patterns
3. Bilateral Patterns
UNDERSTANDING MARKET STRUCTURE THROUGH CHART PATTERNS
Chart patterns give deep insights into:
Who controls the market (buyers vs. sellers)
Momentum strength
Liquidity zones
Breakout or breakdown levels
Supply and demand shifts
Institutional accumulation or distribution

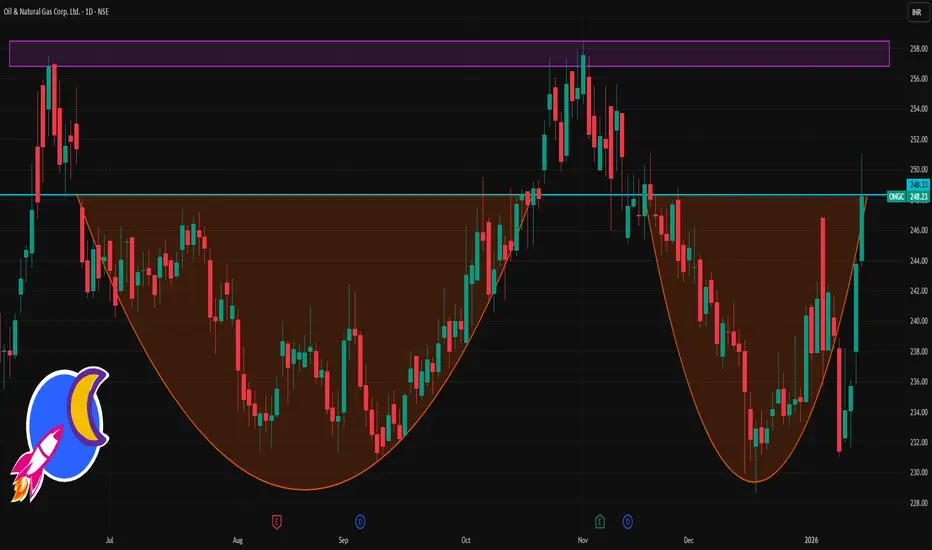
ONGC 1 Day Time Frame 📌 Live Price Snapshot (Latest Available)
Current Price (approx): ₹244 – ₹248 range on NSE today (near ₹248)
Day Low / Day High (intraday): ~₹244 / ₹251
Price may vary slightly based on live market data at the moment.
📊 Daily Pivot‑Based Levels (for Today’s Price Action)
Daily Pivot / Reference Point (based on previous session)
Pivot (PP): ~₹245.36
Daily Resistances (Upside Levels)
R1: ₹248.00
R2: ₹250.13
R3: ₹252.77
Daily Supports (Downside Levels)
S1: ₹243.23
S2: ₹240.59
S3: ₹238.46
Note: These pivot levels are classic calculations from the previous session’s high/low/close — standard for daily timeframe traders.
📌 How to Use These Levels (Daily TF)
Above Pivot (PP ≈ ₹245‑₹246): suggests intraday bullish bias, with first upside target near R1/R2.
Below Pivot: downside pressure may extend toward S1/S2.
Break of R2 (~₹250) / S2 (~₹240): often signals stronger directional continuation for the session.
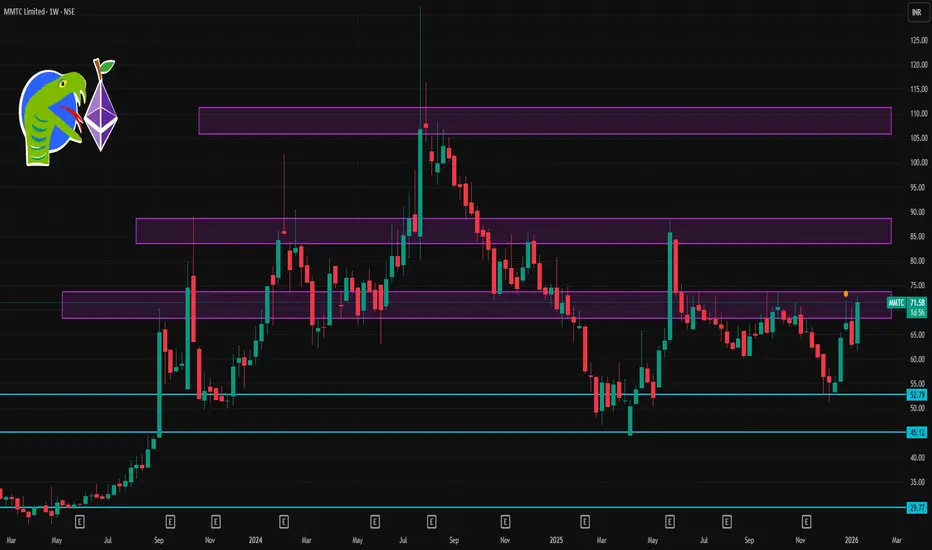
MMTC 1 Week Time Frame 📌 Current Price Snapshot
Latest traded price: ~₹71.5 – ₹72.7 on NSE today with strong intraday volatility. Daily high ~₹72.70 and low ~₹63.86.
This wide daily range suggests higher volatility this week — at least through the next few sessions.
📊 Short‑Term Weekly Levels
🔹 Resistance (Upside)
These are levels where price may face selling pressure or slow gains:
1. ₹72.5 – ₹73.0 — Immediate resistance area (today’s local high).
2. ₹75.0 – ₹76.0 — Next bullish pivot region if the stock holds above ₹72.5 (based on momentum models).
3. ₹78.0 – ₹80.0 — Stronger weekly upward pull target if bullish continuation holds.
👉 Closing above ₹75 on the weekly timeframe would indicate stronger short‑term bullish structure.
🔻 Support (Downside)
Levels where buyers may step in on pullbacks:
1. ₹66.0 – ₹67.0 — First dynamic support (near shorter moving averages).
2. ₹62.0 – ₹63.5 — Key lower support zone (recent daily lows).
3. ₹60.0 – ₹61.0 — Deeper weekly support — important to watch if breakdown accelerates.
👉 A break below ₹62 on weekly closes would weaken the bullish outlook and could open the door toward deeper supports.
📈 Technical Indicator Context
Technical breadth is largely bullish/momentum supportive:
📌 Moving Averages:
5, 10, 20, 50, 100, and 200‑day MAs all skew Buy — suggesting bullish trend alignment.
📌 RSI (14): ~65 — trending up but not yet extremely overbought.
📌 Stoch/RSI: Overbought on shorter timeframes — may hint at near‑term consolidation before higher breakout.
Summary: Momentum still skewed bullish overall, but short‑term traders should watch for near‑term pullbacks or consolidations due to overbought signals.
SOLARINDS 1 Day Time Frame 📊 Live Price Snapshot (approx)
Current NSE price: ~₹13,190 – ₹12,875 range (end of last session)
📈 Daily Pivot & Key Levels (1-Day Timeframe)
These come from recent pivot point calculations and live technical feeds:
Resistance Levels (Upside)
R1: ~₹13,577
R2: ~₹13,963
R3: ~₹14,214
(Potential upside barriers / targets)
Pivot Point
Pivot (Daily Reference): ~₹13,300 zone (approx midpoint)
Support Levels (Downside)
S1: ~₹12,940
S2: ~₹12,689
S3: ~₹12,303
(Zones where buying interest often emerges intraday)
🔍 Short-Term Bias & Indicators
Technical indicator signals today (1D):
RSI: Neutral/around mid-range → neither overbought nor oversold.
MACD: Bullish crossover on short timeframe.
Moving Averages (short & mid DMA/EMA): Mixed (some short EMAs bullish, some bearish), signaling consolidation bias around current price.
🕒 Summary for Today (1D)
Neutral to slightly bullish near current levels with balanced indicator setup
Key levels to watch:
Upside: 13,577 → 13,963 → 14,214
Downside: 12,940 → 12,689 → 12,303
Immediate pivot bias around ₹13,300 will determine intraday direction.

Best Sectors for Dip BuyingTurning Market Corrections into Long-Term Opportunities
Dip buying is a popular investment strategy where investors purchase fundamentally strong assets during temporary market declines. Instead of fearing corrections, experienced investors view dips as opportunities to enter quality sectors at attractive valuations. However, successful dip buying is not about buying everything that falls; it is about identifying the right sectors—those with strong long-term growth potential, resilient demand, and solid fundamentals—that are likely to recover and outperform over time.
Below is an in-depth explanation of the best sectors for dip buying, why they work well during corrections, and how investors can approach them strategically.
1. Information Technology (IT & Digital Services)
The technology sector remains one of the most attractive for dip buying because of its structural growth. Temporary sell-offs often occur due to global recession fears, interest rate hikes, or short-term earnings pressure, but the long-term demand for digital solutions remains intact.
Cloud computing, artificial intelligence, cybersecurity, data analytics, and automation are now essential for businesses worldwide. Even when companies reduce discretionary spending, they continue to invest in technology to improve efficiency and reduce costs. Large, well-established IT companies usually have strong balance sheets, recurring revenue models, and global clients, which makes them resilient.
Why dip buying works here:
Long-term secular growth
High margins and scalable business models
Strong cash flows in large-cap tech
2. Banking and Financial Services
Financial stocks often correct sharply during economic slowdowns, interest rate uncertainty, or liquidity concerns. These corrections can create excellent dip-buying opportunities, especially in well-capitalized banks and financial institutions.
As economies stabilize, credit growth resumes, non-performing assets decline, and profitability improves. In countries like India, long-term drivers such as financial inclusion, digital banking, credit penetration, and rising incomes support sustained growth in the financial sector.
Why dip buying works here:
Core sector linked to economic growth
Valuations become attractive during stress
Strong recovery cycles after downturns
3. Pharmaceuticals and Healthcare
Healthcare is a defensive sector, making it ideal for dip buying during volatile markets. Demand for medicines, diagnostics, hospitals, and healthcare services remains stable regardless of economic conditions.
Pharmaceutical stocks may correct due to regulatory issues, pricing pressure, or temporary margin contraction. However, companies with strong product pipelines, global presence, and research capabilities tend to recover well. Aging populations, rising healthcare awareness, and increased insurance coverage provide long-term growth visibility.
Why dip buying works here:
Non-cyclical demand
Stable cash flows
Strong export and global exposure
4. Fast-Moving Consumer Goods (FMCG / Consumer Staples)
FMCG companies sell everyday essentials such as food, beverages, personal care, and household products. These businesses are highly resilient because consumers continue to buy essentials even during economic slowdowns.
Market corrections often lead to valuation compression in FMCG stocks, especially when input costs rise or demand growth slows temporarily. For long-term investors, these dips offer an opportunity to buy quality brands with strong distribution networks and pricing power.
Why dip buying works here:
Stable earnings and dividends
Strong brand loyalty
Low business risk over the long term
5. Infrastructure and Capital Goods
Infrastructure and capital goods stocks are highly cyclical and tend to correct sharply during periods of uncertainty. However, this volatility makes them attractive for dip buying when supported by strong policy and investment cycles.
Government spending on roads, railways, power, defense, and urban infrastructure acts as a major growth driver. When order inflows are strong and balance sheets improve, these companies can deliver significant returns during recovery phases.
Why dip buying works here:
High operating leverage during upcycles
Strong order books post-correction
Beneficiaries of government-led growth
6. Energy and Power
Energy stocks, including oil & gas, power generation, and renewable energy, often experience volatility due to fluctuations in commodity prices, geopolitical events, and regulatory changes. These corrections can provide attractive entry points.
Traditional energy companies benefit from steady demand, while renewable energy players gain from the global transition toward clean energy. Long-term energy consumption continues to rise, especially in emerging markets.
Why dip buying works here:
Essential sector for economic activity
Strong cash generation in large players
Long-term transition opportunities in renewables
7. Automobiles and Auto Ancillaries
The auto sector is cyclical and sensitive to interest rates, fuel prices, and consumer sentiment. As a result, it frequently undergoes corrections. However, long-term demand drivers such as urbanization, rising incomes, and mobility needs remain strong.
Additionally, electric vehicles (EVs), hybrid technology, and advanced auto components are creating new growth avenues. Strong companies with efficient cost structures and innovation capabilities tend to bounce back sharply after downturns.
Why dip buying works here:
Cyclical recoveries offer strong upside
Structural shift toward EVs and technology
Export opportunities in auto components
8. Metals and Commodities
Metal and commodity stocks are highly volatile, reacting quickly to global growth expectations, currency movements, and supply-demand dynamics. Sharp corrections are common, but they also present opportunities for disciplined investors.
When global demand recovers or supply constraints emerge, commodity prices can rise rapidly, leading to strong profit growth for producers. Focus should be on low-cost producers with strong balance sheets.
Why dip buying works here:
Strong mean reversion cycles
High profits during commodity upswings
Global demand-driven recovery potential
9. Telecom and Digital Infrastructure
Telecom companies provide essential connectivity services, making them relatively defensive. Heavy investments and regulatory challenges can lead to temporary stock corrections, but long-term data consumption continues to grow exponentially.
With the rise of 5G, digital payments, OTT platforms, and internet penetration, telecom and digital infrastructure companies are well-positioned for sustained growth.
Why dip buying works here:
Recurring revenue models
Essential service status
Long-term digital consumption growth
10. Consumption and Retail (Discretionary)
Consumer discretionary stocks, such as retail, travel, entertainment, and lifestyle brands, are hit hardest during economic slowdowns. This makes them risky but highly rewarding for dip buying when the cycle turns.
As confidence improves and spending rebounds, these stocks often deliver sharp recoveries. Selecting companies with strong brands, efficient operations, and online presence is crucial.
Why dip buying works here:
High rebound potential post-recovery
Rising middle-class consumption
Strong earnings growth in expansions
Conclusion: Strategy Matters More Than Timing
Dip buying works best when combined with sector selection, patience, and risk management. The goal is not to catch the exact bottom but to accumulate quality sectors during periods of pessimism. Focus on industries with strong long-term fundamentals, capable management, and sustainable demand.
Diversifying across multiple strong sectors, investing in phases, and aligning investments with long-term goals can turn market corrections into wealth-building opportunities. In the long run, disciplined dip buying in the right sectors can significantly enhance portfolio returns while reducing emotional decision-making.

Market Focus: The Foundation of Smart Trading and InvestingUnderstanding What “Market Focus” Really Means
Market focus is the ability to observe, analyze, and respond to market behavior with clarity and purpose. It is not about watching every price tick or reacting to every news headline. Instead, it involves identifying key drivers such as trends, volume, macroeconomic signals, sector strength, and risk sentiment. A focused market participant knows where to look, what to ignore, and when to act.
Many participants confuse activity with focus. Constant trading, excessive chart watching, or chasing hot tips often reduces focus rather than enhancing it. True market focus simplifies complexity. It narrows attention to high-probability setups, reliable data, and repeatable processes.
The Role of Market Structure
A focused approach begins with understanding market structure. Markets move in trends, ranges, and transitions. Recognizing whether the market is bullish, bearish, or sideways provides a framework for decision-making. Trading against the dominant structure often leads to unnecessary losses, while trading with structure improves probability.
Market structure also includes support and resistance zones, supply and demand areas, and liquidity levels. These are not random points but areas where institutional participation is often concentrated. Focusing on structure helps traders avoid emotional entries and instead act where risk and reward are clearly defined.
Filtering Noise and Distractions
One of the biggest challenges in maintaining market focus is information overload. Social media, financial news channels, and constant alerts can distort perception. Not every piece of news is actionable. Not every market move requires participation.
A focused market participant develops the ability to separate signal from noise. This includes ignoring rumors, avoiding impulsive trades based on headlines, and sticking to predefined criteria. By reducing unnecessary inputs, clarity improves, and decision-making becomes calmer and more rational.
Importance of Time Frame Alignment
Market focus also depends on aligning with the correct time frame. Short-term traders, swing traders, and long-term investors all view the same market differently. Confusion arises when time frames are mixed—such as taking long-term positions based on short-term emotions or exiting long-term investments due to short-term volatility.
A disciplined focus requires committing to a specific time horizon and analyzing the market accordingly. Weekly and monthly trends guide investors, while intraday and daily structures guide traders. Time frame alignment reduces stress and improves consistency.
Risk Management as a Focus Tool
Risk management is often discussed as protection, but it is also a powerful focus mechanism. When risk is predefined, emotions are controlled. Knowing how much capital is at risk allows the mind to stay objective rather than fearful or greedy.
Focused market participants think in terms of probabilities, not predictions. Losses are accepted as part of the process, not personal failures. This mindset keeps attention on execution quality rather than outcomes of individual trades.
Psychological Discipline and Market Focus
The market constantly tests patience, confidence, and emotional control. Fear, greed, revenge trading, and overtrading are all symptoms of lost focus. Psychological discipline restores market focus by reinforcing rules, routines, and self-awareness.
Successful participants often follow structured routines—pre-market analysis, defined entry and exit rules, and post-market reviews. These habits anchor attention and prevent impulsive decisions. Focused traders and investors understand that consistency comes from behavior, not brilliance.
Adapting to Changing Market Conditions
Market focus does not mean rigidity. Markets evolve due to economic cycles, interest rate changes, geopolitical events, and technological shifts. A focused participant remains adaptable without becoming reactive.
This adaptability comes from continuous learning and observation. When volatility rises, position sizing adjusts. When trends weaken, expectations change. Focus allows participants to respond intelligently rather than emotionally to changing conditions.
Long-Term Vision and Market Focus
For investors, market focus is deeply connected to long-term vision. Short-term market fluctuations are inevitable, but long-term value creation follows fundamentals, earnings growth, and economic expansion. A focused investor resists panic during corrections and avoids euphoria during rallies.
Long-term market focus emphasizes asset allocation, diversification, and compounding rather than frequent trading. This perspective reduces stress and improves wealth-building outcomes over time.
Technology and Tools Supporting Focus
Modern tools—charts, indicators, scanners, and data platforms—can enhance focus when used correctly. However, overuse leads to confusion. Focused market participants select a limited set of tools that complement their strategy and ignore the rest.
Technology should support decision-making, not replace thinking. Simplicity often outperforms complexity in maintaining clarity and discipline.
Conclusion: Focus as a Competitive Advantage
In competitive financial markets, information is widely available, but focus is rare. The ability to concentrate on what truly matters—market structure, risk, time frame, and psychology—creates a lasting edge. Market focus is not built overnight; it develops through experience, discipline, and self-control.
Whether trading short-term or investing long-term, focusing on the market with clarity and purpose transforms uncertainty into opportunity. In the end, success in markets is less about predicting the future and more about maintaining focus in the present.
Trends in the Equity Market: The Direction of Wealth CreationLong-Term Structural Trends in Equity Markets
Historically, equity markets have shown a strong upward bias over the long term. This long-term bullish trend is driven by economic expansion, population growth, productivity improvements, and innovation. Companies grow their revenues and profits over time, and this growth is ultimately reflected in rising share prices. Despite periodic crashes and recessions, equity markets across the world—such as the S&P 500, Nifty 50, FTSE, and Nikkei—have delivered positive returns over decades. This long-term trend reinforces the idea that equities are one of the most effective instruments for wealth creation when held with patience and discipline.
Cyclical Trends: Bull and Bear Markets
Within the long-term upward trajectory, equity markets move in cycles. Bull markets are periods characterized by rising prices, strong investor confidence, expanding valuations, and positive economic indicators. During bull phases, sectors like banking, technology, infrastructure, and consumer discretionary often outperform as risk appetite increases. On the other hand, bear markets are marked by falling prices, pessimism, declining earnings, and tighter financial conditions. These periods are often triggered by recessions, financial crises, high inflation, or geopolitical shocks. Understanding where the market stands in the cycle helps investors adjust their strategies—aggressive during early bull phases and defensive during late-cycle or bear phases.
Sectoral and Thematic Trends
Equity market trends are not uniform across all sectors. Sectoral rotation is a key feature of modern equity markets, where capital flows from one sector to another based on economic conditions. For example, during economic recoveries, cyclical sectors like metals, energy, and capital goods tend to perform well. In contrast, during slowdowns, defensive sectors such as pharmaceuticals, FMCG, and utilities attract investor interest.
In recent years, thematic investing has gained prominence. Themes such as digital transformation, renewable energy, electric vehicles, artificial intelligence, healthcare innovation, and fintech have created long-lasting trends within the equity market. Investors increasingly focus on future-oriented themes rather than traditional sector classifications, aligning portfolios with long-term structural changes in the global economy.
Influence of Macroeconomic Factors
Macroeconomic variables play a critical role in shaping equity market trends. Interest rates, inflation, GDP growth, employment data, and central bank policies directly impact valuations and investor behavior. Low interest rates generally support equity markets by reducing borrowing costs and making stocks more attractive compared to fixed-income instruments. Conversely, rising interest rates can pressure equity valuations, especially in growth-oriented stocks. Inflation trends also matter—moderate inflation supports corporate earnings, while high and persistent inflation erodes margins and investor confidence.
Global equity markets are increasingly interconnected, meaning trends in one major economy can influence markets worldwide. Developments in the US Federal Reserve policy, crude oil prices, currency movements, and global trade dynamics often shape trends in emerging markets like India.
Role of Technology and Market Participation
Technology has significantly transformed equity market trends. Algorithmic trading, high-frequency trading, online brokerage platforms, and real-time information flow have increased market efficiency and liquidity. At the same time, they have also amplified short-term volatility. The rise of retail investors, driven by easy access to trading apps and financial content, has added a new dimension to market trends. Retail participation can accelerate momentum-driven moves, especially in mid-cap and small-cap stocks.
Social media, news platforms, and data analytics tools now influence sentiment-driven trends, sometimes causing sharp rallies or corrections disconnected from fundamentals in the short term.
Emerging Market Trends and India’s Equity Landscape
Emerging markets have become a key focus for global investors due to their higher growth potential. In India, equity market trends are shaped by domestic consumption, demographic advantages, government reforms, infrastructure development, and digitalization. Initiatives related to manufacturing, renewable energy, financial inclusion, and startup ecosystems have created strong long-term equity trends. Indian markets have also seen increased participation from domestic institutional investors and retail investors, making them more resilient to global shocks compared to the past.
Short-Term vs Long-Term Trends
Equity market trends exist across multiple timeframes. Short-term trends are often driven by news events, earnings announcements, global cues, and technical factors. These trends can reverse quickly and are mainly relevant for traders. Long-term trends, on the other hand, are based on fundamentals, economic growth, and structural changes. Successful investors learn to differentiate between temporary noise and meaningful long-term trends, aligning their strategies accordingly.
Risk, Volatility, and Trend Management
Volatility is an inherent part of equity market trends. Sudden corrections, profit booking, and panic selling are natural even in strong bull markets. Managing risk through diversification, asset allocation, and disciplined investing is essential to survive market fluctuations. Trend-following strategies, value investing, and systematic investment approaches such as SIPs help investors benefit from trends while minimizing emotional decision-making.
Conclusion
Trends in the equity market are a reflection of economic realities, investor psychology, and global developments. While short-term movements can be unpredictable, long-term trends favor disciplined investors who focus on fundamentals, diversification, and patience. By understanding cyclical patterns, sectoral shifts, macroeconomic influences, and technological changes, investors can make informed decisions and align their portfolios with evolving market trends. Ultimately, the equity market rewards those who respect trends, manage risk wisely, and stay invested in the journey of economic growth and wealth creation.

AXS/USDT | Crypto | Long-Term Falling Channel | Opportunity 1️⃣ Long-Term Falling Channel (Key Context)
Price has been respecting a multi-year descending channel.
Current price is near the lower boundary of this channel → high reward zone.
Historically, every visit near this lower trendline has resulted in strong mean reversion rallies.
👉 This alone creates a favorable risk–reward setup.
🟢 Support & Accumulation Zone
Major support range: 1.00 – 1.15 USDT
This zone aligns with:
Lower channel trendline
High historical volume activity
Long consolidation base
🧠 Smart money logic:
Strong assets often form long bases near channel bottoms before explosive reversals.
📈 Momentum Indicators Confirmation
🔹 RSI (14)
RSI has reversed from oversold region (≈30).
Currently moving toward 60, showing:
Strength shift from sellers → buyers
Multiple bullish RSI divergence signals already printed
✅ Momentum is building, not exhausted.
🧱 Breakout Level (Trigger Zone)
Critical breakout: 2.70 – 2.75 USDT
This is:
Horizontal resistance
Previous support turned resistance
Mid-channel reclaim zone
⚡ Once price closes above this zone on daily timeframe, trend shift confirms.
🧠 Final Verdict
✔ Long-term downtrend losing momentum
✔ Price at high-probability accumulation zone
✔ RSI & MACD support trend reversal
✔ Clear breakout & invalidation levels
✔ 100%+ upside realistic in medium term if market sentiment remains supportive
📝 Note (Educational Purpose Only)
This chart analysis is shared purely for study and educational purposes.
It is not a buy or sell recommendation, nor financial advice of any kind.
The levels, patterns, and indicators discussed are based on technical analysis observations and represent possible scenarios, not guarantees.
Market conditions can change at any time, and prices may move against expectations.
Always do your own research (DYOR) and consult a qualified financial advisor before making any investment or trading decisions.
You are solely responsible for your trades and risk management.

Copper : Bullish we are in the either 4th wave or 5th wave has already started which will lead the prices for higher side
key level 5.4000

How to Save yourself from a FAKEOUT - Learn this MethodI made educational content videos for trading
In this video I am telling about how to Identify a fakeout with this simple trick .

Maruti Suzuki - A Solid OpportunityMaruti Suzuki has entered into short term bearish mode.
It is down nearly 7% from the top in last 2 weeks, confirming a strong downside momentum.
Structure: Playing Wave C, of 4 in short term.
Trend: Bearish
Also a clear divergence in RSI indicator at the top
Trade Setup: Short
Target: 15270/-
StopLoss: 16500/-
Notes
This is a classic Elliot wave pattern. Wave C generally moves fast.
⚠️ Disclaimer: Not financial advice. Manage risk properly.

Paytm - Is a Bearish Barrier Triangle Signaling a Deeper CorrectLooking at the 4H chart for One 97 Communications Ltd. (Paytm), Am seeing a classic consolidation pattern following a strong impulsive move. After completing what appears to be a 5-wave sequence (blue labels), the price action is now squeezing into a Barrier Triangle structure—a specific Elliott Wave pattern that often precedes a sharp "thrust" in the direction of the larger trend.
Wave B did an exactly 0.786 retracement.
Below 1260, its gonna be a straight fall to 1100 odd.
RSI already indicating a clear breakdown.

Gold oscillates between 4690 supply and 4576 demand.🟡 XAUUSD – Intraday Smart Money Plan | by Ryan_TitanTrader (14/01)
📈 Market Context
Gold remains structurally bullish after printing fresh ATH territory, but price action has clearly slowed into rotation. With markets reacting to today’s hot drivers — U.S. inflation expectations, USD volatility, and shifting Treasury yields — Smart Money is no longer chasing upside. Instead, liquidity is being engineered around premium and discount zones.
Ahead of key U.S. data and rate-cut speculation, Gold is behaving exactly as expected at extremes: stop hunts, inducement, and controlled rebalancing rather than clean continuation.
🔎 Technical Framework – Smart Money Structure (H1–M15)
Current Phase:
HTF bullish bias intact, while intraday structure shows corrective rotation after buy-side liquidity was delivered near ATH.
Key Idea:
Expect distribution from premium supply near ATH, or a deeper pullback into discount demand to reload longs.
Structural Notes:
• HTF BOS confirms bullish dominance
• ATH zone has delivered buy-side liquidity
• Price rotating, not expanding impulsively
• Internal FVG acting as downside magnet
• Discount demand aligns with HTF EMA support
💧 Liquidity Zones & Triggers
• 🔴 SELL GOLD 4688 – 4690 | SL 4700
• 🟢 BUY GOLD 4578 – 4576 | SL 4568
🧠 Institutional Flow Expectation
Liquidity sweep → MSS / CHoCH → BOS → displacement → OB/FVG retest → expansion
🎯 Execution Rules
🔴 SELL GOLD 4688 – 4690 | SL 4700
Rules:
✔ Price taps premium ATH supply
✔ Buy-side liquidity taken above highs
✔ Bearish MSS / CHoCH on M5–M15
✔ Clear downside BOS
✔ Entry via bearish FVG or supply OB
Targets:
• 4635 — internal reaction
• 4600 — liquidity pool
• Trail aggressively (distribution play)
🟢 BUY GOLD 4578 – 4576 | SL 4568
Rules:
✔ Sweep into discount demand
✔ Confluence with OB + FVG
✔ Bullish MSS / CHoCH on M5–M15
✔ Strong upside BOS with displacement
✔ Entry via refined bullish OB
Targets:
• 4620 — first reaction
• 4680 — internal liquidity
• 4720+ — ATH extension if expansion resumes
⚠️ Risk Notes
• ATH zones are liquidity traps
• Expect false breaks during news volatility
• No entry without MSS + BOS
• Reduce size near ATH — range expansion risk
📍 Summary
Gold is bullish by structure, but today is about execution, not prediction:
• Premium may deliver a Smart Money sell from 4688–4690, or
• Discount at 4578–4576 may reload longs for the next ATH push.
Let liquidity move first.
Let structure confirm second.
Smart Money controls — patience pays. ⚡️
📌 Follow @Ryan_TitanTrader for daily Smart Money gold breakdowns.

Part 10 Trade Like Institutions Single-Leg Strategies
A. Long Call
Buy call when expecting uptrend.
B. Long Put
Buy put when expecting downtrend.
C. Covered Call
Sell call against stocks you own.
D. Cash-Secured Put
Sell put when you want to buy stock at a lower price.

Part 6 Learn Institutional Trading How Volatility Impacts Options
Volatility (IV) is one of the biggest influencers.
High Volatility
Premiums become expensive
Good for sellers
Risky for buyers
Low Volatility
Cheap premiums
Good for buyers
Limited premium for sellers
Traders forecast volatility using:
India VIX
Historical price behavior
Events (Budget, Elections, Results)
