Nifty & BankNifty: Elliott Wave Roadmap - Aug / Sep 2025We saw an ending diagonal (wedge) in BankNifty at 47702 lows back in March 2025. The idea was published, can 47702 be the bottom? Indeed, BankNifty unfolded in impulsive fashion, flying up to 57669 highs. Wow.
Now the question: do we see a similar structure in Nifty? An ending diagonal forming in the corrections, building a base near 24325–24350? Or will it struggle?
All that in this video. Market Whispers! Can you hear them?
WaveTalks Profile
in.tradingview.com
Exciting video idea from WaveTalks.
Analysis by Abhishek
Wavetalks

BankNifty ElliottWave Update: Messy Moves Before the Final Push?Disclaimer
This content is for educational purposes only. It does not constitute any recommendation to buy or sell any financial instrument. Always consult your financial advisor before making any trading or investment decisions. The intent is to help you understand market structure better so you can execute with more clarity.
BankNifty
Last @ 57015 / 1:47 pm / 10th July 2025
Pattern in Focus: Ending Diagonal (Old School: Wedge)
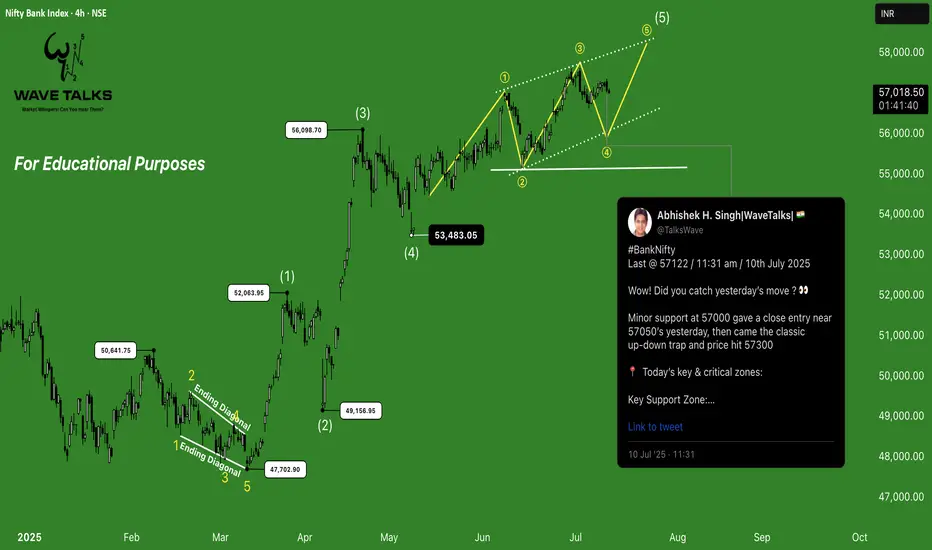
Since the bottoms of 47700, BankNifty has unfolded in a clear impulsive structure as per our previous discussions. We proposed that the 5th wave of this larger impulse is unfolding as an Ending Diagonal -a pattern known for its frustrating up-down moves that test trader patience.
Current Structure: Proposed Wave 5 (Ending Diagonal)
- Wave 1 to 3 within the diagonal saw strong momentum
- Wave 3 topped at 57600s approx, perfectly into the 57500–57750 zone - our previously highlighted resistance zone.
- Wave 4 now seems to be unfolding as a complex correction (current move)
Key Support Zones
- Immediate Critical Support: 57000–57025
Held beautifully as tweeted earlier today-giving a springboard move towards the upside some times back close to 57200’s.
- Bigger Timeframe Support: 56250–56500
If the index slips further below 57000–57025 critical support zone, next bigger support zone comes in 56250–56500 zone. This could offer a final leg launchpad for Wave 5 upside within larger degree Wave 5
Resistance Zones to Watch
- First Re-attempt Zone: 57400–57450
Often acts as natural resistance. Instruments tend to behave like total 420s around such zones,
Maybe because they start behaving like total 420s themselves- hahaha
- Breakout Zone: Above 57500
if cleared, BankNifty can again travel back to 57600+, retesting the Wave 3 highs (proposed one) from where the recent fall started on 2nd July 2025
Our Assumption: Controlled Chaos
This is typical diagonal behaviour - messy, erratic, full of traps. But when structure is spotted early, even a lion obeys the ringmaster.
We’re watching every move amidst all the chaos.
Sign Off from WaveTalks
Market Whispers! Can you hear them?
Catch our next update where we decode every tick with Elliott clarity
Have a great weekend
Nifty - From 25000 to 25400+ – How Elliott Waves Mapped the Move#Nifty – Wedge Complete. Now What? 🤔📐
We’ve been tracking this pattern step by step - and it just unfolded fully.
But the real question is:
Was it a Type 1 or Type 2 Diagonal?
I still remember when I faced this exact question in my CMT Final Exam back in 2015 —
And trust me, it drove me crazy!
Never heard such terms in the standard books, and yet it popped up like a surprise twist.
That moment made me dig deeper, beyond textbooks… into real Elliott Wave experience.
Here’s a quick decode:
➡️ Type 1 = Leading Diagonal → starts the journey
➡️ Type 2 = Ending Diagonal → wraps it up with drama
In the current Nifty chart, the 400-point rally from 25000 to 25400+ played out just as we expected.
But now that the pattern is complete... should you be cautious at the top?
If the index starts holding below 25400 — you know the game could flip.
24th June 2025
Expecting Nifty to Push towards 25400+
I tweeted earlier:
Bulls kar diya khela – Bihari style mein!
Kya 420 hai Nifty?
Toh kya phir se 25000 aayega? 🤨
Time will tell.
Disclaimer :
This is not a buy/sell call. Please consult your financial advisor.
But if you’re asking these kinds of questions… you’re not just a trader.
You're becoming a thinker, maybe even a future Elliottician.
For me, T.A. means:
Teaching & Application — not just Technical Analysis.
Catch more in the next WaveTalks update.
🎙️ Market Whispers… Can You Hear Them?

Nifty’s / BankNifty's Final Leg Wave 5 Unfolding - Elliott WaveWaveTalks Insight: A potential Leading Diagonal on Nifty may be nearing completion – Market Whispers! Can you hear them?
________________________________________________________________________________
Intro – A Journey Through the Waves
_____________________________________
Since April 2025, we’ve been riding the waves — literally. Each twist, each rally, each dip was decoded in real time through WaveTalks videos.
Now, we are possibly entering the Final Leg of Wave 5 of a Leading Diagonal Structure – one of the most admired Elliott Wave patterns since the early 2020s.
If this unfolds as expected, it will complete the full 5-wave formation I first visualized on 13th May 2025 (to be documented in my upcoming project / book – copyright pending!).
________________________________________________________________________________
NIFTY INDEX OUTLOOK
__________________________
Current Structure:
______________________
Proposed Leading Diagonal with Wave 4 completed or about to complete sooner or later.
Later Final Leg – Wave 5 will start unfolding upside.
Key Levels to Watch:
________________________
Above 25116: Structure continues
Next Resistance Zone: 25250–25300
Major Hurdle: 25450–25500 (strong resistance)
If It Unfolds as Expected:
___________________________
Completion of 5 waves will lead to a sharp retracement phase
Retracements in Leading Diagonals are quick and deep.
Support Zones to Watch (Post Completion):
__________________________________________
Retracement possible towards 21900–22500
But index must not break below 21743 (7th April 2025 low)
If it holds, structure remains valid
BANK NIFTY OUTLOOK
__________________________
Remember our call at 47700 ? We questioned: “Is that a wedge?” as per the last idea published on 11th March 2025 mentioned below;
That zone acted as a perfect base with an Ending Diagonal or Wedge for next set 5-wave rise which unfolded beatifully from Late March to End of May ...so far...
Now Bank Nifty could be progressing beautifully in Wave 5 of its structure, currently unfolding Wave-4 of its larger structure.
Watch Out For:
__________________
Breakout beyond 56100 possible
If the current setup holds, new highs are not ruled out.
Summary (Nifty Index ) – What to Expect & What It Can’t Do
___________________________________________________________
Expected:
_______________
Nifty to finish Wave 5 close in 25250 - 25300 zone (proposed) crossing above 25116 highs, & may even extend upside close to 25500 , if it crosses above 25300 & sustains.
Then a fast, deep retracement phase begins
What It Can’t Do:
____________________
Nifty cannot fall below 21743 (April 7 low) if Leading Diagonal is the structure unfolding as proposed.
Breaking this would invalidate the structure.
Catch me in the next WaveTalks video as we break down the charts in detail and explore what this final leg means for your trading plans.
Wishing you a great weekend ahead!
#WaveTalks #Nifty #BankNifty #ElliottWave #TradingViewIndia #MarketOutlook
________________________________________________________________________________
⚠️ Disclaimer :
_________________
This idea is shared for educational purposes only.
WaveTalks is not liable for any loss.
Trading in futures and options involves high risk and may lead to loss of capital.
Please understand the risks involved and learn before you earn.

BankNifty-Is this a wedge ? at 47700's (Intermarket Divergence)Disclaimer:
This is not financial advice. Consult your financial advisor before making any decisions.
Falling Wedge Pattern & Its Impact on Markets
A falling wedge is a bullish reversal pattern that signals a potential trend reversal or continuation depending on the context.
What is a Falling Wedge?
Shape: A downward-sloping, converging price pattern where both highs and lows form lower highs & lower lows.
Volume: Declining during the formation, followed by a breakout with increased volume.
Breakout Direction:
Typically upside.
Impact of a Falling Wedge
In a downtrend (reversal pattern) → bullish reversal signal
- Occurs after a downtrend.
- Signals a potential breakout to the upside.
- Traders look for price closing above resistance with higher volume.
Nifty Holds, BankNifty Slips – Intermarket Divergence in Play
Possible Wave 4 and Wave 5 expected to complete in the next few days. Nifty holding its recent low of 21965 while BankNifty makes a new low could be a classic case of intermarket divergence. Will this divergence lead to a reversal or further breakdown?
What is Intermarket Divergence?
Intermarket divergence occurs when two highly correlated markets or indices (Nifty & BankNifty in current scenario) move in opposite directions, indicating potential market shifts, trend reversals, or underlying weakness/strength.
BankNifty on 3rd March 2025
Nifty on 4th March 2025
Snapshot and analysis are original content from WaveTalks, protected under copyright laws. Any unauthorized use, distribution, or copying without written permission is strictly prohibited..
BankNifty is forming a falling wedge near 47700 lows, signaling a potential breakout ahead. Is a sharp reversal on the cards? Stay tuned for the next move.
WaveTalks – Market Whispers! Can you hear them?
Regards,
Abhishek
WaveTalks

ONGC -Wave 5 Bottomed! OMG! - From Oil Rigs to Green Gigs!ONGC is making history, transitioning from oil dominance to renewable energy leadership.
On Feb 28, Last ONGC Idea on TradingView
I shared my TradingView idea, predicting Wave 5 completion at the bottom and expecting a bounce off the trendline. And here we are on March 6—ONGC surges from 215 lows to 232+ highs as of today’s close with a strong green candle.
ONGC’s Big Bet: A ₹9.25B Leap into Green Energy!
But that’s not all—ONGC just made a massive fundamental move, acquiring PTC Energy for ₹9.25B ($106M), adding 288 MW of operational wind power across three Indian states.
Why This is a Game-Changer
✅ India’s 500 GW non-fossil fuel target by 2030
✅ ONGC Green targeting 10 GW renewable energy portfolio
✅ Recent $2.3B Ayana Renewable Power acquisition with NTPC Green
Technical Perspective – The Power of Wave 5
Is Wave 5 bottom confirmed in some degree of the impulsive move which started falling from 345 highs as discussed and warned earlier in the Bigger Idea
Momentum building – are new highs incoming
From oil rigs to green gigs, ONGC is shifting gears fast. Is this just the beginning of an explosive rally?
Let us decode the waves.
Catch me with another exciting idea from WaveTalks, Market Whispers! Can you hear them?
Regards,
Abhishek
WaveTalks

ONGC - Did You Get Trapped in an Irregular Flat? – Elliott Wave I Told You So… The Market Whispers! Can You Hear Them?
Back in April 2024, I warned you to be careful as the stock approached key resistance at 314, forming a Bearish Bat pattern with a Potential Reversal Zone (PRZ) between 300-275. The stock topped at 287, right at the edge of invalidation.
Yet, if you got convinced of the rally above 300, then unfortunately, no one can help—but I did my job of warning you months in advance.
This reminds me of BHEL, the stock we discussed a few days back.
Let us talk about ONGC.
The Irregular Flat structure caught many off guard. Did you get trapped? Because if the current wave unfolds impulsively, which it just started from the highs of 345, then welcome to reality!
Warning Through Last Idea in April 2024
As shown in the chart snapshot, how Irregular Flats look has been illustrated next to the price chart. I have depicted the irregular path of flats that could unfold.
This is how markets deceive, creating irregular structures that mislead traders. Elliott Wave calls this pattern an Irregular Flat—a trap that looks bullish before a sharp reversal wipes out weak hands.
The Lesson?
Patterns speak… if you listen carefully.
I shared my insights long before the structure unfolded—and yet, if you got trapped, you now know why.
Catch me later with another exciting idea of WaveTalks, Market Whispers! Can you hear them?
Disclaimer:
Trading in financial markets involves substantial risks. Consult your financial advisor before making decisions. This commentary is not a solicitation to buy or sell.

BankNifty: Magic of Historical Levels- Can we hold 49183?(Disclaimer: This analysis is for informational purposes only. Consult your financial advisor before making any trading decisions.)
As anticipated earlier in the day at 12:03 pm
BankNifty faced selling pressure right at the resistance zone of 49,600-49,665, leading to a sharp fall.
Sharp Fall After 45 mins of Patience at 12:45 pm
Was the sharp fall outcome of any pattern you recognise in ElliottWave - If so what is it?
Did you notice it halted in 49600-49665 zones & to be precise it was 49600---Wow!!!
Historical levels once again proved their significance, as we initially expected support near 49,350-49,375, but when momentum takes over, markets can surprise.
The big question ?
Will BankNifty hold at 49,183 & 48,900 (precisely 48,906), or are we set for a deeper plunge? The impulsive Y-Wave began at 47,845 in the WXYXZ proposed correction and if corrections tend to fully retrace, a test of those levels remains a possibility.
And what about Nifty? Could we see a slide towards 23,800? 🤔 Only time will tell.
Key Takeaways:
✅ Resistance worked like magic at 49,600-49,665.
✅ Support zones were tested but didn’t hold up in the sharp fall.
✅ Will 49,183 & 48,900 act as a base, or do we head lower to 47,845?
✅ Corrections often retrace fully—watch for further price action.
Historical levels remain key—markets have their own mind!
Catch Me With Another Exciting Episode from WaveTalks- Market Whispers! Can You Hear Them?

BankNifty -Target Done, ED Done, Fall Done,Bounce, What’s Next? WaveTalks Market Update - Budget Day Breakdown (Feb 1, 2025)
The much-anticipated Budget 2025 has failed to cheer the markets, triggering a sharp sell-off that aligns perfectly with a classic Ending Diagonal (ED) breakdown.
Technical Setup - ED Play in Action!
For those following the Elliott Wave roadmap, the Ending Diagonal (ED), also known as a Rising Wedge, unfolded in the last Wave 5 of a larger degree impulse that began from the lows of 47844 on January 27, 2025, culminating at the psychological resistance of 50000 today on the Budget day 1st Feb 2025.
This pattern typically marks trend exhaustion, leading to swift and often dramatic reversals. The market exceeded our prior target of 49650+ before peaking at 50000, and today, we are seeing exactly the expected reaction.
Last Bank Nifty Idea - Target 49650+
If you spotted this pattern and managed risk effectively, you are likely riding this sharp decline from the highs of 50000 & Booking Profits close to 48968 key level highlighted in the last idea
Magical Support - Intraday 49000
After a sharp 1000-point fall, the market found support at a key level of 48968, highlighted in the last idea. A strong 500-point bounce once again, pushing towards same target of 49650+.
Breakdown Details:
- Key support level : 48968
- Actual low: 48925 post completion of the Ending Diagonal
- Initial fall: 1000 points
- Current recovery: 500 points approx.
This reversal from key support confirms the significance of the Ending Diagonal breakdown, followed by profit booking and an intraday bounce. Watching the next wave structure will be crucial for further moves.
But here’s the big question:
How Much Fall?
That’s for your financial analyst to answer, but history suggests that ED (Ending Diagonal) or Rising Wedge breakdowns often erase a large portion of prior gains in a relatively short time. Today’s action is a reminder—markets don't forgive complacency.
You witnessed the dramatic 1000+ point fall from 50000 to 49000 (approx.) in a single day post the ED pattern & bounce - all cheers! to the pattern
Fundamental Backdrop - Budget Disappoints Street Expectations
While the government introduced personal income tax cuts aimed at boosting consumption, the markets responded with caution rather than optimism. Several factors weighed on investor sentiment:
- Profit booking after a four-session rally ahead of the budget
- Economic Survey 2024-25 highlighted concerns about a potential market correction, particularly impacting retail investors who may not have seen significant downturns before
This confluence of technical exhaustion and lukewarm fundamental sentiment led to today’s sell-off.
✅ Key Takeaways & Next Steps
- 50000 top confirmed as ED completion
- Sharp downside expected as structure breaks down
- Fundamental triggers amplify selling pressure
- Profit-taking and caution dominate post-budget moves
The reversal is here. The next critical question is: Which wave unfolds next? Will it extend into a deeper corrective structure, or is there a potential counter-trend bounce? Identifying the next logical buying or selling zone will depend on how the upcoming wave develops within the larger Elliott Wave framework.
Stay sharp, stay prepared, and catch me later in another exciting update from WaveTalks – Market Whispers! Can you hear them?🔥
Regards,
WaveTalks
Abhishek

BankNifty -Will It Be Explosive Up - 49650+ ( Missed last time)Disclaimer:
This analysis is for educational purposes only. Please consult your financial advisor before making any trading decisions.
WaveTalks Market Insight – The Next Big Move?
As discussed in the last idea, the market witnessed a failed impulse as per the dea mentioned below, leading the Index to drop to slightly new lows on 27th Jan 2025 before eventually turning back upward. This movement sets up an interesting wave structure that traders need to watch closely.
Last TradingView Idea
Wave Structure Breakdown
Wave 3:
Successfully extended and touched 49250 (approx) before losing momentum.
Wave 4:
Currently forming a triangle or is about to complete its final phase.
Key Level – 49250: This level is acting as a pivotal point.
What Happened at 49250?
After hitting 49250, the market witnessed a sharp sell-off, dragging prices down to 48750 in the closing session on 28th Jan 2025. This drop suggests the wave 4 consolidation phase is still in play before the next directional move.
Trading Strategy – What to Watch For?
🚀 Next Buying Opportunity:
Above 49250, a breakout from the triangle in Wave 4 could trigger a strong thrust towards 49650
This aligns with the Elliott Wave thrust pattern, where triangles typically lead to a strong final push (Wave 5).
🔻 Caution for Sellers:
If the price fails to hold above 49250, the triangle might extend, leading to further consolidation or a potential false breakout trap.
Support to watch: 48750 – If this level gives way, further downside risk increases.
Execution Plan for Traders
Long Entry:
Above 49250, confirming strength with volume.
Target: 49650+ (Wave 5 thrust).
Stop Loss: Below 49000, ensuring protection against false breakouts.
Alternative Scenario : If 48750 breaks, re-evaluate for a potential deeper correction.
📌 Final Thoughts:
This setup presents a high-probability trade if the structure plays out as expected. However, market conditions can change rapidly, so risk management is key.
Regards,
WaveTalks
Market Whispers! – Can You Hear Them?

BankNifty's Elliott Wave : Can It Reach Targets 49250+ & 49650+ As Elliotticians, this is one of the cardinal rules often overlooked, leading analysts and traders into traps. However, knowing the "line in the sand" where you could go wrong—48610—is crucial.
Getting the opportunity and executing the trade is another challenge, leaving no room for emotions. Emotions in trading can be dangerous; in fact, managing emotions is equally important in real-life decision-making.
As discussed earlier today, just 60 minutes ago, the question remains: Can we touch 49250+ and 49650+ upside targets?
Always consult your financial advisor before making any trades.
Regards,
WaveTalks
Market Whispers - Can You Hear Them?

Bank Nifty - Is this A Rising Wedge from 47898 As discussed early morning .... 49000 was our key & psychological level ... Index dropped & came close to 48500-48600 zone
Falling From 49000 Level
Support Zone 48500-48600
Makar Sankranti marks the Sun's transition into Capricorn and the beginning of an auspicious period. Historically, equity markets turn optimistic post-Makar Sankranti, driven by cultural sentiment and Budget expectations. Will Budget 2025 keep the trend alive? 🌞
This comes after a 26-day fall in major benchmark indices, which started on 5th Dec 2024.
In the last two days, the index surged from 47,898 to 49,000. However, during the first half of today's session (15th Jan 2025), it fell below 49,000, hitting a low of 48,522 as shown in the snapshots

BankNifty at Crossroads: Will 52,600 Hold the Bulls?As per our last update via comment: “Bulls will remain strong if the index holds above 52,600.”...
5th December 2024
The rising trendline halted the index at 53,888.
6th Dec 2024
Post-RBI policy today, the index again paused near the rising trendline.
The big question
Will the buying zone of 52,500-52,600 come into play again?
And if it does, will it hold that zone?
“If the index revisits the 52,500-52,600 zone and holds, will you dare to miss the opportunity to ride the bulls again?”
Market Whispers! ...Can You Hear Them?
Regards,
WaveTalks
Abhishek

BankNifty - 900 Points Bounce - Leading Diagonal Scenario ?As we discussed on 1st Dec 2024, an upside move towards the recent high was anticipated. If the recent high holds...then what?
I'm glad to see we got a strong 900+ points bounce in Bank Nifty Index since Monday, 2nd Dec 2024. This aligns exactly with our weekend discussion.
Elliott Wave Analysis (Advanced School of Thought)
This could be a classic market scenario to include in my upcoming book. If the index halts below 52760, we might be witnessing a Leading Diagonal Scenario:
From the highs of 52760's
Referencing the bible book of Elliott Wave by Frost & Prechter (Page 41, Figure 1-21):
Snapshot captured at 11;49 am / 3rd Dec 2024
Leading Diagonals occur at the start of a decline.
They can retrace up to 99.99% but cannot exceed 100%, which would be 52760 in this case.
Current Scenario:
A Leading Diagonal appears to be forming from the highs of 52760.
It has retraced until today's high of 52748.
Can This Be a Double Top and Leading Diagonal Scenario at 52760?
Line in the Sand (Stop Loss):
The index cannot cross above 52760. If it does, the pattern is invalidated, and we’ll need to reassess.
Market Whispers! ...Can You Hear Them?
Regards,
WaveTalks
Abhishek

BankNifty, Nifty, Gold & Bitcoin - Maha Bounce!In last week's video, we anticipated significant moves across BankNifty, Nifty, Gold, and Bitcoin, all aligning with NDA+ victory in the Maharashtra Assembly elections. Here’s a quick recap and what to watch next:
BankNifty: What's Next?
- The index could face resistance in the 51650-51950 zone as a Bearish Shark pattern unfolds along with falling channel resistance.
- If a gap-up move brings BankNifty into this resistance zone and it holds below 52000, it could present an opportunity to sell.
- Key Alert: If the index breaks above 52000, the Bearish Shark pattern becomes invalid, as it would breach the falling channel.
- In case of a gap-up opening at 51650-51950, be cautious of a sharp drop towards the 50950-51000- first target zone downside
- Further downside could extend to 50350-50550 if 50900 support breaks.
Gold: A $100+ Upside Move
Gold delivered a remarkable bounce, gaining over $100 + as discussed last week.
Bitcoin: Nearing $100,000
Bitcoin is on the verge of a monumental milestone, heading close to the $100,000 mark—a notable achievement since last week's prediction.
Stay sharp as we enter this critical week. Watch for the levels discussed, and remember to trade with caution. Let’s see how these setups play out!
Market whispers! Can You Hear Them?
Have a great week ahead!
Best regards,
WaveTalks

Bitcoin - Irregular Triangle heading for 100,000 USD Target ?As discussed in yesterday's video, we're expecting a thrust in Bitcoin towards the 100K USD mark. Will this milestone become a reality soon? 🚀💰
Irregular Triangle
An Irregular Triangle has beautifully unfolded, setting the stage for an upside thrust as per Elliott Wave Theory. This pattern, characterized by its distinct higher highs and lower lows within corrective waves, signals the breakout wave.
From a wave perspective:
- The ABCDE structure of the triangle suggests a classic consolidation phase is complete.
- The upward thrust aligns with the typical post-triangle behavior, often extends strongly in the direction of the trend.
Regards,
WaveTalks
Abhishek
Disclaimer
-----------------------------
All investments involve risk, and the past performance of a security, industry, sector, market, financial product, trading strategy, or individual’s trading does not guarantee future results or returns. Investors are fully responsible for any investment decisions they make. Such decisions should be based solely on an evaluation of their financial circumstances, investment objectives, risk tolerance, and liquidity needs.
-------------------------------------------------------------------------------

BankNifty -E Wave or Explosive Wave - 1000+ Point RallyAs we discussed in the last idea .... Magical support zone gave us 1000+ point rally so far -which is part of Wave-E as per Elliott Wave Triangle
#elliottwave #waveanalysis #endingdiagonal #fallingwedge #trianglecorrection #trianglewave #correctivewaves
WaveTalks Snapshot
Last Idea - Elliott Wave Triangle: The Black 2024 Effect
Regards,
WaveTalks
Abhishek

Elliott Wave Triangle: The Black 2024 Effect Elliott Wave Triangle: The Black 2024 Effect – The Calm Before the Breakout
The Endless Loop of Black (2024) Movie and BankNifty
In Black (2024 ), a couple is trapped in a never-ending time loop, going over the same path again and again. The BankNifty Index seems to follow a similar pattern, moving in waves that repeat familiar highs and lows. This strange similarity pulls us in, as both the movie and the market seem to be on a path that’s both puzzling and exciting.
A Powerful Journey Through Time
Black (2024) is more than just a movie—it’s a story about love, destiny, and time’s unbreakable cycles. With powerful direction, the movie takes us on a deep journey, revealing hidden truths with each loop. In the same way, BankNifty’s wave-like patterns give moments of clarity, only to change direction again, much like a never-ending dance in the market.
Could the U.S. Election Be Fueling This Pattern?
BankNifty’s cycle might also reflect the high stakes of the U.S. Presidential Election . With Kamala Harris and Donald Trump neck-and-neck in the race, the market feels the tension of this intense battle. BankNifty is forming an Elliott Wave Triangle – a pattern that traps traders in a similar loop of ups and downs, mirroring the suspense and energy of the election.
Elliott Wave Triangle: The Calm Before the Breakout
The Elliott Wave Triangle pattern is a consolidating formation that shows up when the market is preparing for its next big move. It forms a series of back-and-forth waves, typically in five parts (A-B-C-D-E), creating a narrowing structure like a triangle. This pattern often appears before a strong breakout, either up or down, signaling that traders should be ready for a significant shift in the trend. The Elliott Wave Triangle is like a pause before the market's next direction, building energy before it makes a decisive move.
Caution: Don’t Be Fooled by the Stability
What looks stable may actually be unpredictable. A fall below 50194 (last reached on October 7) could spark a quick drop towards 49500-49600 . If BankNifty slips below 49500 , it could fall even further, aiming for 47800-48000 .
Short Term Wave Structure
Short Term Support Zone for Wave-D to Halt & Take Support is 51000-50800 - Getting Support could make it bounce upside towards falling trendline connecting Wave A & Wave-C which might bring end to Wave-E , Once wave-E gets completed …Larger trend & more violent wave will start.
Alternate Wave Path - A-B-C-D1-E1
If gap is breached below 50800..Index can drop to 50500-50600 zone as support zone & follow wave path D1 & later E1
The Black Loop in BankNifty: Are You Ready?
Just like the thrilling loops in Black , these market waves might seem familiar yet hide surprises at every turn. Market Whispers, can you hear them? The Black Loop in BankNifty captures both the thrill of the U.S. election and the mystery of Elliott Wave patterns. As both the story and the market cycles unfold, only those who are ready can avoid getting stuck in the loop.
#elliottwavetriangle #black2024 #correctivestructure #wavetalks #correctivewaves #trianglebreakout
Regards,
WaveTalks
Abhishek

HDFC Bank / BankNifty - The Giant Cracks & Index Melts 4000 +Disclaimer:
This is for informational purposes only and is not a solicitation or offer to buy or sell any securities or products.
--------------------------------------------------------------------------------------------
Recap from 25th Sep 2024
Giant Crack Alert: BankNifty’s drop from 54,467 on 26th Sep 2024 to 50,194 by 7th Oct 2024 got its hint from the HDFC idea published on 25th Sep. When a giant like HDFC cracks, imagine the shockwaves across the entire index!
HDFC - Will it take U-Turn from 1800 — Indeed It was giant crack from 1788
---------------------------------------------------------------------------------------------
Short Term
Strong Support Zone
50900-51000 - Avoid taking any buy or long positions below 51000 . Safe Traders to Buy if Index crosses above 51356 & holds above. Risky Traders can look for buying opportunities until Index holds above 51000 or drops close to 51000
Minor Resistance
51925 - 52050 is the minor resistance zone so any bounce upside holding 51000 can halt in this zone & crossing above 52100 - It can push towards strong resistance zone 52900-53100
Strong Resistance
52900-53100
Wishing You A Happy & Prosperous Diwali 2024
From WaveTalks
Abhishek

Maruti - Up, Up & Away in the 5th Wave Above12555 Disclaimer:
This is not a solicitation to buy or sell; please consult your financial advisor before making any trading decisions
As discussed earlier on 1st Sep Idea, Maruti’s performance above 12555 was critical. Now, the stock is pushing Up & Up & Away with new highs beyond 13680 in sight.
Will it break the upper trendline and complete the highly anticipated Wave 5 in the Elliott Wave Structure ?
Last Idea - 1st Sep 2024 : Maruti Suzuki - Will it fly Above 12555
Regards,
WaveTalks

HDFC - Will it take U-Turn ? - Close from 1800 Disclaimer:
Trading in financial markets involves substantial risks. Consult your financial advisor before making decisions. This commentary is not a solicitation to buy or sell.
WaveTalks - Market Whispers! Can you hear them?...........
Will the Giant Take a U-Turn after achieving all the targets 1555 was the first in the series ....
Possible Reasons for Next Expected Move
Possible Double Top at 1794 ( Will be valid until holds below 1800)
Pattern Thrust from 1630's - Key level
Elliott Wave - Corrective Sequence could be completed from the support zone 1375 - 1390 to 1800 approx highs .or about to end .mentioned in the connecting 1st idea published on 27th Jan 2024 - The Bullish Gartley
Bullish Gartley Idea ( 1375 - 1800..) - 1st Idea of the Series in Jan 2024
Enjoying Target 1 - 1555 in April 2024
Nifty at 26000 - We are almost close to 27600's Target ...Can we achieve the dream run or we correct & later push towards
From WaveTalks
Good Night

Bank Nifty - Explosive 800+ Points MoveDisclaimer:
The content provided here is for informational and educational purposes only and should not be considered as financial advice or a solicitation to buy or sell any securities. Always do your own research or consult with a professional advisor before making any trading or investment decisions. WaveTalks is not responsible for any losses that may occur as a result of reliance on this information.
WaveTalks - Market Whispers! Can you hear them?
The insights are fascinating, and when combined with old-school analysis, it becomes a lethal combination – as you witnessed today in the markets.
Bank Nifty: Bhelpuri Analysis at its Best!
What you saw unfold today was a result of a bhelpuri analysis. To simplify, this powerful move started with a Bullish Engulfing Candlestick Pattern right at the bottom of the historical level (50939-50950), as highlighted in the last update combined with Wave Analysis
Last Idea - Enjoyed 1350+ Points
Today, Bank Nifty surged by 850+ points, nearly achieving our third target, falling short by just 150 points. But no worries, the magic in today’s waves was undeniable.
Key Psychological Level :
Bank Nifty is now approaching the 52000 mark. If it breaks past this level, we could witness an even more explosive move.
Caution Near 52000 :
However, if it struggles at 52000, caution will be necessary as we approach this critical threshold.
Nifty: Major Surge Across Indices
While Bank Nifty stole the show with its remarkable 850+ point leap, Nifty also saw a significant rally, jumping 490 points in a single day! This synchronized movement in the indices is a testament to the power of blending Wave Analysis with traditional methods.

Bank Nifty - Enjoyed1350 points from 51700+ What Next?Last Time Holding 50939 ...Which was wave-a of the triangle while moving upside & we achieved 51700 target
Explore the latest Bank Nifty Analysis with WaveTalks
Finally ...What A Fall from 51700 to 50300's as expected ...Index dropped & bounced
Last Idea - 51700 - Is this Short Term Top
We are here again at crucial historical level 50939 / 50950...If Index holds above this level..can we bounce again upside towards 51350 / 51450 & crossing 51700+ this time it can jump towards 52000
