PAYTM (One 97 Communications Ltd.) – Technical Outlook & LevelsPAYTM is currently trading near ₹1,344 and remains in a strong upward Elliott Wave structure.
A clean breakout above ₹1,380–1,400 may trigger Wave-3 momentum toward ₹1,850–₹2,000.
Supports at ₹1,300 and ₹1,225 remain crucial for trend continuation, while ₹1,250 acts as an ideal stop-loss for swing setups. Long-term Wave-5 projections suggest a potential move toward ₹2,150–₹2,250.
🎯 Future Target Levels
🔹 Swing Trading Targets
• Target 1: ₹1,420 – ₹1,450
• Target 2: ₹1,550 – ₹1,600
🔹 Position Trading Targets
• Wave 3 Target Zone:
👉 ₹1,850 – ₹2,000 (Fib 1.618–2.0 extension)
• Wave 5 Extended Target:
👉 ₹2,150 – ₹2,250 (Post Wave-4 completion)
🛑 Key Support Levels
• Major Support: ₹1,300
• Intermediate Support: ₹1,225
• Structural Support: ₹1,100 (previous swing-low zone)
📌 Resistance Levels
• Immediate Resistance: ₹1,380
• Next Resistance: ₹1,450
• Major Resistance Zone: ₹1,550 – ₹1,600 (Breakout above this zone can accelerate the Wave-3 rally)
🔐 Stop-Loss Recommendations
Swing Trades
• SL: ₹1,250 (below trendline & previous corrective low)
Positional Trades
• SL: ₹1,180 (below Wave-2 base level)
📌 Thanks a ton for checking out my idea! Hope it sparked some value for you.
🙏 Follow for more insights
👍 Boost if you found it helpful
✍️ Drop a comment with your thoughts below!
Wavetheory

Nifty – Complex Corrective Structure on Lower Timeframe (ElliottThe attached chart illustrates a developing complex correction in Nifty on the lower timeframe, with multiple flat structures and a terminal impulsive sequence.
Wave (a) – Flat Correction
Wave (a) (marked in red) unfolds as a classic flat, where the internal (A)–(B)–(C) subdivision (in blue) follows a 3–3–5 structure. The retracement in wave (B) is relatively deep, consistent with flat correction behavior.
Wave (b) – Flat Correction
Wave (b) again resolves as a flat correction, reinforcing the sideways and overlapping nature of the broader corrective phase. Price action during this segment remains choppy, typical of corrective markets.
Wave (c) – Five-Wave Impulse
Wave (c) progresses as a clear five-wave impulse, adhering to Elliott Wave principles:
Wave 1: Initiates the bullish leg from the wave (b) low.
Wave 2: Forms a flat correction, providing a controlled retracement without violating wave-1 origin.
Wave 3: Extends impulsively, showing strong momentum and range expansion.
Wave 4: Develops as an expanding triangle (A–B–C–D–E), indicating volatility expansion and time correction.
Wave 5: Concludes with an impulsive push to complete wave (c).
Overall View
The structure suggests a mature corrective pattern composed of multiple flats and a final impulsive leg. Such formations often precede either a higher-degree trend resumption or a larger consolidation. Traders should be mindful of false breakouts and overlapping moves, as complex corrections can remain range-bound longer than expected.

SBICARDS : Everyone Gave Up… That’s When Bases Are Born📊 SBI Cards & Payment Services Limited – Weekly Technical Analysis
Timeframe: Weekly
CMP: ~₹771
Trend Context: Larger base formation after extended correction
Structure: ABC corrective wave + potential Cup & Handle completion
🔍 Big Picture Structure (What’s Really Happening)
SBI Cards earlier witnessed strong selling from an extended retracement / supply zone (113%–127%), which is a classic area where:
Long-term holders book profits
Institutions reduce exposure
Late breakout buyers get trapped
This led to a controlled ABC correction, not a breakdown of the long-term structure.
📘 Markets correct to reset positioning, not to punish everyone.
📐 Why the Marked Levels Matter (Trading Psychology Explained)
🟦 ABC Completion / Demand Zone: ₹720 – ₹770
This is the most important zone on the chart.
🧠 Why price can react here:
Sellers from higher levels have largely exited
Value buyers step in near prior accumulation areas
Shorts start covering as downside momentum fades
👉 This zone represents fear exhaustion, where selling pressure typically dries up.
📌 It also aligns with a potential “handle” completion of a larger Cup & Handle pattern.
🔴 Invalidation / Risk Level: ₹690 (Day Close Below)
Breakdown below this level damages base structure
Psychology shifts from “buying dips” to “capital protection”
Confidence erosion can invite fresh selling
📉 Below ₹690, downside risk increases sharply.
🔑 Upside Levels & Targets (Why They Matter)
🟠 First Target Zone: ₹990 – ₹1,020
Prior supply memory
Trapped traders look to exit here
Profit booking likely on first approach
📘 Markets often hesitate where pain was previously created.
🟢 Second Target: ₹1,127
Larger pattern projection
Psychological round-number magnet
Momentum & FOMO participation zone
📈 Acceptance above ₹1,020 can accelerate price toward this zone.
🟢 Bullish Scenario (Primary Probability)
If price:
Holds above ₹720–770
Forms a base or higher low on weekly chart
Then:
Gradual recovery toward ₹990–1,020
Break & sustain → ₹1,127
Confirms base-to-expansion transition
📘 Strong bases often look boring before they explode.
🔴 Bearish Risk Scenario
If price:
Closes below ₹690
Then:
Base structure weakens
Buyers step aside
Market searches for deeper liquidity zones
📉 This reflects loss of confidence, not just technical damage.
🎓 Educational Takeaways
Corrections end where fear peaks, not where hope feels strong
Fibonacci & pattern zones work because crowds react together
Bases form quietly; breakouts are loud
The best opportunities feel uncomfortable at entry
🧠 Emotion Map of This Chart
Zone Dominant Emotion
Highs Greed & Euphoria
Decline Denial
Base zone Fear vs Opportunity
Breakout Relief & Momentum
Targets FOMO
📘 Charts are stories of crowd psychology, not just price.
🔮 Price Outlook (Educational Projection)
Above ₹770: Base confirmation improves
Above ₹1,020: Momentum revival
Upside targets: ₹1,127
Below ₹690: Caution, structure weakens
🧾 Conclusion
SBI Cards appears to be transitioning from correction to base formation.
The ₹720–770 zone is a decision area that can decide whether the stock moves into a new accumulation phase or slips into deeper weakness.
📌 Big moves are born from boring bases.
⚠️ Disclaimer
This analysis is for educational purposes only.
I am not a SEBI registered analyst. Markets involve risk, and I can be wrong.
Please consult your financial advisor before making any trading or investment decisions.

When Fear Meets Structure: Is BAJAJFINSV Preparing for?🧠
📊 Bajaj Finserv Limited – Daily Technical Analysis
Timeframe: 1D
Trend Context: Primary uptrend intact, currently in corrective phase
Structure: ABC correction after supply from extended retracement
CMP Zone: ~₹1,993
EMA (200): ~₹1,992 (acting as dynamic support)
🔍 Big Picture: What’s Happening on the Chart?
Bajaj Finserv rallied strongly earlier and faced profit booking near an extended Fibonacci retracement zone (113%–127%), which is a classic institutional sell area.
After distribution, price has entered a corrective ABC structure, now approaching a high-probability demand zone.
📘 Markets don’t fall because fundamentals vanish — they fall because positions unwind.
📐 Why the Marked Levels Matter (Trading Psychology Explained)
🔴 Supply Zone: ₹2,168 – ₹2,202 (113%–127%)
This zone attracted sellers because:
Early investors booked profits at stretched projections
Risk-reward turned unfavorable for fresh longs
Late breakout buyers got trapped
🧠 Extended Fibonacci zones often mark “greed peaks”.
🟦 Golden Retracement Zone: ₹1,952 – ₹2,040
(50%–78.6% retracement of the prior rally)
This is the most important zone on the chart.
Why reactions are expected here:
Long-term investors look to re-enter at “fair value”
Swing traders cover shorts near known demand
Existing longs defend this zone to protect trend
📌 This zone represents fear vs opportunity, where markets often pause or reverse.
🔵 EMA 200 Confluence (~₹1,992)
Watched by institutions & positional traders
Acts as dynamic support in trending markets
Reinforces confidence for dip buyers
📘 When multiple supports align, reactions become stronger.
🔴 Invalidation / Stop Zone: ₹1,935 (Daily Close Below)
Break below here damages bullish structure
Psychology shifts from “buy the dip” to “capital protection”
📉 Below this, next liquidity pocket opens near ₹1,807.
🟢 Bullish Scenario (Higher Probability)
If price:
Holds above ₹1,952
Stabilizes above EMA 200
Then:
Bounce toward ₹2,040
Acceptance above ₹2,040 → move toward ₹2,168
Momentum continuation targets ₹2,242 – ₹2,274
📈 This would mark completion of correction and start of next impulse.
🔴 Bearish Risk Scenario (If Structure Fails)
If price:
Closes below ₹1,935
Then:
Dip buyers exit
Confidence erodes
Price may slide toward ₹1,807
📉 This reflects fear-driven liquidation, not trend reversal yet.
🎓 Educational Takeaways (Very Important)
Strong stocks correct to invite participation, not to collapse
Fibonacci works because traders collectively believe in it
EMA levels act as psychological anchors
The best trades emerge when news feels worst but structure holds
🧠 Emotion Map Behind the Chart
Zone Dominant Emotion
Highs (2,200+) Greed & Distribution
Pullback Confusion
Golden Zone Fear vs Opportunity
Breakdown Panic
Bounce Relief & Momentum
📘 Charts are stories of emotion, not just price.
🔮 Price Outlook (Educational Projection)
Above ₹1,952: Bullish bias intact
Above ₹2,040: Recovery gains strength
Targets: ₹2,168 → ₹2,242–2,274
Below ₹1,935: Caution, deeper correction
Below ₹1,807: Structure weakens materially
🧾 Conclusion
Bajaj Finserv is currently testing a high-confluence demand zone after a healthy profit-booking phase.
The ₹1,952–2,040 region will decide whether this correction ends as accumulation or turns into extended weakness.
📌 Strong trends don’t die quietly — they test conviction first.
⚠️ Disclaimer
This analysis is for educational purposes only.
I am not a SEBI registered analyst. Markets involve risk, and I can be wrong.
Please consult your financial advisor before taking any trade or investment decision.

NIFTY : Intraday Trading levels and Plan for 23-Jan-2026📘 NIFTY Trading Plan – 23 Jan 2026
Timeframe: 15-Minute
Gap Considered: 100+ Points
Market Context: After a sharp intraday recovery from lower levels, NIFTY is now approaching a key decision-making zone. Trend is still corrective, with range expansion possible on either side.
🔼 SCENARIO 1: GAP UP OPENING (100+ points) 🚀
If NIFTY opens above 25,498, it indicates follow-through buying and short-covering.
The zone 25,498 – 25,537 will act as the first opening resistance.
Sustained 15-min close above 25,537 can trigger momentum toward:
• 25,666 – 25,718 (Last Resistance Zone)
Above 25,718, trend strength improves and fresh longs may emerge.
Failure to sustain above 25,498 = high probability of rejection and pullback.
📌 Educational Insight:
Gap-up openings near resistance often trap late buyers. Confirmation is mandatory before aggressive longs.
📌 Options View:
• Bull Call Spread preferred over naked CE
• Partial profit booking near resistance
• Avoid chasing premiums 🚀
➡️ SCENARIO 2: FLAT / RANGE OPENING ⚖️
If NIFTY opens between 25,301 – 25,378, expect range-bound and whipsaw price action.
This zone acts as a No-Trade Zone / Balance Area.
Multiple fake breakouts are likely.
Upside confirmation only above 25,498.
Downside weakness below 25,301.
Wait for a 15-min close outside the range before taking trades.
📌 Educational Insight:
Flat opens after volatile sessions usually lead to time correction, not directional moves.
📌 Options View:
• Iron Fly / Short Strangle with strict SL
• Low quantity & fast exits
• Protect capital over profits ⏳
🔽 SCENARIO 3: GAP DOWN OPENING (100+ points) 📉
If NIFTY opens below 25,301, sellers regain short-term control.
Immediate support lies near 25,177.
Break below 25,177 opens downside toward:
• 25,031 – 25,077 (Last Intraday Support)
Below 25,030, bearish momentum can accelerate.
Any pullback toward 25,301 – 25,378 should be treated as sell-on-rise.
📌 Educational Insight:
Gap-down opens demand patience — let volatility settle before initiating trades.
📌 Options View:
• Bear Put Spread preferred
• Avoid PE selling in falling markets
• Trail stop-loss aggressively 📉
🧠 Risk Management Tips for Options Traders 🛡️
Risk only 1–2% of capital per trade.
Expiry proximity = faster theta decay.
Prefer spreads over naked options.
No candle confirmation = no trade.
Avoid overtrading inside no-trade zones.
📌 Summary & Conclusion ✨
NIFTY is trading near a critical equilibrium zone.
📍 25,301 – 25,378 = decision area
📍 Strength only above 25,498 → 25,718
📍 Weakness below 25,301 → 25,177 → 25,030
Patience, discipline, and level-based execution will be key for 23 Jan.
⚠️ Disclaimer
This analysis is strictly for educational purposes only.
I am not a SEBI registered analyst.
Markets are uncertain and I may be wrong.
Please consult your financial advisor before trading.

Astral on the Verge: Technical Breakout & Investment Zones MappeAstral Limited : CMP: 1557.30: After studying its monthly chart structure and weekly Elliott Wave formations. Recent price action suggests a potential breakout setup, offering opportunities for both aggressive traders and patient investors.
Entry for Aggressive Traders:
• Aggressive traders can look for a breakout above the recent swing high near 1,579, as marked on both the monthly and weekly charts. This level has already shown strong momentum, with a notable price jump of +7.39% in the recent candle.
• Targets: 1630, 1725, 1795, 1935, 2200. Use trailing stop-loss: 1500, 1625, 1710, 1790, 1900 as you move up. Manage risk and adjust stop-loss as per levels.
Conservative Entry for Investors
• Investor Entry: Investors may enter on reasonable dips towards 1,440–1,460 support zone, as this range aligns with previous resistance turned support and is less volatile. Alternatively, entry after confirmation of the breakout above 1,579 with sustained volume is also suitable.
• Targets: Investors: Enter between 1,440–1,460. Targets: 1,935 and 2,200 for the medium term.
These represent major Fibonacci retracement zones and historical resistance levels, suggesting strong probability of acting as future price objectives. Investors can use a wider stop near 1,230 based on weekly chart support.
📌 Thanks a ton for checking out my idea! Hope it sparked some value for you.
🙏 Follow for more insights
👍 Boost if you found it helpful
✍️ Drop a comment with your thoughts below!

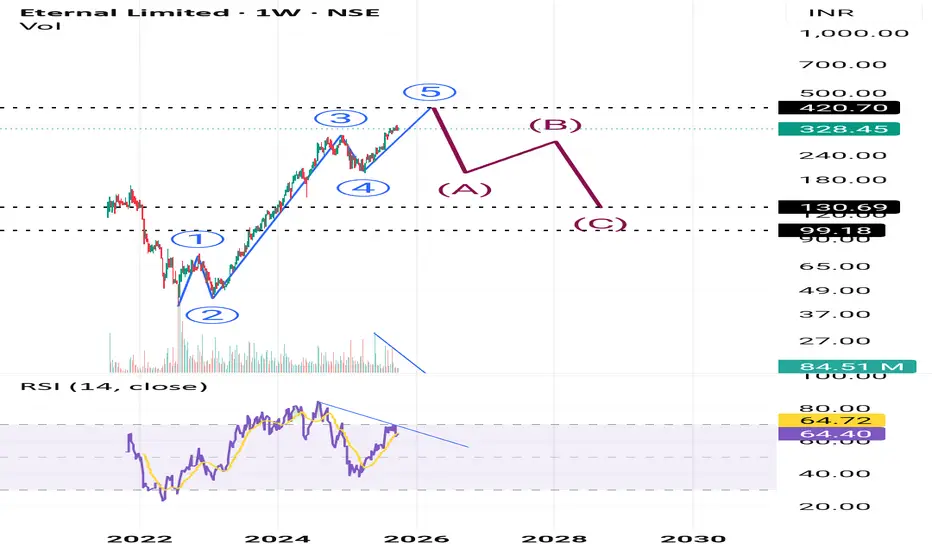
Eternal on weekly time frameAs per Eliott wave theory eternal is going to complete 5 waves impuse move at 420.70 on weekly time frame after that we can expect 70-75% crash as it's going to degree correction on higher frame to the lower mentioned levels.
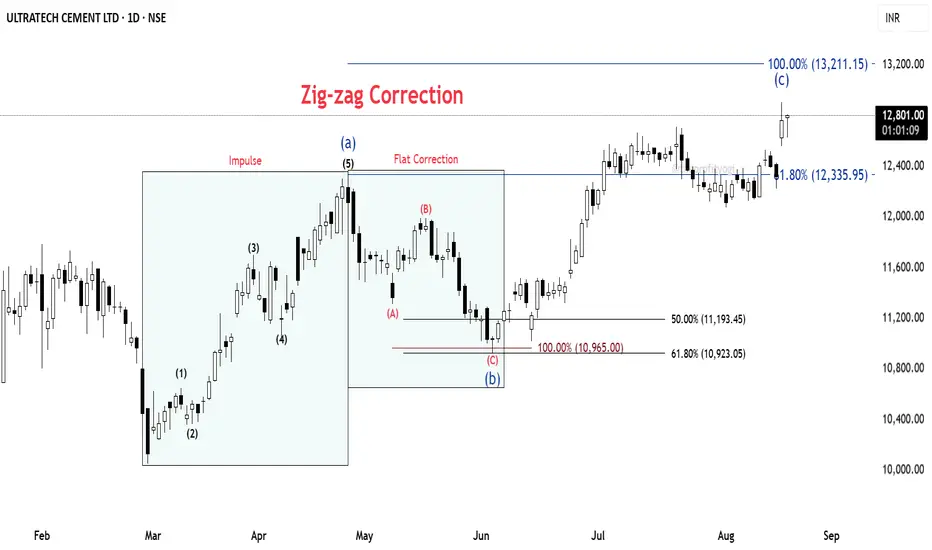
ULTRACEMCO: Wave C started from strong Fib clusterULTRACEMCO – Daily Chart Analysis
🔹 Base Point: The count begins from the low made on 3rd March 2025.
🔹 From this low, the price moved up in the form of a clear impulse wave, completing a 5-wave structure.
🔹 This was followed by a corrective fall, retracing 61.8% Fibonacci of the prior impulse.
⚡ Correction Phase:
The decline is counted as an ABC Flat correction (red).
Within this, the C wave extended fully to the 100% Fibonacci projection.
At this point, we observe a strong cluster zone formed by the 61.8% retracement and 100% extension, indicating confluence and potential support.
📈 Current Development:
From this support, the price has begun to move up again, showing the characteristics of a fresh impulse.
The overall structure fits into a larger Zig-Zag correction, where Wave C is still under development.⏳
📝 Summary:
✅ Impulse up (5 waves)
✅ Flat correction (A-B-C) complete at Fib cluster
🚀 Wave C of Zig-Zag unfolding
#ULTRACEMCO #NSEStocks #ElliottWave #Fibonacci #WaveAnalysis #TradingSetup #PriceAction
Best Possible Elliott Wave Counts: ETHUSDHello friends,
Welcome RK_Chaarts.
Today we're attempting to analyze Ethereum's chart from an Elliott Wave perspective. Looking at the monthly timeframe chart, we can see that from the beginning, around 2015-2016, when data is available, to the top in 2021 we have a Super Cycle degree Wave (I) marked in blue, which has completed.
Next, June 2022 we have a bottom around $874, marking the end of Super Cycle Wave (II) in blue.
We are now unfolding Wave (III), which should have five sub-divisions. Within this, the red Cycle degree Wave I and Wave II have completed, and we have possibly started the third of third wave.
Monthly:
Moving to a lower timeframe (Weekly) where we observed the completion of blue Wave (II) and the start of Wave (III), we notice that within this, the red Cycle degree Wave I and Wave II have completed, and we've possibly started Wave III of cycle degree marked in Red.
Furthermore, friends, within this third wave, we've marked the black Primary degree Waves ((1)) and ((2)), which we've labeled as Rounded ((1)) and Rounded ((2)). We're assuming these are complete, and Wave ((3)) has started, which is our current working hypothesis.
Weekly:
Now, if we move to a lower timeframe, such as the daily chart, we can see that the Cycle degree Wave II, which ended at 1385.70, has been followed by a Primary degree black Wave ((1)) in Black & Wave ((2)) has pulled back, completing Waves ((1)) and ((2)), and now Primary degree Wave ((3)) has started.
Possible wave counts on Daily
Within Wave ((3)), we expect five Intermediate degree waves. We've marked the first Intermediate degree Wave (1) in blue, which is currently unfolding. If we move to an even lower timeframe, such as the 4-hour chart, we can see that within the Intermediate degree blue Wave (1), there are five Minor degree sub-divisions marked in red. Waves 1 and 2 are complete, and Wave 3 is nearing completion.
Possible wave counts on 4 Hours:
Once Wave 3 is complete, we expect Waves 4 and 5 to follow, completing the Intermediate degree blue Wave (1). After that, we may see a dip in the form of Wave (2), followed by a continuation of the bullish trend as blue Wave (3).
Possible wave counts on 60 Min:
Friends, based on our multi-timeframe analysis, the overall wave structure appears bullish. We've provided snapshots of each timeframe, and you can see the nearest invalidation level marked with a red line.
In this study, we're using Elliott Wave theory and structure, which involves multiple possibilities. The scenario we're presenting seems plausible because it's aligned across multiple timeframes and adheres to Elliott Wave principles. However, please remember that this analysis can be wrong, and you should consult with a financial advisor before making any investment decisions.
This post is shared purely for educational purposes, to illustrate possible Elliott Waves.
I am not Sebi registered analyst.
My studies are for educational purpose only.
Please Consult your financial advisor before trading or investing.
I am not responsible for any kinds of your profits and your losses.
Most investors treat trading as a hobby because they have a full-time job doing something else.
However, If you treat trading like a business, it will pay you like a business.
If you treat like a hobby, hobbies don't pay, they cost you...!
Hope this post is helpful to community
Thanks
RK💕
Disclaimer and Risk Warning.
The analysis and discussion provided on in.tradingview.com/u/RK_Chaarts/ is intended for educational purposes only and should not be relied upon for trading decisions. RK_Chaarts is not an investment adviser and the information provided here should not be taken as professional investment advice. Before buying or selling any investments, securities, or precious metals, it is recommended that you conduct your own due diligence. RK_Chaarts does not share in your profits and will not take responsibility for any losses you may incur. So Please Consult your financial advisor before trading or investing.

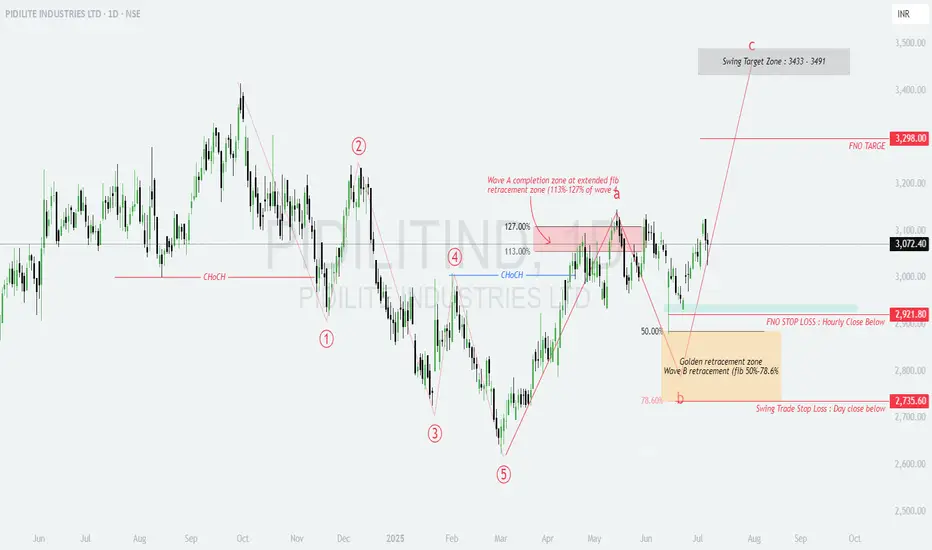
Hidden in Plain Sight – This PIDILITE Setup Screams Opportunity!📊 PIDILITE – Post 5-Wave Fall, ABC Recovery In Progress
Golden Fib confluence + strong structure = high-confidence swing setup
Wave structure aligns with ideal retracements; Wave C potential unfolding with swing targets ahead.
🧩 Elliott Wave Breakdown:
Complete 5-wave decline from swing highs → Wave 5 bottom confirmed
Wave A completed at extended fib zone (113%–127% of wave a)
Wave B retraced to Golden Zone: 50%–78.6% of Wave A
Wave C now progressing toward swing target zone
🔍 Technical Confluences:
Wave A Completion: ₹3130–₹3180 (113–127% extension)
Wave B Golden Zone: ₹2735–₹2921
Strong bullish rejection and follow-through from Wave B lows
CHoCH break confirms trend reversal from Wave 5 low
🎯 Target Zone for Wave C:
Primary Swing Target: ₹3433–₹3491
FNO Upside Level: ₹3298
🛑 Stop-Loss Levels:
Intraday SL: Hourly close below ₹2921.80
Positional SL: Day close below ₹2735.60
📈 Setup Summary:
Clear ABC corrective recovery in play
Ideal Fib alignment at both Wave A and B
Structure favors low-risk, high-reward long opportunity
Entry near ₹3070–3080 offers excellent positioning
A technically sound swing setup with defined structure and reward zones – great candidate for Wave C riders.
#Pidilite #ElliottWave #SwingSetup #WaveTheory #Nifty200 #TradingViewIndia
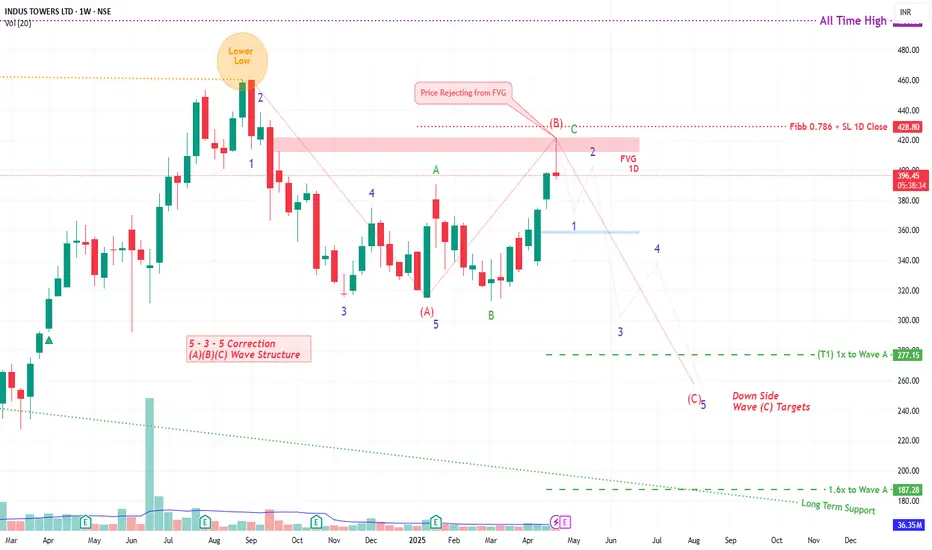
INDUS TOWER By KRS Charts25th April 2025 / 9:40 AM
Why INDUSTOWER??
1. Stock was reached its near ATH level but not able to hold the levels in Sep 2024 . From this point to today it seems like bullishness is getting weaker.
2. Wave Theory is saying Correction Wave ABC is ongoing and C is likely Started .
3. In support of more Correction from here FVG is visible in 1D TF and price are rejected from that level too.
4. Expecting correction from here in 5 Wave Structure towards downside.
Expected Targets and SL are mentioned in Chart
Note: This is Medium to Long Term View
EURUSD Chart Analysis : An Elliott Wave Approach Hello friends, welcome to RK Charts!
Today, we'll analyse the EURUSD chart using Elliot Waves. This study is based on Elliot Wave theory and structure, which enables multiple possibilities. Please note that the possibilities outlined here are not definitive predictions, but rather potential scenarios.
The provided information is for educational purposes only and should not be considered trading advice. There is a risk of being completely wrong, and users are warned not to trade or invest solely based on this study.
We are not responsible for any profits or losses incurred. Individuals should consult a financial advisor before making any trading or investment decisions.
Now, let's dive into the analysis. According to Elliot Wave principles, we're currently in a corrective pattern, which consists of ((A)), ((B)) and ((C)) patterns. We've completed ((A)) and ((B)) and are now unfolding ((C)).
Within ((C)) we expect five sub-divisions, labeled as intermediate waves (blue bracketed): blue (1), (2), (3), (4) & (5). Almost four of these sub-divisions are completed, and we've just begun the (5).
We've set an invalidation point at 1.1065, which is the recent low. If this low is not breached, we'll likely continue unfolding the (5) wave of ((C)), which should break above the high of wave (3).
However, if the low is breached, it's possible that wave (4) is undergoing a double correction.
Both scenarios are possible, and we'll continue to monitor the market's unfold.
Scenario 1
Scenario 2
This study is a deep dive into Elliot Wave counts, aligned with the rules and principles of Elliot Wave theory, as well as higher time frame and higher degree analysis.
I hope this analysis based on Elliot Wave theory has helped you understand the chart better and learn something new. Please keep in mind that this is for educational purposes only.
I am not Sebi registered analyst.
My studies are for educational purpose only.
Please Consult your financial advisor before trading or investing.
I am not responsible for any kinds of your profits and your losses.
Most investors treat trading as a hobby because they have a full-time job doing something else.
However, If you treat trading like a business, it will pay you like a business.
If you treat like a hobby, hobbies don't pay, they cost you...!
Hope this post is helpful to community
Thanks
RK💕
Disclaimer and Risk Warning.
The analysis and discussion provided on in.tradingview.com/u/RK_Charts/ is intended for educational purposes only and should not be relied upon for trading decisions. RK_Charts is not an investment adviser and the information provided here should not be taken as professional investment advice. Before buying or selling any investments, securities, or precious metals, it is recommended that you conduct your own due diligence. RK_Charts does not share in your profits and will not take responsibility for any losses you may incur. So Please Consult your financial advisor before trading or investing.

Crude Oil Futures Under Pressure; Key Resistance Confirmed at ₹5Crude Oil futures on the MCX continued their downward trajectory on Wednesday, closing near ₹4,949 amid growing bearish momentum. WaveNodes Pro Max AI flagged a "Seller Trap Possible", but downside targets remain intact for now.
Seller trap alert means big players are finding opportunity to trap or shed short sellers.
The system-identified Short Entry at ₹5,212 has held firm as resistance, with two clear retests failing to breach the impact zone of ₹5,233–₹5,263. This former support has now flipped decisively into supply, adding pressure on intraday rallies.
🔻 Key Developments:
AI Bearish Probability: Rises to 50.9%, surpassing bullish odds.
Target 1 (₹5,036–₹5,103) achieved successfully.
Target 2 set at ₹4,750–₹4,818, with potential for deeper correction toward ₹4,465–₹4,533.
Profit Booking Alert: ₹5,084 marked as short-term profit-taking zone.
📉 Market Sentiment:
Volatility remains elevated at 23 PPB, with good volatility reading at 21 PPB, suggesting controlled but active movement.
Despite bearish strength, the AI warns of a possible seller trap, especially if prices reclaim levels above ₹5,084.
🧠 Analyst Take: “The rejection at ₹5,212 confirms the breakdown structure. As long as crude trades below this zone, lower targets remain open. However, a surprise reclaim could trigger short covering,” analysts from WaveNodes noted.
📊 Outlook:
Trend: Bearish
Resistance: ₹5,212–₹5,263
Support: ₹4,750 → ₹4,465
Traders are advised to watch volumes closely as crude approaches the next support band. A failure to break lower could validate the seller trap thesis.

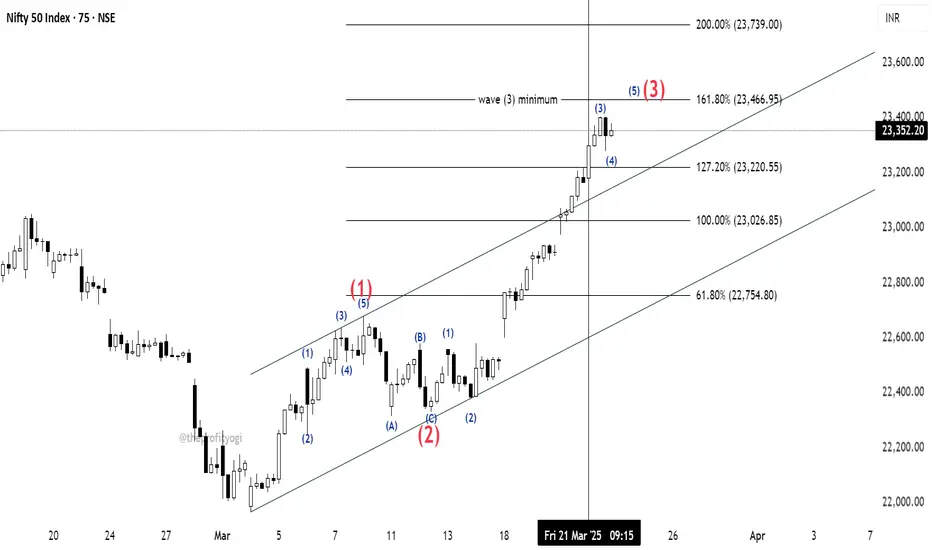
NIFTY detailed countingAs discussed in the last post, NIFTY's price has crossed over 23026.85 before 21st March so we can count the current move as wave (3). We can also see that price has broken the base channel, which is an important sign of wave (3) progression.
The detailed counting is given in the chart.
As we can see, the price is in subordinate wave 3 of the bigger wave (3).
The minimum target of Trending Impulse is 161.8% as per the rule.
We can expect the price to touch that level in the upcoming session.
I have marked, for now, a bigger wave (3) (in red) at 161.8% but as mentioned earlier, it is just the minimum target of it and the price may go beyond this level too.
This analysis is based on Elliott Wave theory and Fibonacci.
This is not any buying recommendation.
This analysis is for educational purposes only.
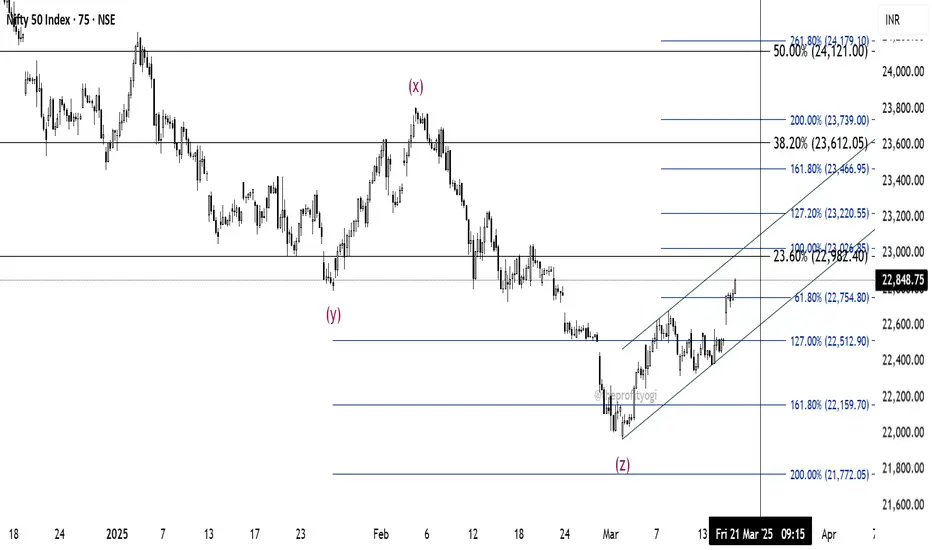
NIFTY: What's next?Nifty is moving as per our previous prediction posted on 5th March.
After making a low of 21964.60, which is the completion of wave Z, the price is moving upwards.
If this move is impulsive, the price must reach 100% level (23026.85) by 21st March.
At this level, there is a cluster of Fib retracement level of 23.6%
Further targets will be 127%, and 161.8% levels.
This analysis is based on Elliott Wave theory and Fibonacci.
This is not any buying recommendation.
For educational purposes only.
Is it a reversal in NIFTY?If we observe the daily chart of NIFTY, a pattern like Morning Star can be seen near the 161.8% retracement level. Also, as per our previous study, the recent fall was wave (Z).
The minimum target for it is 38.2% extension (which is a failure wave (Z) because most of the time, it is seen that wave (Z) is a failure or truncated).
So, we can have a risky buying opportunity here with a small stop-loss below the recent low. Or, if one wants to play safe, he may have his stop bellow 61.8% (21662) level.
The near target will be the bottom of wave (Y), i.e., 22786.90
This analysis is based on the Elliott wave theory and Fibonacci.
This is not any buying recommendations.
This analysis is for educational purposes only.

City Union Bank completed a Wave 4 on Weekly timeframeCity Union Bank has been in an uptrend since February 2009 and has recently completed Wave 4 in a triangle pattern. Now, it is poised to form Wave 5 in the coming weeks. A conservative approach to maximize gains from Wave 5 is to enter the market at the right moment, which is when the stock starts trading above Rs. 181, marking an entry over Wave D of the triangle.
This strategy aligns with the principles of Elliott Wave Theory, where Wave 5 typically represents a final upward movement in the trend. By waiting for the stock to trade above Rs. 181, you can potentially capture the gains from this anticipated upward movement.

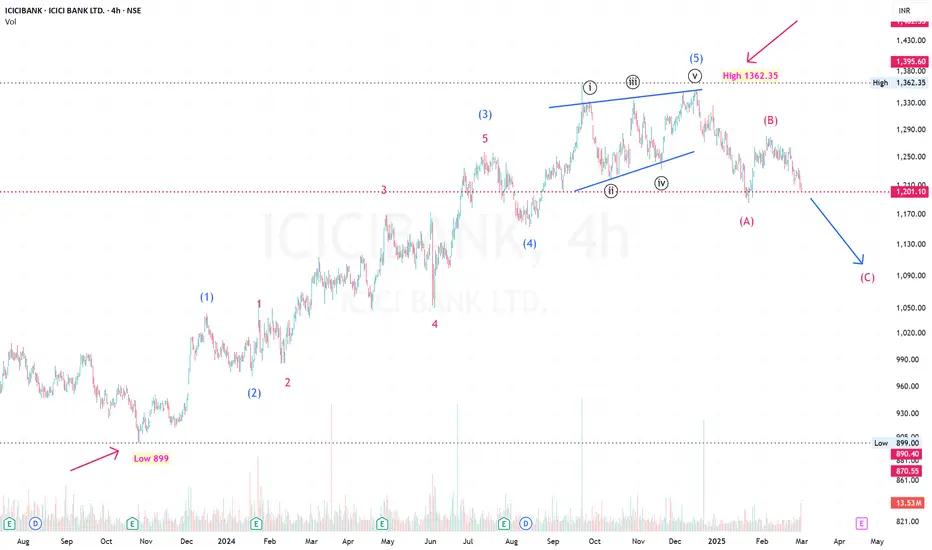
ICICI Bank forming a Potential Wave CICICI Bank began gaining momentum after its Q2 earnings for FY 23-24 in October 2023, starting from a low of Rs. 899. Over the past year, it completed an impulse wave, culminating in the 5th wave as an ending diagonal on December 17, 2024, with a high price of Rs. 1362.35, marking a rally of nearly 463 points.
Following this, ICICI Bank entered an ABC correction phase. It completed Wave A on January 23, 2025 (37 days), with a low of Rs. 1186.00, a decline of approximately 176 points. Wave B formed on February 4, 2025 (12 days), reaching a high of Rs. 1280.50, which is almost 50% of Wave A, a typical Elliott wave correction.
Currently, ICICI Bank is in the process of forming Wave C and could potentially see a low of Rs. 1100.00, targeting at least 176 points before its earnings update on April 21, 2025.
BANKNIFTY: Elliott Wave AnalysisBANKNIFTY counting using Elliott Wave theory is done from 13th January.
We can see FLART- ZIGZAG- ZIGZAG CORRECTION marked in the chart.
The top made on 6th February is marked as wave (W) because it has 3 moves in it.
The fall after that was sharp and fast. This is the characteristic of wave (X).
Now, according to my analysis price is standing on wave (B) of wave (Y).
and as per previous observations, wave (Y) always crosses the top of wave (W), so we can expect it to go up to 100% extension.
This not any buying or selling recommendation.
This analysis is based on Elliott Wave theory and Fibonacci.
For educational purpose only.

Nifty Long Term ChannelNifty has been in this channel since 1990 & we see a throw over in 2008 when extreme bullishness takes it past the channel top to only see a deep correction.
We are near to channel top again but do we have extreme sentiment on bullish side ?
No rather we have a extreme bearish sentiment so can we see a throw over again in this channel for this bull cycle started from Covid lows of March 2020.
Lets dig some numbers March 2020 Low was 7511
Oct 2021 High was 18604
Net Rise 11093 Points
June 2021 Low was 15183
Add 11093
Sept 2024 High 26277
Now we did to 2 equal rise of 11093 points 1st in 19 Months & second in 27 Months what if the low of 22786 is a major low given the extreme negative sentiment at we are adding another 11093 points from here in next 19 months.
Are we heading to 33900 by Oct 2026 ?
If Nifty closes above 25000 than second hurdle will be ATH at 26277 than we would see fast & furious bull run which could be last leg of this euphoria which gives a throw over on this long term Channel.
DISC : View shared here are for Educational purpose only i am not a SEBI registered analyst please consult your Financial advisor before taking any trades.

Tata Motors-2-Chart AnalysisTata motors CMP:786.45; RSI: 36.35;
TATAMOTORS has completed 5 wave impulsive -Primary Bull cycle phase on weekly chart basis and now in corrective of ABC wave in formation . Corrective Wave-A has bottomed out and wave-B may give a swing trade opportunity for aggressive trader . This wave-B may take the Tata Motors shares at levels of 969-980 levels.
In Long term view is still avoid and fresh entry is suggested only for swing trade.
On daily chart basis, also 5 wave structure has formed as identified in chart structure, It suggest script will now reverse as it has entered wave-a formation.
Chart structure suggest a swing trade is open. The key crucial levels are listed below
Swing Trade Target 1: 969-980; Target 2: 1000-1020.
Stop Loss : 710
✅ For more trading ideas like this, please like, share, and follow my Idea Stream ✅

MAZDOCK - Ready for the next moveThe stock has been a market favorite. Technically it has cooled down owing to the Wave analysis which every stock goes through. Overall the Stock is in Stage 2. The stock is now gearing up to give Range Breakout.
On the Fundamental side:
- Strong Long Term Fundamental Strength with an average Return on Equity (ROE) of 24.14%
- Healthy long term growth as Net Sales has grown by an annual rate of 24.97% and Operating profit at 94.40%
- Company has a low Debt to Equity ratio (avg) at 0 times
- The company has declared Positive results for the last 8 consecutive quarters
- NET SALES(9M) At Rs 8,217.50 cr has Grown at 35.18 %
- ROCE(HY) Highest at 44.63 %
- INVENTORY TURNOVER RATIO(HY) Highest at 2.19 times
- Increasing Participation by Institutional Investors. Institutional investors have increased their stake by 0.56% over the previous quarter and collectively hold 3.02% of the company.

BEML- Breakout updateBEML CMP: 4360.25; RSI: 67.40;
BEML has completed primary level ABC correction pattern. Now clear breakout above 4280 level was observed as script is sustaining above breakout level from last 3 consecutive trading sessions, representing strength in script and bottoming out signs.
Thus, fresh position in BEML can be initiated. Chart structure is strong and must be accumulated for a swing trade as per below suggested levels.
Accumulation Zone: 4300-4400
Stop Loss: 4280
Target: 4604-5052-6234
✅ FOR MORE TRADING IDEAS LIKE THIS, PLEASE LIKE, SHARE, AND FOLLOW MY IDEA STREAM ✅
