AWHCL - Clear Breakout with Volume SurgeAWHCL was forming falling wedge for the last 1 year and it now broke the resistance. Volume is huge which supports the breakout. Now the stock is retesting the resistance line before making a move up.
SL would be below 553.
This is not an investment advice
Wedgebreakout

Falling Wedge Pattern - Bullish Setup 🔎 Overview [ /b]
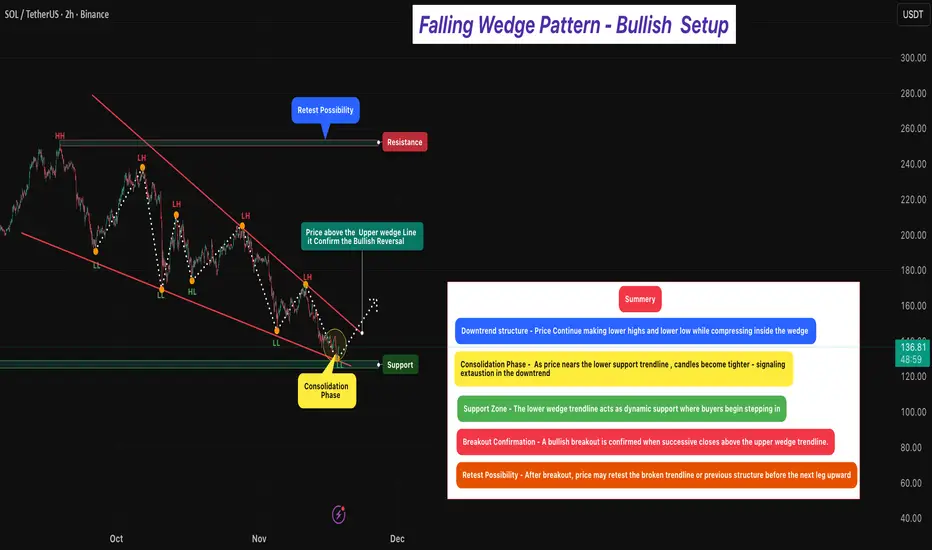
The Falling Wedge Pattern is a bullish reversal setup that forms when price trades inside a narrowing downward channel — creating lower highs and lower lows that converge toward the bottom.
It typically appears after a downtrend, signaling that selling pressure is weakening and buyers may soon regain control.
As price descends within the wedge, the slope begins to reduce and volatility tightens, indicating seller exhaustion and early buyer accumulation near support.
Momentum shifts once price breaks and closes above the upper wedge trendline, confirming a potential bullish reversal.
⸻⸻⸻⸻⸻⸻⸻⸻⸻⸻⸻
📊 Chart Explanation
1️⃣ Downtrend Structure
Price continues forming Lower Highs and Lower Lows within the wedge.
This compression reflects weakening bearish momentum.
2️⃣ Consolidation Phase
As price approaches the wedge’s lower line, candles narrow — indicating reduced volatility, seller fatigue, and early buying activity.
This is often the early reversal zone.
3️⃣ Support Zone
The lower wedge boundary overlaps with a strong structural support area — where buyers repeatedly defend the lows, forming a demand zone.
4️⃣ Breakout Confirmation
A bullish reversal is confirmed when price breaks and closes above the upper wedge line.
This signals a clear momentum shift from sellers → buyers.
5️⃣ Retest Possibility
Post-breakout, price may retest the broken wedge or prior resistance area.
A successful retest adds conviction to the continuation move.
⸻⸻⸻⸻⸻ ⸻⸻⸻⸻⸻⸻
🟩 Summary
• Pattern Type → Falling Wedge (Bullish Reversal)
A narrowing downward structure that signals seller exhaustion and early buyer accumulation.
• Bias → Bullish After Breakout Confirmation
Momentum shifts only when successive candles close firmly above the upper trendline, confirming a true breakout.
• Trend Context → Formed After a Downtrend
Makes the reversal stronger and increases the probability of upside continuation.
• Market Psychology → Sellers Losing Strength
Lower highs are losing momentum, and buyers are defending lows aggressively.
⸻⸻⸻⸻⸻⸻⸻⸻⸻⸻⸻
⚠️ Disclaimer
📘 For educational purposes only.
🙅 Not SEBI registered.
❌ Not a buy/sell recommendation.
🧠 Purely a learning resource.
📊 Not Financial Advice.
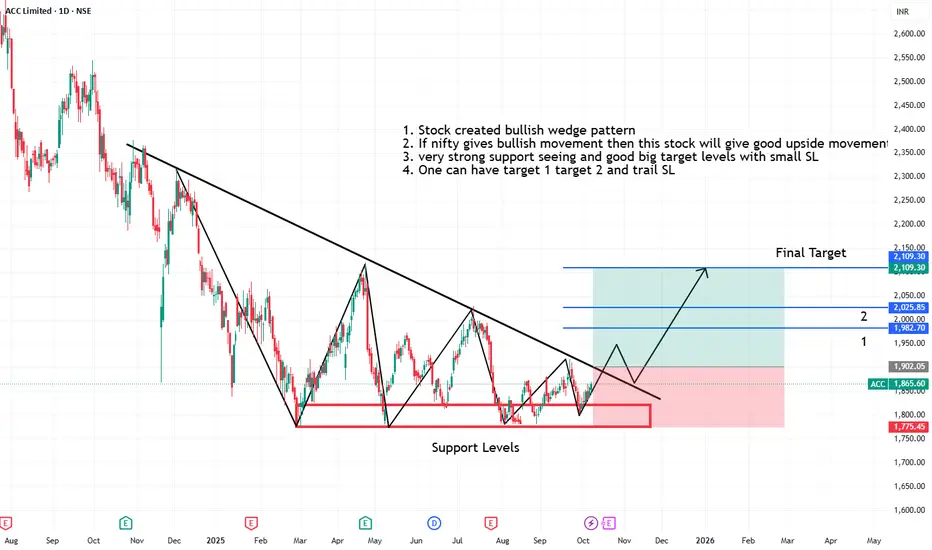
Acc creating bullish wedge pattern on strong support levels1. Stock created bullish wedge pattern
2. If nifty gives bullish movement then this stock will give good upside movements
3. very strong support seeing and good big target levels with small SL
4. One can have target 1 target 2 and trail SL
US30 – Rising Wedge on Thin Ice ! The Dow has been pushing higher for weeks, but the structure it’s building isn’t the most comfortable for bulls. Right now, price is sitting inside a rising wedge — a pattern that often looks strong until momentum fades and it breaks lower.
What’s happening now?
Buyers are still trying to defend near the top of the wedge, but every new push looks weaker than the last.
The candles are tightening, which usually signals a volatility squeeze. Once it snaps, the move tends to be quick.
Momentum hasn’t kept pace with price. That mismatch is an early warning sign.
Levels I’m watching
Target 1: 45900–46000. First line of support. If this gives way, short-term weakness will expand.
Target 2: 45200. A deeper pullback zone where profit-taking could slow the drop.
Final zone: 44200–44300. If the wedge fully unwinds, this is where I expect the sell-off to stretch, followed by a bounce attempt.
Short-term view:
For bulls, the only way to flip sentiment is a clean breakout above the wedge resistance. Until then, upside looks limited while the downside risk is gradually opening up. Chasing longs here carries more risk than reward. A confirmed break below support would tilt momentum decisively bearish. Trade safe!

A Bullish Continuation Wedge + Elliott WaveIn NSE:ZENTEC the upward movement is likely to resume.
PLEASE NOTE THAT:
This chart analysis is only for reference purpose.
This is not buying or selling recommendations.
I am not SEBI registered.
Please consult your financial advisor before taking any trade

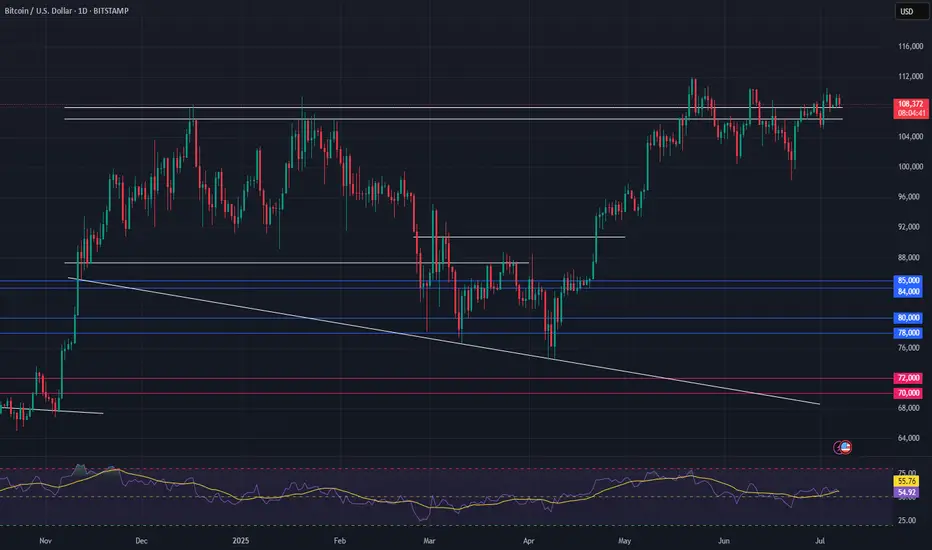
Bitcoin Eyes Breakout — Bullish Setup Gathers StrengthConsolidation Above Key Support:
Bitcoin continues to hold firmly above the $100,000–$105,000 support zone, a critical area that acted as major resistance earlier in 2025. This sustained price action reinforces the prevailing bullish momentum and signals strength beneath the surface.
Wedge Formation Nearing Resolution:
The prolonged wedge pattern now taking shape suggests a substantial move is imminent. The structure supports a breakout scenario, with an initial target of $130,000–$135,000 in play.
Uptrend Intact, No Signs of Exhaustion:
Despite recent weeks of sideways action, Bitcoin continues to consolidate near its highs—a pattern that historically favors continuation, not reversal. The broader trend remains upward and firmly intact.
Focus & Opportunity:
Bitcoin's technical setup justifies close attention in the days ahead. At the same time, traders and investors should keep an eye on select altcoins, which could offer amplified upside as capital rotation picks up momentum.
#Bitcoin #BTC #Crypto #TechnicalAnalysis #BullishSetup #WedgeBreakout #PriceAction #Altcoins #CryptoMarket #MarketUpdate #AllTimeHigh
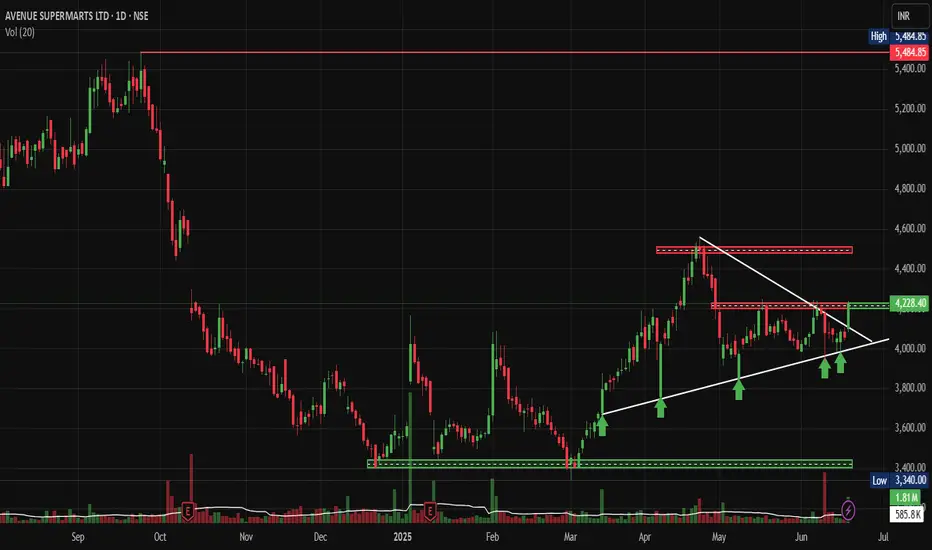
DMART: Technical Breakout Signals Major Rally AheadNSE:DMART Technical Breakout Signals Major Rally Ahead after news of its Entry in Uttar Pradesh as the First Store Opened in Agra.
Price Action:
• Current Price: ₹4,228.40 (up 4.17% or ₹169.30)
• 52-Week Range: ₹3,340 (Low) to ₹5,484.85 (High)
• Stock is trading in the upper half of its annual range, showing strong momentum
• Recent price action indicates a successful breakout from the consolidation phase
Volume Spread Analysis:
• Volume spike visible during recent breakout sessions
• Above-average volume of 585.8K shares traded, confirming institutional participation
• Volume pattern supports the bullish price movement
• Higher volume on green candles indicates genuine buying interest
Key Technical Levels:
Support Levels:
• Primary Support: ₹4,100-4,150 (recent breakout level)
• Secondary Support: ₹3,900-3,950 (previous resistance turned support)
• Major Support: ₹3,600-3,700 (demand zone from March-April consolidation)
• Critical Support: ₹3,400-3,450 (psychological level and volume-based support)
Resistance Levels:
• Immediate Resistance: ₹4,400-4,450 (supply zone marked on chart)
• Major Resistance: ₹4,600-4,700 (previous swing high area)
• Target Resistance: ₹5,200-5,300 (approaching 52-week high zone)
• Ultimate Target: ₹5,484 (52-week high)
Base Formation:
• Stock formed a strong accumulation base between December 2024 and April 2025
• Base depth: Approximately 25-30% from peak to trough
• Duration: A 5-month consolidation period indicates institutional accumulation
• Base breakout occurred with strong volume confirmation in May 2025
Technical Patterns:
• Cup and Handle formation visible from October 2024 to May 2025
• Ascending triangle pattern during the consolidation phase
• Higher lows formation indicating strong underlying demand
• Breakout from falling wedge pattern in early May 2025
Trend Analysis:
• Primary Trend: Bullish (upward sloping trendline from December lows)
• Intermediate Trend: Bullish breakout from consolidation
• Short-term Trend: Strong upward momentum with minor pullback potential
Trade Setup:
Bull Case Scenario:
• Entry Strategy: Buy on dips approach recommended
• Momentum continues toward ₹4,600-4,800 levels
• Volume expansion supports further upside
• Sector rotation favouring retail stocks
Entry Levels:
• Aggressive Entry: ₹4,200-4,250 (current market price area)
• Conservative Entry: ₹4,050-4,100 (on pullback to support)
• Ideal Entry: ₹4,000-4,050 (strong support retest)
Exit Levels:
• Partial Profit Booking: ₹4,500-4,600 (book 30-40% position)
• Second Target: ₹4,800-4,900 (book another 30-40%)
• Final Target: ₹5,200-5,300 (ride remaining 20-30% position)
Stop-Loss Strategy:
• Initial Stop-Loss: ₹3,950 (below recent support)
• Trailing Stop-Loss: Trail stops by ₹150-200 as price advances
• Final Stop-Loss: ₹3,800 (if major support breaks)
Risk Management:
Position Sizing:
• Conservative Allocation: 2-3% of total portfolio
• Moderate Allocation: 3-5% of total portfolio
• Aggressive Allocation: 5-7% of total portfolio (only for high-conviction traders)
Risk Factors:
• Market volatility during the quarterly results season
• Retail sector sensitivity to economic cycles
• High valuations may limit upside potential
• Profit booking pressure near previous highs
Risk Mitigation:
• Diversify across multiple retail stocks
• Use a staggered entry approach
• Maintain strict stop-loss discipline
• Monitor sector rotation trends
Sectoral Backdrop:
Retail Sector Overview:
• The Indian retail sector is following the "Everyday Low Cost - Everyday Low Price" strategy
• Strong, organised retail penetration growth expected
• Consumer spending recovery supporting sector growth
• E-commerce competition intensifying, but offline retail remains resilient
Sector Catalysts:
• Festival season approaching (positive for retail)
• Rural consumption recovery expected
• Urban consumption remains steady
• Government policies supporting organised retail
Fundamental Backdrop:
Company Overview:
• Avenue Supermarts follows a competitive procurement, operational efficiency, and cost-effective distribution strategy
• Market Cap: ₹2,75,237 Crores with almost debt-free status
• Leading hypermarket chain with strong brand presence
Financial Performance:
• Q4 FY25: Sales of ₹14,872 crore (16.9% YoY growth)
• Revenue projected to grow 15% to ₹68,000 to ₹70,000 crore
Business Strengths:
• Strong operational efficiency and supply chain management
• Consistent store expansion strategy
• High customer loyalty and repeat business
• Strong cash generation and a debt-free balance sheet
Growth Drivers:
• New store openings in Tier-2 and Tier-3 cities
• Same-store sales growth improvement
• Category expansion and private label growth
• Digital initiatives and omnichannel presence
My Take:
NSE:DMART presents a compelling technical setup with strong fundamental backing. The stock has successfully broken out from a 5-month consolidation base with volume confirmation. Risk-reward ratio favours bulls with proper position sizing and stop-loss management. Traders should consider entering on minor pullbacks, while investors can accumulate on any meaningful corrections toward support levels.
Keep in the Watchlist.
NO RECO. For Buy/Sell.
📌Thank you for exploring my idea! I hope you found it valuable.
🙏FOLLOW for more
👍BOOST if you found it useful.
✍️COMMENT below with your views.
Meanwhile, check out my other stock ideas on the right side until this trade is activated. I would love your feedback.
Disclaimer: "I am not a SEBI REGISTERED RESEARCH ANALYST AND INVESTMENT ADVISER."
This analysis is intended solely for informational and educational purposes and should not be interpreted as financial advice. It is advisable to consult a qualified financial advisor or conduct thorough research before making investment decisions.
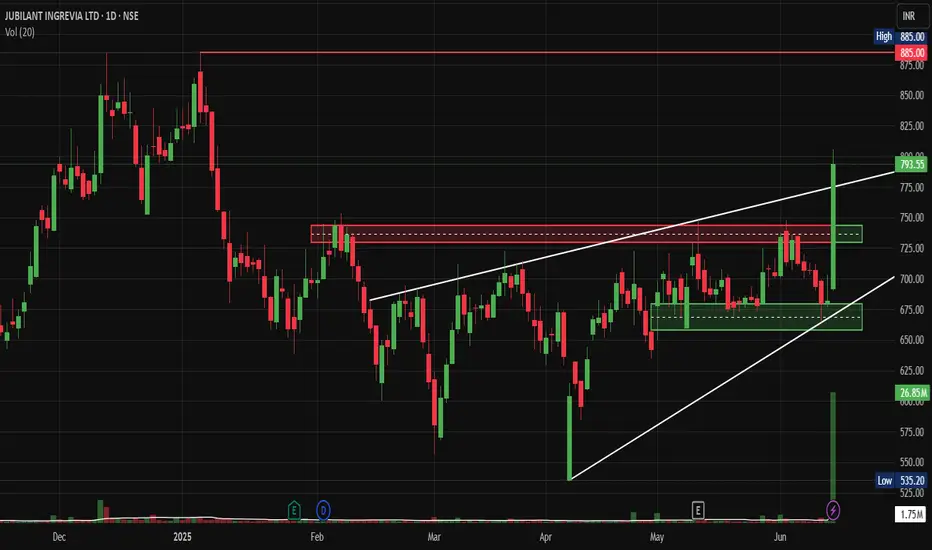
Jubilant Ingrevia: Broke Out after Stake Sell from PromotersNSE:JUBLINGREA Just Broke Out Big after Prabhudas Lilladher gave Hold Rating with a target of Rs 713 and Stake Sell from Promoters
Technical Chart Pattern:
• The stock displays a classic ascending triangle pattern formation spanning from February to June 2025
• Multiple higher lows connected by an ascending trend line (white diagonal support)
• Horizontal resistance zone around ₹735-740 levels acting as the upper boundary
• Recent breakout above the triangle pattern with strong volume confirmation
Key Support and Resistance Levels:
• Primary Support: ₹675-685 (previous resistance turned support)
• Secondary Support: ₹650-660 (trend line support)
• Major Support: ₹535-550 (swing low from March)
• Immediate Resistance: ₹800-810 (psychological level)
• Major Resistance: ₹885 (all-time high marked on chart)
Base Formation Analysis:
• Well-defined base formation between ₹650-740 levels over 4 months
• The consolidation phase showed declining volatility, indicating accumulation
• Multiple tests of resistance at ₹735-740 showing supply absorption
• Base depth of approximately 15-20% from the highs, indicating healthy correction.
Volume Spread Analysis:
Volume Characteristics:
• Significant volume spike during the recent breakout (26.85M vs average 1.75M)
• Volume expansion during upward moves and contraction during pullbacks
• Strong institutional participation is evident from the volume profile
• Volume-price correlation remains positive, supporting the uptrend
Volume Indicators:
• Above-average volume during breakout confirms genuine demand
• Recent sessions show sustained higher volumes, indicating continued interest
• No distribution patterns are visible in volume analysis
Trade Setup:
Entry Strategy:
• Primary Entry: ₹790-800 on any pullback to the breakout zone
• Aggressive Entry: Current market price around ₹799 with tight stops
• Conservative Entry: Wait for retest of ₹740-750 resistance-turned-support
• Scale-in approach recommended given the momentum
Exit Levels:
• Target 1: ₹850 (measuring the triangle height projection)
• Target 2: ₹885 (previous all-time high)
• Target 3: ₹920-950 (extended projection based on base depth)
• Trail stops above ₹850 for position management
Stop Loss Placement:
• Initial Stop Loss: ₹735 (below breakout level)
• Revised Stop Loss: ₹750 (after first target achievement)
• Final Stop Loss: ₹780 (trailing stop for remaining position)
Risk Management Framework:
Position Sizing Guidelines:
• Risk 1-2% of portfolio capital per trade
• Position size calculation: (Account Size × Risk %) ÷ (Entry Price - Stop Loss)
• Maximum position should not exceed 3-5% of the total portfolio
• Consider reducing the size given recent volatility expansion
Risk Control Measures:
• Maintain risk-reward ratio of a minimum of 1:2
• Use partial profit booking at predetermined levels
• Avoid averaging down below stop loss levels
• Monitor sector rotation and market sentiment
Fundamental and Sectoral Backdrop:
Company Overview:
• Jubilant Ingrevia operates in Speciality Chemicals, Nutrition and Health Solutions, and Chemical Intermediates segments
• Global provider serving pharmaceutical, nutrition, agrochemical, and consumer industries with a focus on quality and customization
• Serves 15 of the top 20 Global Pharma & 7 of the top 10 Global Agrochemical companies as a leading low-cost provider
Recent Financial Performance:
• Net profit jumped 153.16% year-over-year to ₹74.05 Cr in Q4 2024-2025
• Q4 2025 revenue of 1,051 cr. down from INR1,074 cr. in Q4 FY24 with EBITDA of INR148 crores showing 42% year-on-year rise
• Market capitalization of 12,664 Cr. with trailing twelve-month revenue of 4,178 Cr.
Sectoral Dynamics:
• The speciality chemicals sector is benefiting from the China+1 strategy
• Increasing demand for pharmaceutical intermediates post-COVID
• The government push for self-reliance in chemical manufacturing
• Export opportunities in agrochemical intermediates are expanding globally
Key Fundamentals:
• The company shows a low return on equity of 9.24% over the last 3 years
• Analyst average share price target of ₹735
• Strong client base with global pharmaceutical and agrochemical giants
• Diversified product portfolio, reducing concentration risk
Market Outlook and Catalysts:
Positive Catalysts:
• Expansion in speciality chemicals capacity
• New product launches in the nutrition segment
• Increasing penetration in international markets
• Potential margin expansion through product mix improvement
Risk Factors:
• Raw material price volatility
• Regulatory changes in target markets
• Currency fluctuation impact on exports
• Competition from Chinese manufacturers
My Take:
This technical setup presents a compelling opportunity with the stock breaking out of a well-defined pattern, supported by strong fundamentals and favourable sector dynamics. The risk-reward profile appears attractive for traders and investors willing to manage position size appropriately.
Keep in the Watchlist.
NO RECO. For Buy/Sell.
📌Thank you for exploring my idea! I hope you found it valuable.
🙏FOLLOW for more
👍BOOST if you found it useful.
✍️COMMENT below with your views.
Meanwhile, check out my other stock ideas on the right side until this trade is activated. I would love your feedback.
Disclaimer: "I am not a SEBI REGISTERED RESEARCH ANALYST AND INVESTMENT ADVISER."
This analysis is intended solely for informational and educational purposes and should not be interpreted as financial advice. It is advisable to consult a qualified financial advisor or conduct thorough research before making investment decisions.
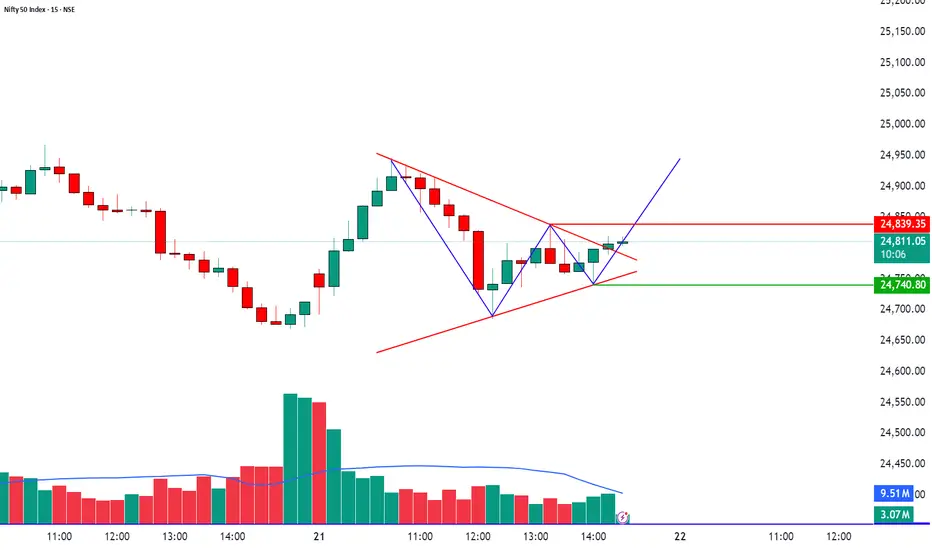
Breakout Building Up from Falling Wedge PatternIndex: Nifty 50
Timeframe: 15-minute
Date: 21st May 2025
Price Action Insight
After a strong sell-off, NIFTY 50 formed a solid V-shaped recovery, followed by a series of higher lows, indicating a shift in momentum from sellers to buyers. Price is now consolidating near a key resistance level at 24,839.35, suggesting a potential breakout or rejection setup.
Chart Patterns in Focus
Falling Wedge (Bullish Reversal)
Breakout occurred after price compressed into the wedge.
A textbook reversal pattern signaling buying interest returning.
Bullish Flag / Pennant Formation
Post-wedge breakout, price is consolidating in a narrow range (flag).
Typically seen as a continuation pattern before another bullish leg.
Trendline Support
Price is holding above an ascending trendline, forming higher lows, reinforcing bullish bias.
Volume Analysis
Volume spiked during the wedge breakout – confirming buyer participation.
Current consolidation shows declining volume, indicating a possible volume expansion ahead.
Watch for a volume surge during breakout or breakdown for trade confirmation.
Educational Insight: How to Read This Setup
Why this matters for traders:
A falling wedge + bullish flag is a high-conviction combo.
Volume contraction during consolidation is healthy and often precedes explosive moves.
Price rejecting or sustaining above resistance gives traders directional edge.
Always wait for confirmation with price action + volume to avoid fakeouts.
Trade Scenarios
✅ Bullish Scenario (Long Trade)
Entry: Above 24,839.35
Target Zones: 24,900 / 24,950
Stop-Loss: Below 24,740.80 (below consolidation and trendline support)
Confirmation: Breakout candle with above-average volume
❌ Bearish Scenario (Short Trade)
Entry: Below 24,740.80
Target Zones: 24,650 / 24,580
Stop-Loss: Above 24,839.35
Confirmation: Breakdown from trendline support + rise in selling volume
Shriram Pistons - Wedge BO NSE:SHRIPISTON Made Beautiful Chart Structure today after Q4 Results with Good Price and Volume action.
Wedge Breakout Pattern History:
The chart displays a remarkable track record of successful wedge breakout patterns, which has become a defining characteristic of this stock's technical behaviour:
Past Wedge Breakout Sequence:
First Wedge (2022-2023): Initial falling wedge formation around the ₹550-700 range, which broke out to the upside and catalysed a strong rally.
Second Wedge (Mid-2023): Formed after the first major run-up at the ₹1,000-1,200 level. This wedge breakout propelled the stock toward the ₹1,600 level.
Third Wedge (Early 2024): A more compact wedge pattern around ₹1,800-2,000 that triggered another significant upward move.
Fourth Wedge (Recent): The latest wedge formation, which has just broken out with today's massive 14% price surge.
Pattern Reliability:
What makes this technical setup particularly compelling is the consistency of these wedge patterns:
Each wedge has followed a similar compression pattern
All previous breakouts have led to substantial price advances
The patterns have maintained their predictive validity across different market cycles
The breakouts have consistently occurred on higher-than-average volume (implied by the large price bars)
Current Breakout Analysis:
Today's 14% surge represents a powerful breakout from the most recent wedge pattern:
The breakout has occurred with exceptional momentum (nearly 20% gain on a weekly TF)
The price action has cleared both the upper trendline resistance and previous swing highs
The stock is now approaching its all-time high of ₹2,399.00
Price Structure & Technicals:
Beyond the wedge patterns, the stock shows several positive technical characteristics:
Consistent stair-step pattern of higher lows and higher highs
Each consolidation period (wedge) has been followed by robust expansion
Primary trend remains strongly bullish with price well above major moving averages (implied)
Each breakout has established a new support level at the previous resistance
Projection Based on Historical Pattern:
Given the stock's history of successful wedge breakouts:
The measured move projection from this breakout suggests a potential target in the ₹2,400-2,600 range
The stock could reach new all-time highs if the pattern's reliability continues
Previous breakouts have generally resulted in 20-30% moves from the breakout point
Key Levels to Watch
Immediate Resistance: ₹2,399.00 (all-time high)
Support: ₹1,950-2,000 (previous wedge upper boundary, now potential support)
Secondary Support: ₹1,800 (previous consolidation level)
Conclusion:
Shriram Pistons & Rings demonstrates a remarkably consistent pattern of wedge breakouts that have reliably preceded significant price advances. Today's powerful breakout continues this technical signature, suggesting the potential for further upside if historical pattern reliability maintains.
Keep in the Watchlist.
NO RECO. For Buy/Sell.
📌Thank you for exploring my idea! I hope you found it valuable.
🙏FLLOW for more
👍BOOST if useful
✍️COMMENT below with your views.
Meanwhile, check out my other stock ideas on the right side until this trade is activated. I would love your feedback.
Disclaimer: "I am not SEBI REGISTERED RESEARCH ANALYST AND INVESTMENT ADVISER."
This analysis is intended solely for informational and educational purposes and should not be interpreted as financial advice. It is advisable to consult a qualified financial advisor or conduct thorough research before making investment decisions.

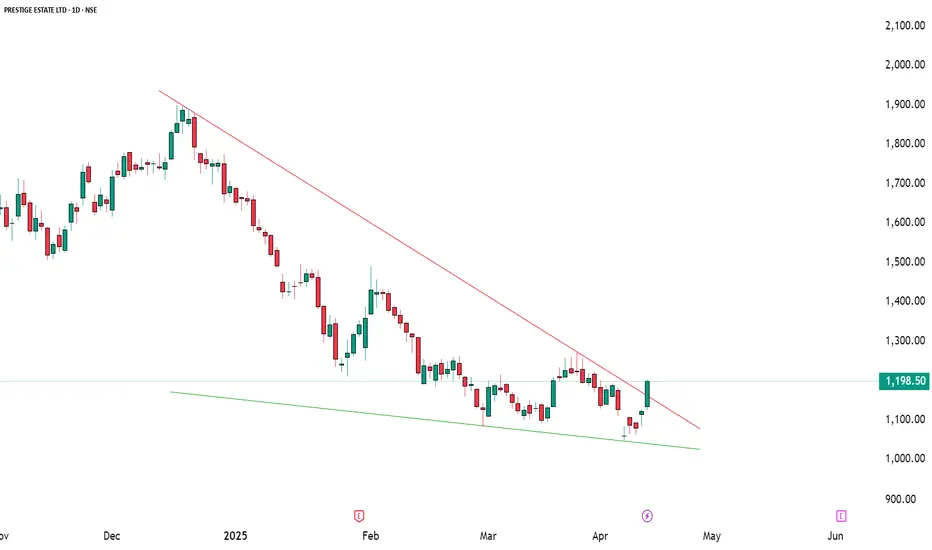
Prestige Estate – Bullish Structure DevelopingPrestige Estate – Bullish Structure Developing After Prolonged Correction
📅 Date: April 16, 2025
📈 Chart Type: Daily | Exchange: NSE
💡 Purpose: Educational Analysis
🔍 Price Action Overview
After an extended downtrend, Prestige Estate appears to be forming a potential trend reversal structure. A strong bullish candle has emerged from a key support zone, accompanied by multiple technical confirmations that indicate renewed buying interest.
📌 Key Technical Highlights
📉 Downtrend Line Break: The stock has convincingly broken above a descending trendline, indicating a potential shift in trend dynamics.
📊 Indicators Triggered:
✅ RSI Breakout: Momentum is turning positive.
✅ MACD Crossover: Bullish signal crossover observed.
✅ Bollinger Band Squeeze Off: Suggests upcoming volatility with a directional move.
📍 Volume Surge: A notable spike in volume supports the strength of the breakout candle.
🧱 Support and Resistance Zones
🟢 Support Levels:
S1: ₹1148
S2: ₹1098
S3: ₹1071
Broad Support Zone: ₹1000–1050 (marked as Weak Support)
🔴 Resistance Levels:
R1: ₹1272 (Pattern Entry Level)
R2: ₹1252
R3: ₹1302
Major Resistance: ₹1900–2000 (Long-term supply zone)
🔄 Entry Reference Levels (For Educational Illustration Only)
✳️ Early Entry Reference: Above ₹1203
A close above ₹1203 indicates sustained strength and potential continuation.
🧩 Pattern Breakout Entry Reference: Above ₹1272
A breakout above ₹1272 could confirm a larger reversal pattern with room to test higher resistance levels.
⚠️ Important Disclaimer
This analysis is strictly for educational purposes and aims to help readers understand price structure, support/resistance zones, and indicator alignment. It does not constitute investment advice or a buy/sell recommendation. Always consult a registered financial advisor before making any investment decisions. Market participation involves risk and capital protection should be a priority.
📘 Conclusion
Prestige Estate is currently at a critical juncture where momentum indicators, volume, and price action are aligning for a potential upside continuation. Close monitoring of key breakout levels and market conditions will be crucial for informed decision making.
🔔 Let us know your thoughts in the comments – Do you see strength sustaining above ₹1203?
📊 Poll: Will Prestige Estate reclaim ₹1300 in the coming weeks?
Garden Reach Shipbuilders (GRSE) Bullish Inv HnS BO with volumeThanks for sharing the chart of **Garden Reach Shipbuilders (GRSE)**.
Strong **bullish setup** supported by two technical patterns:
1. **Falling Wedge Pattern (Breakout)** – A classic bullish reversal pattern, and it has broken out with strong volume.
2. **Inverted Head and Shoulders** – Another bullish reversal formation that also broke out around ₹1,730–₹1,750 zone, confirmed with high volume.
### Key Highlights:
- **Breakout Confirmation**: Price closed at ₹1,957.80, up **+11.90%**, with strong volume (17.64M).
- **Targets**: Based on pattern projections, potential target zones are:
- ₹2,354.10 (Inverted H&S breakout)
- ₹2,833.80 (Falling wedge pattern breakout)
- **Support Zone**: ₹1,730 acts as a strong support now (previous resistance).
This confluence of two bullish patterns with a volume spike significantly increases the probability of continued upward momentum.

Watch This Wedge! AUDNZD Primed for Upside PushThe AUDNZD pair forms a falling wedge pattern, a bullish reversal formation that typically occurs after a downtrend. The price action is being squeezed between a descending resistance line and a descending support line, creating a narrowing range. The market is now attempting to break out of the wedge, with the current price testing the resistance line. A breakout and close above this trendline would signal bullish strength and could lead to a reversal of the recent downtrend.
Targets:
TP1: 1.07605
TP2: 1.07922
Stop Loss: Below the recent low at 1.06542

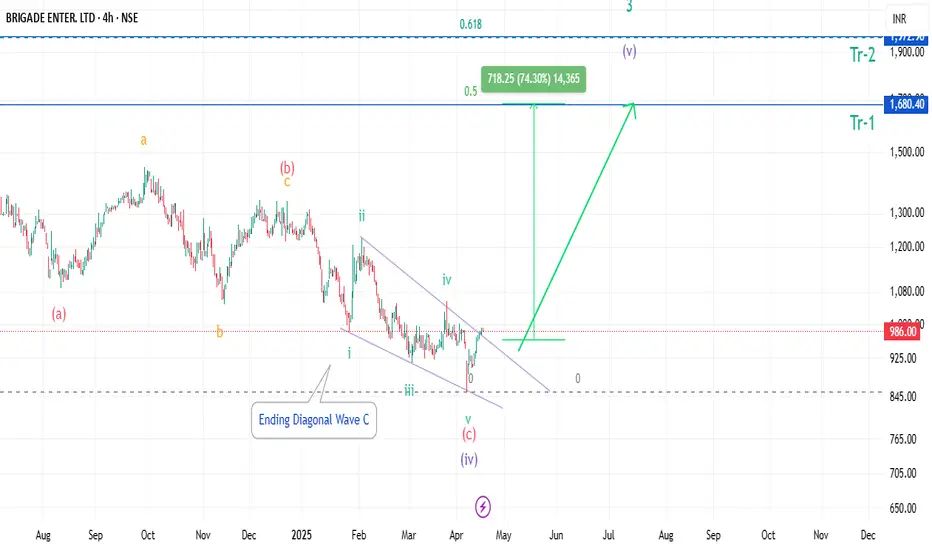
Brigade Ent falling wedge Breakout.Brigade Enterprises has made a falling wedge or ending Diagonal pattern, its near breakout. As per Elliott wave the Correction looks Complete, good for short-term Buy,
This Idea is shared purely on Technical basis,
Fundamental parameters are not considered,
take entry on your own risk.
RAMAPHO - Breakout TradeView : Bullish
Entry Zone- 240- 200 (Trend line breakout falling wedge)
Exit Zone - Based on Trader mindset. Exit 1 - 270
Exit 2- 307
Exit 3 - 350
Stoploss : Close below 190
Trading Edge: Price action and CPR
Timeframe: Daily and Weekly
Notes: Trendline breakout of falling wedge pattern. Price consolidates since Feb 2023.

BALKRISIND - Breakout in Falling WedgeView : Bullish
Entry Zone- 2860- 2800 (Trend line breakout)
Exit Zone - Based on Trader mindset. Exit 1 - 2935
Exit 2- 3050
Exit 3 - 3300
Stoploss : Close below 2750
Timeframe: Daily
Notes: Trednline break out the Falling wedge pattern. Price consolidates since May 2024.

ANANTRAJ - Breakout Trade View : Bullish
Entry Zone- 750-725
Exit Zone - Based on Trader mindset. Exit 1 - 770
Exit 2- 785
Stoploss : Close below 720
Timeframe: Daily
Notes: Breakout of Wedge pattern which is consolidate since September 2024.
* This is not a trading recommendation, for educational purposes only

DYNAMATECH - Triangle Breakout and RetestView : Bullish
Entry Zone- 8221- 7400
Exit Zone - Based on Trader mindset. Exit 1 - 9000
Exit 2- 9400
Stoploss : Close below 7350
Timeframe: Weekly and Daily
Notes: Price consolidate since Feb 2024 and it forms wedge pattern. Not it breakout of the same and retest the resistance line. We can wait to enter until it form good green candle near black trend line.
* This is not a trading recommendation, for educational purposes only

BAJAJHCARE - Breakout Wedge PatternView : Bullish
Entry Zone- 435- 420 (Trend line break inside Broadening wedge)
Exit Zone - 500 - 510 Range or while price touch upper resistance line (marked in red)
Stoploss : Close below 380
Risk/Reward Ratio: 1:1.50
Timeframe: Daily and Weekly
Notes: Trendline break inside the broadening wedge pattern. Price consolidates since Nov 2021.
* This is not a trading recommendation, for educational purposes only

PETRONET - Breakout in Falling WedgeEntry Zone- 342-332 (Trend line break of wedge)
Exit Zone - Based on Trader mindset. Exit 1 - 365
Exit 2- 385
Stoploss : Close below 326
Timeframe: Daily
Notes: Price consolidates since July 2024 and forming wedge pattern. Price breakout the wedge with good green candle on 11 December.

Ask Auto. Watch for a Breakout.Stock is aiming for a breakout. Trading right below a resistance. Watch out for a breakout for long opportunities.

Perfect Time for a Long Entry.Natco Pharma has clearly turned it's way now, after a fall of more than 20% from it's ATH, is has shown some good reversal confirmations, first being it has take rejection form Fibonacci 0.5 level as well as From it's Important Support Zone, Second being formation of two Bullish Chart Pattern i.e. Inverted Head & Shoulders and Falling Wedge pattern and it has given breakout of these pattern too. There are higher probabilities of it going towards a New ATH.

MOREPENLAB - Breakout in DaytimeframeStock price consolidate since September 2024 and it breakout the wedge pattern today.
