Bajaj Health care falling wedge pattern.Price Action: A "weapon candle breakout" is evident, with the price testing 497.60 INR, supported by a "huge volume" spike, indicating strong bullish momentum.
Pattern: A falling wedge pattern is noted, typically bullish, with the breakout suggesting a potential upward trend.
Targets and Support:
As per chart any dip up to 458 is buying opportunity for Price targets are set at 646 INR (TG1) and 784 INR (TG2).
Indicators:
RSI (14, close) at 67.72 nears overbought levels.
MACD shows a bullish crossover.
ADX is in momentum (above 25) with +DI above -DI, confirming trend strength.
Like and support.
Wedge

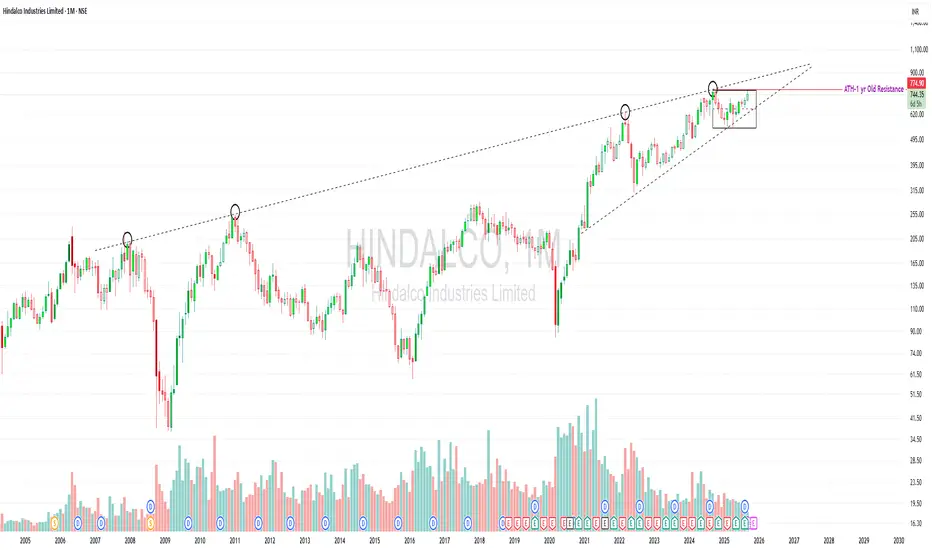
Hindalco – Monthly Chart | Educational View
Near ATH, testing a 20-year trendline — worth studying.
Price is trading inside a long-term rising wedge.
The upper trendline has acted as resistance multiple times (2007, 2011, 2022, and now).
Currently consolidating in a tight range near ATH (~₹775).
Volume needs improvement — a decisive breakout above resistance should ideally come with strong volume confirmation.
⚠️ Risks / Watch-outs:
Rising wedge patterns can also resolve downwards if breakout fails.
Repeated rejections from the same long-term trendline may trigger profit-taking.
Without big volume, any breakout attempt may not sustain.
💡 Learning Point: Long-term trendlines and volume behavior are crucial in studying potential breakouts vs. failed attempts.
⚠️ Disclaimer: This post is for educational purposes only. It is not a buy/sell recommendation or financial advice. Please do your own research or consult a SEBI-registered advisor before making investment decisions.
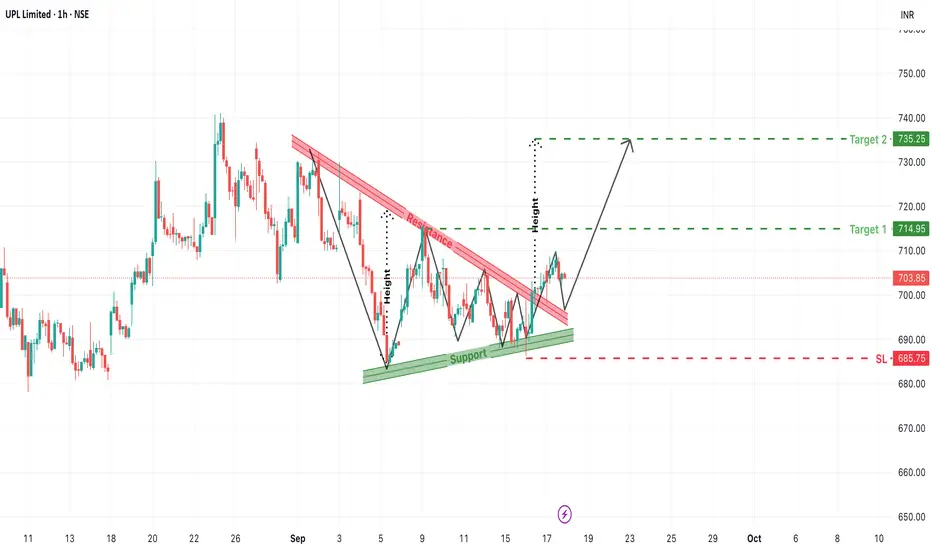
UPL Breakout from Falling Wedge: Bullish Continuation Ahead?The chart for UPL Limited (1-Hour, NSE) presents a promising bullish breakout scenario, emerging from a well-defined falling wedge (descending channel). Traders and investors watching for breakout opportunities will want to monitor this move closely as the price breaks above resistance with potential to test higher levels.
1. Chart Pattern Formation: Falling Wedge with Bullish Implication
Over the past several trading sessions, UPL consolidated inside a downward sloping wedge pattern characterized by:
- Lower highs and lower lows, creating a narrowing channel.
- The support trendline consistently held the price near 685–690 levels.
- The resistance zone, marked with a red trendline, was tested multiple times before finally breaking out.
- This kind of pattern often precedes a trend reversal or continuation to the upside, especially when it forms after a prior bullish move.
2. Breakout Confirmation: Clean Move Above Resistance
- Price has broken out of the descending resistance, closing above ₹703+.
- This breakout came with a retest of the support and is now showing signs of resuming upward momentum.
- The price structure now signals the end of the downtrend inside the wedge and potential bullish continuation.
3. Target Projections Using Pattern Height
The measured height of the wedge pattern provides us with two price targets:
- Target 1: ₹714.95
The first logical resistance and Fibonacci extension zone.
- Target 2: ₹735.25
Based on full height projection of the wedge breakout.
These targets are calculated from the breakout level and are aligned with historical price action levels.
4. Stop Loss and Risk Management
- Suggested Stop Loss (SL): ₹685.75
Just below the support zone and wedge structure to avoid false breakouts.
- Entry Zone:
Around current levels of ₹703–704 or on dips near ₹700–701 if retest occurs.
- Risk-Reward Ratio:
Around 1:2.5 for T2, offering good upside with controlled risk.
5. Key Technical Takeaways
- Pattern: Falling Wedge (Bullish Reversal/Continuation)
- Breakout Zone: ₹703+
- Support Zone: ₹685–688
- Momentum Bias: Bullish (as long as price holds above support)
- Risk Zone: Below ₹685
- Reward Zone: ₹715 to ₹735
Conclusion: UPL Gearing Up for a Short-Term Rally
UPL has triggered a classic technical breakout from a falling wedge, backed by a retest and bounce from support. As long as price sustains above ₹685, bulls may drive the stock toward the upper targets of ₹715 and ₹735. The chart offers a low-risk, high-reward setup ideal for short-term swing traders.
BANKNIFTY: POSSIBILITY OF RISING WEDGE BREAK DOWN• BN have formed a lower low on higher time timeframe
• There are multiple fundamental good news (GST + Strong global market) hits the market, but the upside is limited
• A clear rising wedge has formed in BN in lower timeframe
• Market is halted near day candle EMA 21.
• Any breakdown of wedge in hour candle could trigger a massive down move.
• T1 : 53500 and T2: 52086
• T1 is tested multiple time hence the support is weak and chance of breakdown of T1 is extremely high.
• Opportunity to short below bottom trendline of the wedge at closer of 1 hour candle below 54656 keeping sl above the candle.
• A possible 1: 9.1 RR.
• Educational purpose only. Enjoy the market.

Bearish Signal at BreakoutThe AUDCAD is on strong Buy side since the start of this month. Enough to be in overbought area.
The Channel / Rising wedge is confirming its strong buy on H1 timeframe.
Now we are waiting for the breakout of this Rising Wedge. Yet we will not trade unless it doesn't break its Lower High at 0.9140 which will be the start of our Bearish Trend on H1 time frame. the first target is 0.9080 and 2nd Target is at 0.9026 .
I already placed two trades, 1 aiming for target 1 and 2nd aiming for target two. Remember, not to forget to move the SL to Break even after target 1 hits.
what about H4 time frame?
Well, the above analysis on H1 timeframe may pave the way to break the 0.9102 level which comes in between our Entry and Target 1. If it breaks then we must be sure for our target 2 while trading with 0 risk after moving down our SL to Break even if target 1 hits.

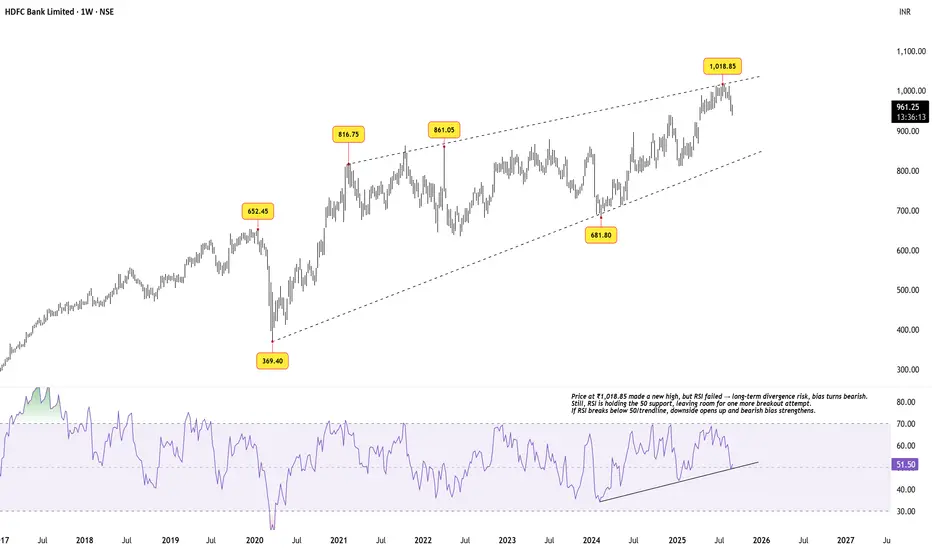
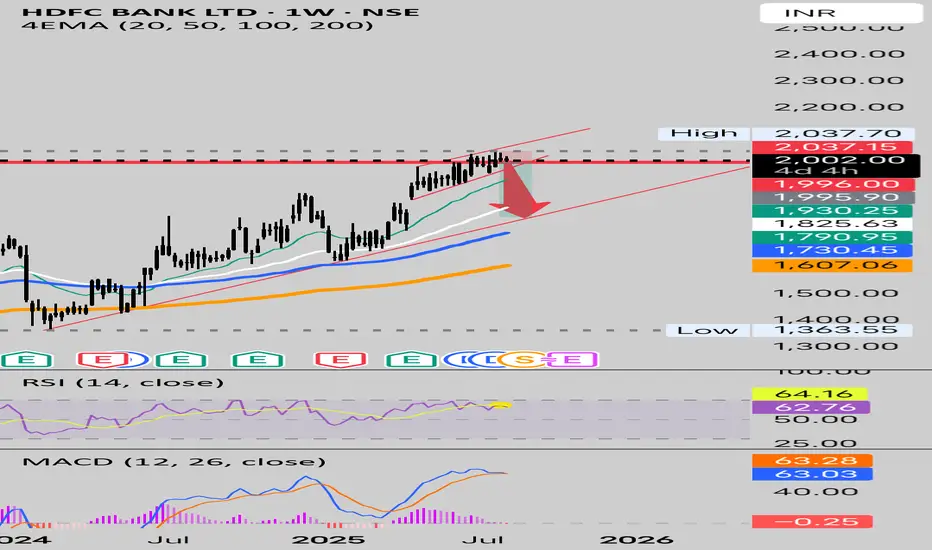
HDFC Bank – Rising Megaphone & RSI DivergencePrice structure since 2020 has unfolded inside a broadening rising channel (megaphone type). The latest high at ₹1,018.85 came right at the upper boundary.
Price action: A fresh high was made, but momentum did not confirm.
RSI: Long-term bearish divergence is visible – each new price high comes with weaker RSI peaks. Still, RSI is holding above the 50 zone and its rising trendline.
Implications:
If RSI holds above 50, bulls may attempt another breakout above ₹1,018.85.
If RSI breaks below 50 and the trendline, the bearish divergence will likely play out with price sliding toward the lower boundary near ₹820–850.
This makes the current zone a make-or-break region for HDFC Bank.
Disclaimer: This analysis is for educational purposes only and does not constitute investment advice. Please do your own research (DYOR) before making any trading decisions.
Nifty - Weekly Review Sep 1 to Sep 5Price action has formed a falling wedge pattern in Nifty. The falling wedge pattern is bullish, and sustaining a price above 24500 is crucial. The zone 24400 to 24500 will act as a choppy zone.
Buy above 24520 with the stop loss of 24460 for the targets 24560, 24620, 24680, 24720, and 24760.
Sell below 24380 with the stop loss of 24430 for the targets 24340, 24280, 24220, 24160, 24120, and 24080.
The main trend is bearish, and the minor trend is bullish unless bulls show their strength.
Always do your analysis before taking any trade.

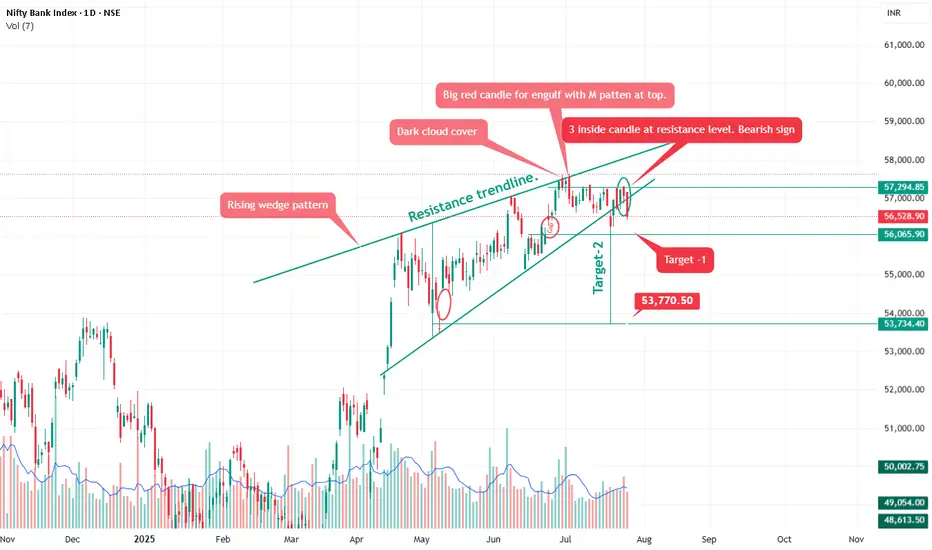
Bank nifty Rising wedge pattern.Pattern Analysis
Rising Wedge Pattern:
A bearish pattern typically seen near tops. It shows narrowing price movement with higher highs but declining momentum.
Breakdown confirmed as price has fallen below the lower wedge support trendline.
Confirms selling pressure and rejection from the top near 57,300–57,500 zone.
🕯️ Candlestick Signals
Dark Cloud Cover:
A bearish reversal pattern indicating sellers have taken control after a bullish phase.
Big Red Candle + ‘M’ Pattern:
Bearish engulfing at resistance – strong indication of a top formation.
3 Inside Down Candlestick Pattern at Resistance:
Recent red candles have higher volume, confirming institutional selling activity.
As anticipated in our previous analysis, Bank Nifty corrected from the 57,000 level to 56,056, validating the bearish setup.
It is also expected to short here 56,550 add on any rise up to 57,700-57,950 for target mentioned on chart.
Alternative Scenario: Be aware that the rising wedge could potentially break upwards. If the price breaks decisively above the resistance trendline with strong volume, the bearish outlook would be invalidated.
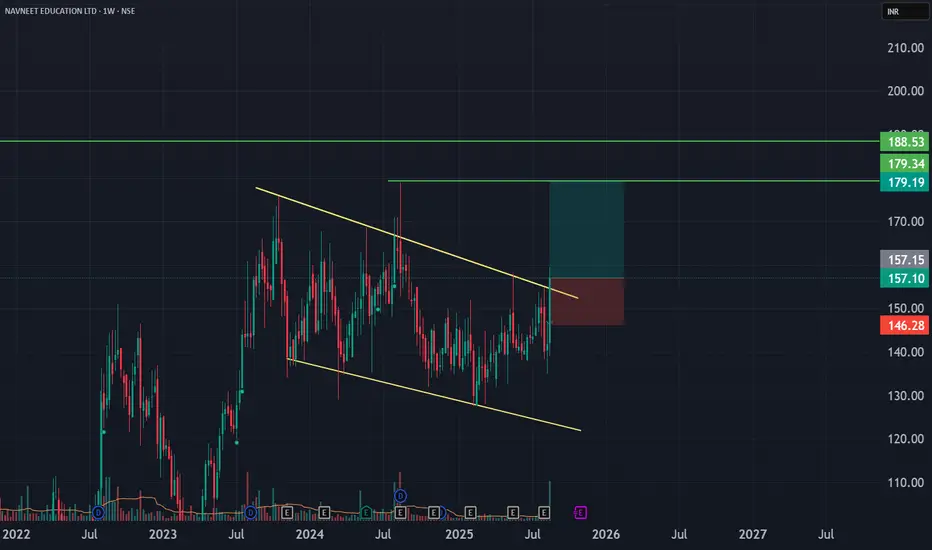
LICHSGFINPrice is forming a falling wedge. A falling wedge is a bullish pattern. Since the overall market sentiment is bearish, we will discuss bearish movement.
Price can have a pullback or fall from the current price.
In case of a pullback back if there is any bearish sign at the 554 - 556 zone, sell below 554 with the stop loss of 559 for the targets 549, 544, and 539.
No pullback and down trend continues, then sell below 548 with the stop loss of 553 for the targets 544, 538, and 532.

NG : A FALLING WEDGE BREAKOUT WITH 1:7.5 RR• NG was in downtrend and in a falling wedge for last 2 months
• Today It successfully retest the upper trend line of the wedge and confirming the BO
• A trade with 1:7.5 RR
• SL and the T1 and T2 mentioned in chart.
• Educational purpose only. Happy trading.

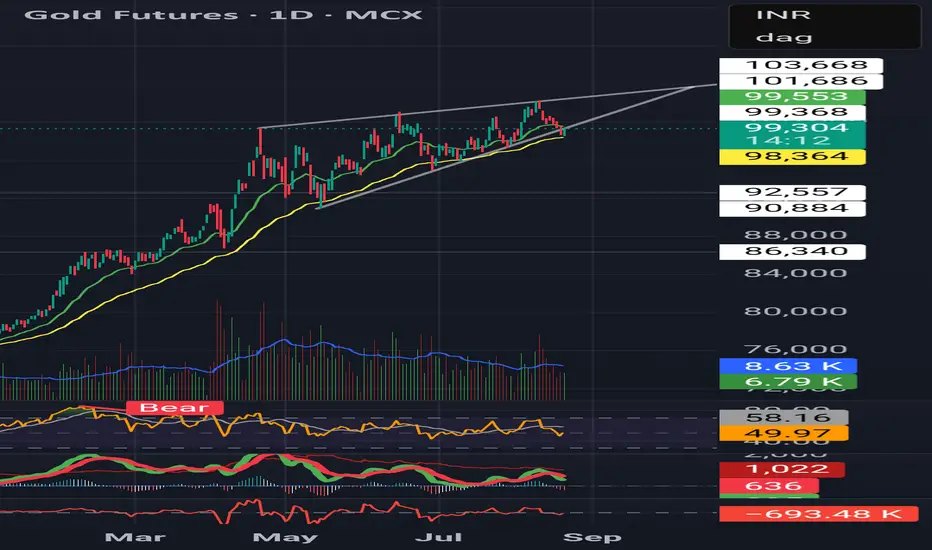
Rising Wedge in Gold
Bearish divergence visible in RSI & MACD
Volumes thinning out on rallies
Suggests safe-haven demand cooling
⚠️ Watch for breakdown below support — could trigger deeper correction.
XAUUSD : FALLING WEDGE BO• XAUUSD was moving in FALLING WEDGE channel from 5TH AUG.
• A BO happens in last hour where market closed above the falling wedge
• Long with a sl of 3331
• Take profit should be 3400
• A 1:5 RR
• Idea is for educational purpose and explore the price action learning with trading psychology.
• Have fun traders!!! 😊

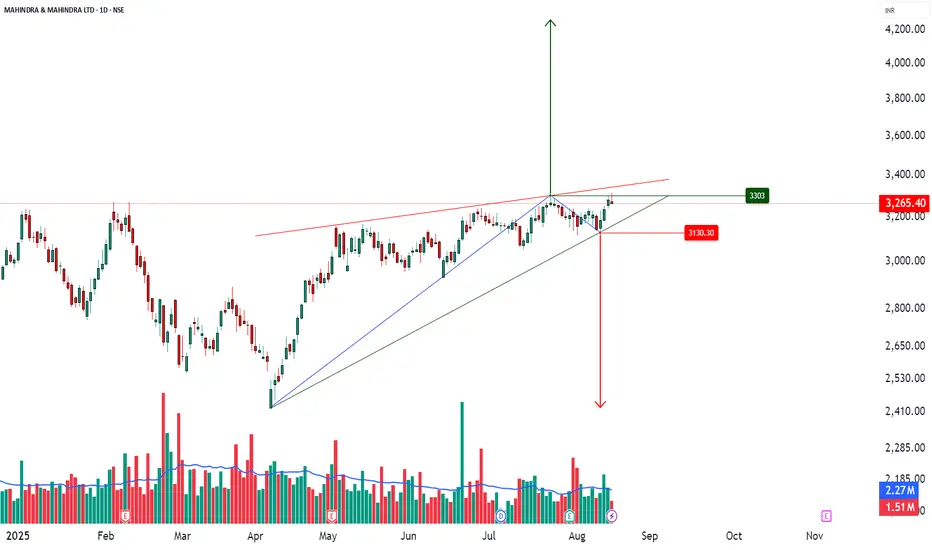
M&M _ Rising Wedge Formation📊 M&M – Technical & Educational Snapshot
Ticker: NSE: M&M | Sector: 🚙 Auto
CMP: ₹2,7XX (as of 16 Aug 2025)
Rating (for learning purpose): ⭐⭐⭐⭐
Pattern Observed: 📉 Rising Wedge Formation (Bearish Reversal Case Study)
🔑 Key Reference Levels (For Learning)
Support / Breakdown Zone: Lower wedge trendline
Resistance / Rejection Zone: Upper wedge trendline
Bearish Projection (Case Study): ~₹2,410
Bullish Continuation (Alternative View): ~₹3,300
📌 Pattern Observations
✅ Price forming higher highs & higher lows but within converging trendlines
✅ Momentum slowing → smaller swings inside wedge
✅ Typical bearish reversal structure (confirmation needed)
✅ Volume + RSI divergence can add conviction
📝 STWP Trade Analysis (Educational Illustration Only)
1️⃣ Bearish Breakdown (Primary Scenario)
Observation: Breakdown below wedge support often studied as bearish signal
Stop Loss (Learning Reference): Above upper wedge / recent swing high
Downside potential: ₹2,410 (measured move projection)
2️⃣ Bullish Breakout (Alternative Scenario)
Observation: Breakout above wedge resistance may lead to continuation
Stop Loss (Learning Reference): Below wedge / recent swing low
Upside potential: ₹3,300
📊 Risk Management & Confirmation
Traders typically wait for daily close outside wedge boundaries
Volume confirmation is key → spikes above average strengthen the move
RSI divergence often adds confidence to the setup
📌 Summary (Learning View Only)
The M&M Rising Wedge is a classic reversal study.
Key lesson: A wedge pattern teaches how slowing momentum can shift market control — but confirmation with volume + price close is essential before validating either direction.
⚠️ Disclaimer – Please Read Carefully
The information shared here is meant purely for learning and awareness. It is not a buy or sell recommendation and should not be taken as investment advice. I am not a SEBI-registered investment advisor, and all views expressed are based on personal study, chart patterns, and publicly available market data.
Trading — whether in stocks or options — carries risk. Markets can move unexpectedly, and losses can sometimes be larger than the money you have invested. Past performance or past setups do not guarantee future results.
If you are a beginner, treat this as a guide to understand how the market works — practice on paper trades before risking real money. If you are an experienced trader, remember to assess your own risk, position sizing, and strategy suitability before entering any trade.
Consult a SEBI-registered financial advisor before making any real trading decision.
By reading, watching, or engaging with this content, you acknowledge that you take full responsibility for your own trades and investments.
________________________________________
💬 Found this useful?
🔼 Give this post a Boost to help more traders discover clean, structured learning.
✍️ Drop your thoughts, questions, or setups in the comments — let’s grow together!
🔁 Share with fellow traders and beginners to spread awareness.
✅ Follow simpletradewithpatience for beginner-friendly setups, price action insights & disciplined trading content.
🚀 Stay Calm. Stay Clean. Trade With Patience.
Trade Smart | Learn Zones | Be Self-Reliant 📊
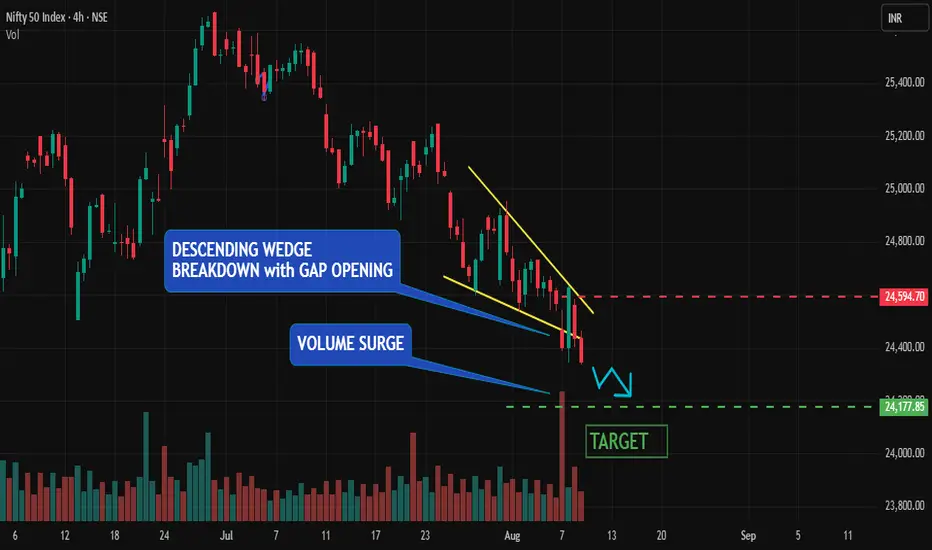
NIFTY BREAKDOWN CONFIRMED | BEARISH TARGETS ACTIVE!Nifty has already broken down from a well-formed descending wedge pattern on the 4-hour timeframe, backed by a strong volume spike — a classic sign of institutional selling pressure .
Additionally, the MACD has turned decisively bearish , further confirming the momentum shift to the downside .
TRADE SETUP (ACTIVE IDEA)
• Status: Breakdown already confirmed
• Target: 24,177
• Stop Loss: 24,594
• Risk-Reward: Favorable short setup post-breakdown
TECHNICAL HIGHLIGHTS
• Breakdown of descending wedge already in play
• High volume confirms conviction behind the move
• MACD bearish crossover supports downside bias
• Room for further weakness toward key support at 24,170
OBSERVATION
Price may retest the breakdown zone, but as long as it stays below 24,594 , the bearish structure remains intact.
Hdfc gearing up for pullback 1900 and more to followHDFC bank has enjoyed Almost 6 months of uptrend.
Looks over stretched without a pullback
1900 1850 1800 could follow in days to come.
RSI on Weekly showing Bearish Divergence..
Below 1996
Shorts could get aggressive
Dr. Reddy’s Breakout + Bullish Stochastic + Volume Surge = ₹1307🔍 TECHNICAL HIGHLIGHTS:
📉 DESCENDING WEDGE BREAKOUT:
Price has decisively broken above the wedge resistance, signaling a trend reversal.
🚀 GAP-UP OPENING:
Signals aggressive buyer interest and bullish sentiment.
🔄 STOCHASTIC OSCILLATOR:
Fast %K line has crossed above the slow %D line in the oversold zone, indicating momentum is shifting to the upside.
🔊 VOLUME SURGE:
Heavy volume during breakout confirms strong buying pressure and likely institutional participation.
🎯 TRADE SETUP:
✅ PROFIT TARGET : ₹1307
❌ STOP LOSS: ₹1221
📌 CONCLUSION:
All indicators align for a potential bullish rally. With pattern confirmation, momentum support, and volume validation, this setup looks promising. Watch for follow-through price action and volume consistency.

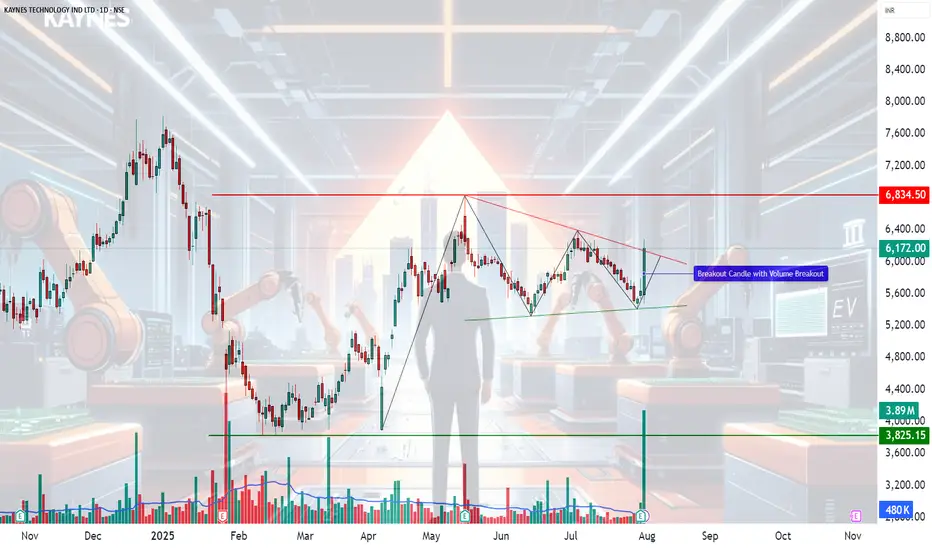
KAYNES TECHNOLOGY IND LTD – Technical Analysis________________________________________
🧠 KAYNES TECHNOLOGY IND LTD – Technical Analysis
Ticker: NSE:KAYNES | Sector: EMS & Semiconductors
Current Price: 6,172.00 ▲ (+9.5% on July 31, 2025)
Technical View: ⭐⭐⭐⭐ | Chart Pattern: Falling Wedge Breakout
________________________________________
📈 Technical Overview
🔹 Chart Pattern Formed: Falling Wedge Breakout with extremely high volume confirmation
🔹 Breakout Zone: 6,000–6,050
🔹 Momentum Signals:
— RSI breakout above 60
— Strong bullish candle with rising volume
— VWAP and SuperTrend aligned bullish
🔹 Support Trendline Held on multiple touchpoints
🔹 Breakout Candle marked by heavy institutional volume
________________________________________
📰 Key Fundamental Developments
✅ Q1 FY26 PAT up ~50% YoY to 74.6 Cr
✅ Gross margin expanded to 41%, EBITDA margin to 16.8%
✅ Strategic acquisitions from Fujitsu (85 Cr domestic + 118 Cr JV with L&T)
✅ Strong order book visibility (~7,400 Cr)
✅ Raised 1,600 Cr via QIP to fund growth
________________________________________
📊 Sentiment Analysis
Sentiment: ✅ Positive
— Strong earnings beat and margin expansion
— Global expansion through Fujitsu JV
— Bullish commentary from major brokerages
— Institutional confidence via QIP and upgrades
________________________________________
🔼 Resistance Levels
6,400 – Immediate breakout target
6,834 – Top of consolidation range
7,285 – Medium-term resistance (historic supply zone)
🔽 Support Levels
5,970 – Breakout retest zone
5,700 – Structure base
5,170 / 4,864 – Deep support for longer-term invalidation
________________________________________
📌 What’s Catching Our Eye
🔹 Volume spike confirms genuine breakout
🔹 RSI, SuperTrend, VWAP – all flashing bullish
🔹 Back-to-back bullish closes after a 10 day contraction breakout
🔹 Volume & price action aligned across multiple timeframes
________________________________________
👀 What We’re Watching For
🔸 Follow-through momentum toward 6,400+
🔸 Whether breakout holds above 5,970 in coming sessions
🔸 Semiconductor line execution progress
🔸 Margin trends in upcoming quarters
________________________________________
⚠️ Risks to Monitor
⚠️ Rich valuations (~130x P/E) – limited room for disappointment
⚠️ Execution risk on new lines and acquisitions
⚠️ Global slowdown in electronics & macro headwinds
⚠️ Any delay in semiconductor segment scale-up
________________________________________
🔮 What to Expect Next
🔹 Retest of breakout zone (~6,000–6,050) possible
🔹 If held, expect momentum toward 6,400–6,800
🔹 Sideways consolidation likely if volumes taper
🔹 Strong close above 6,400 could initiate fresh uptrend leg
________________________________________
📈 Strategy Insight (For Educational Purposes Only)
— Aggressive Traders: Watch level of 6284
— Momentum Traders: Watch 6,050 retest for low-risk entry
— Risk Management: Position sizing + Capital risk – as per individual preference
________________________________________
💬 Why It’s On Our Watchlist
Kaynes blends EMS scale with high-margin ODM design and semiconductor upside. Rare in India’s listed space. Strong revenue visibility, global expansions, and balance sheet strength make it a high-conviction long-term story.
________________________________________
📉 If Price Comes Down…
5,700–5,800 is a critical support zone. Breakdown below this with volume = trend weakness. 5,400 is final demand zone before structural damage.
________________________________________
🪙 Educational Insight for Learners
This chart is a real-world example of a falling wedge breakout confirmed by volume. The key takeaway: price alone is not enough—watch volume, RSI, and structure. Never chase momentum without a plan. Always pair conviction with discipline.
________________________________________
🚨 Reminder: No stock is a “sure thing.” Use proper risk management. Stay rational when others get emotional.
________________________________________
⚠️ Disclaimer (Please Read Carefully):
This content is shared strictly for educational and research purposes only.
I am not a SEBI-registered investment advisor, and no buy or sell recommendations are being made.
All views expressed are based on personal market analysis and experience. They are not intended as financial advice.
Trading — especially in derivatives like options — involves significant financial risk. Losses can exceed your initial investment.
👉 Always do your own research and consult a certified SEBI-registered advisor before making any investment or trading decisions.
👉 Use proper risk management and only trade with capital you can afford to lose.
The author assumes no responsibility or liability for any trading losses incurred from acting on this content.
By engaging with this material, you agree to these terms.
________________________________________
💬 Found this helpful?
Drop your thoughts, questions, or insights in the comments below ⬇️ — let’s learn together!
🔁 Share this post with your trading friends and community — help them discover clean charts, structured setups, and zone-based learning.
✅ Follow simpletradewithpatience for clear setups, educational content, and a no-nonsense approach to price action, supply-demand zones, and risk-managed trades.
🚀 Trade with patience. Trust your charts. Stay clear-headed.
Because the goal is not just to trade — it's to trade better.
Be Self-Reliant | Trade with Patience | Learn with Charts & Zones 📊
Rising Wedge Breakdown — 54,252 in Sight?#BankNifty View:
CMP: 56,528
BankNifty has broken down from a Rising Wedge pattern — a bearish signal. After a brief retest of the breakdown level, price has resumed its downward move. Daily close below 56,205 will gather fresh momentum.
🔑 A daily close below 56,205 could trigger fresh downside momentum.
🔻 Support Zones:
• 56,283 – 56,080
• 55,580 – 55,530
• 🔑 Key Supports: 54,470 – 54,375 & 53,600 – 53,580
🔺 Resistance Zone:
• 57,312 – 57,365
🎯 Pattern Target: 54,252
This aligns with the key support zone at 54,470 – 54,375 , strengthening its significance.
📌 Disclaimer: This analysis is shared for educational purposes only. It is not a buy/sell recommendation. Please do your own research before making any trading decisions.
#TechnicalAnalysis | #PriceAction | #RisingWedge | #ChartPatterns

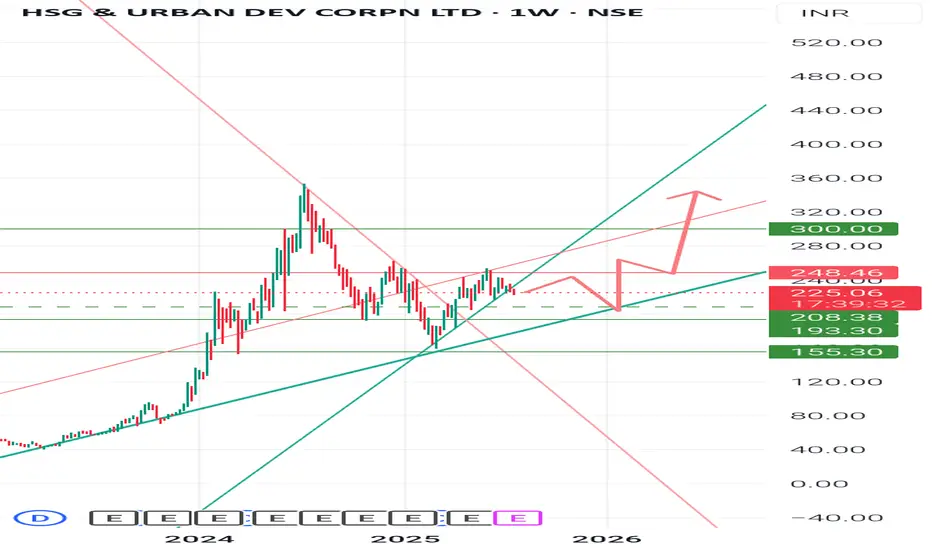
Hudco : Long with support 210 to 360Keep adding small quantity on every dip of Hudco for 1-2 years.. It will touch 360 .
There is support and demand zone 240-210.. Stock will consolidate in this range for few months, so have patience, good things take time. 👍
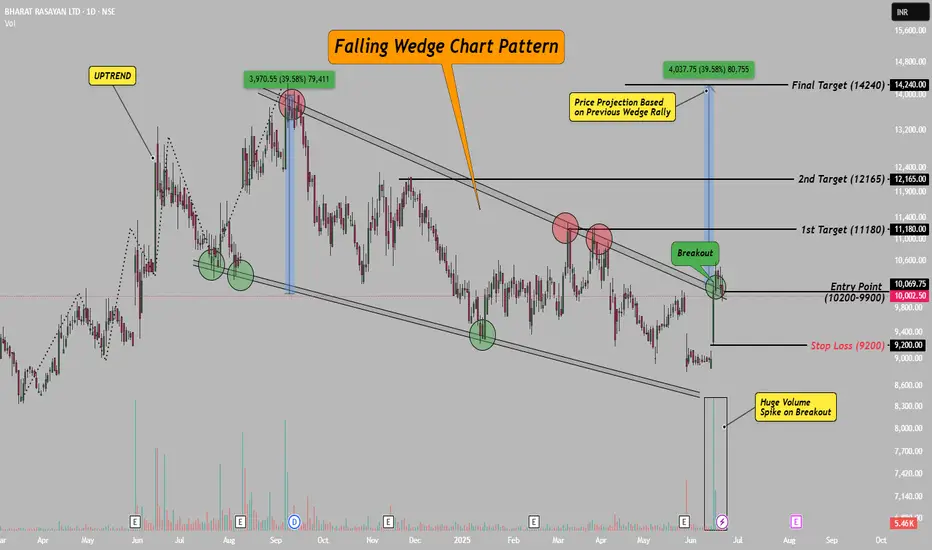
Bharat Rasayan–Falling Wedge Breakout with 39% Upside Potential!Hello Everyone, i hope you all will be doing good in your life and your trading as well! Today i have brought a post which is on Bharat Rasayan – a classic case of a falling wedge breakout.
After staying in a falling wedge pattern for nearly 10 months, the stock has finally broken out with a strong bullish candle and a clear volume spike. This breakout zone (9900–10200) also aligns with the downtrend line, making it even more valid.
The best part? This has participated in rally yet, means there is a lot remain in this stock, please check chart above for entry, stop loss and targets.
This setup is based on price action, chart structure, and previous pattern behavior. If you’re a swing or positional trader, this one’s worth watching!
If you liked this idea, don’t forget to LIKE & FOLLOW for more clean, technical setups.
Disclaimer: This idea is for educational purposes only. Do your own research before taking any trade.
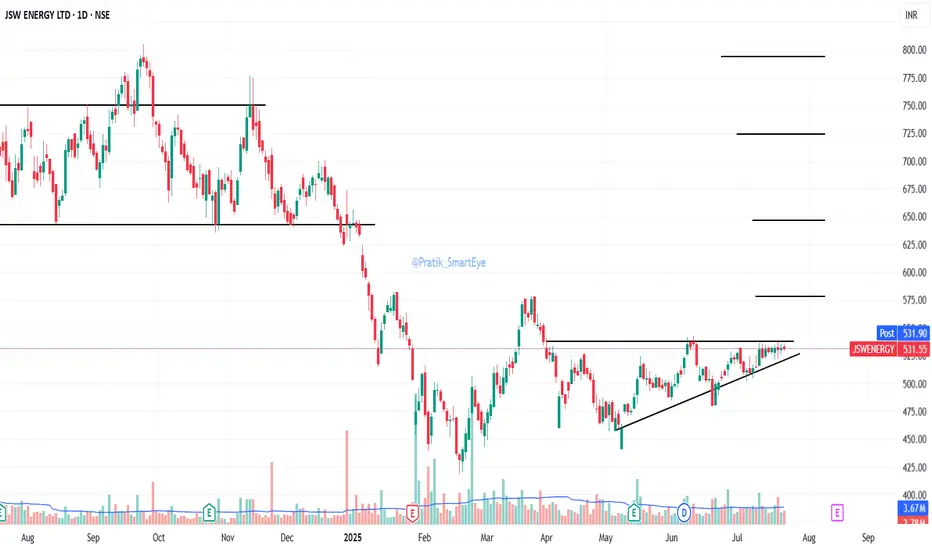
JSW Energy: forming a ascending triangleJSW Energy: forming a ascending triangle. CMP 531.
Breakout at sustained close above 540.
Resistance 578/646/724/794
Support 515/508
Earnings expected on 14Aug25
A Bullish Continuation Wedge + Elliott WaveIn NSE:ZENTEC the upward movement is likely to resume.
PLEASE NOTE THAT:
This chart analysis is only for reference purpose.
This is not buying or selling recommendations.
I am not SEBI registered.
Please consult your financial advisor before taking any trade
