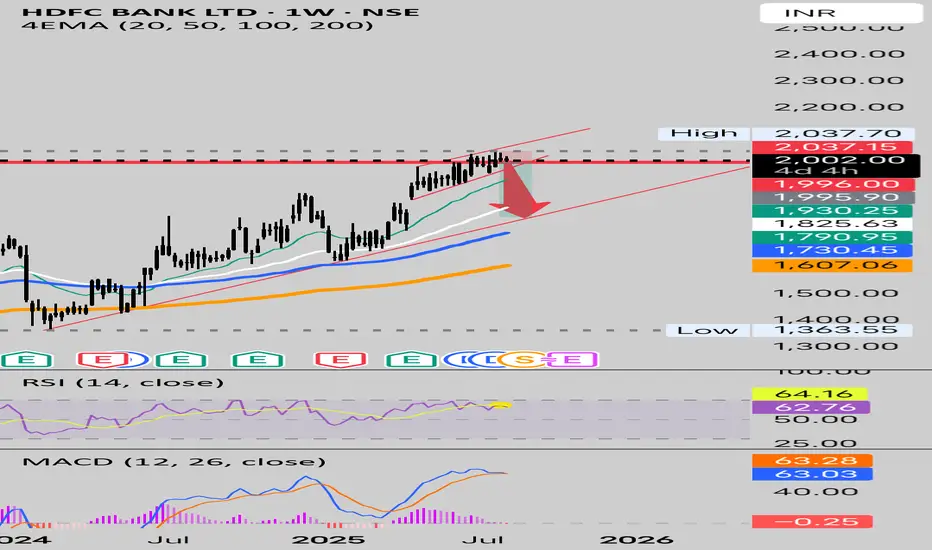
Hdfc gearing up for pullback 1900 and more to followHDFC bank has enjoyed Almost 6 months of uptrend.
Looks over stretched without a pullback
1900 1850 1800 could follow in days to come.
RSI on Weekly showing Bearish Divergence..
Below 1996
Shorts could get aggressive
Wedge
Dr. Reddy’s Breakout + Bullish Stochastic + Volume Surge = ₹1307🔍 TECHNICAL HIGHLIGHTS:
📉 DESCENDING WEDGE BREAKOUT:
Price has decisively broken above the wedge resistance, signaling a trend reversal.
🚀 GAP-UP OPENING:
Signals aggressive buyer interest and bullish sentiment.
🔄 STOCHASTIC OSCILLATOR:
Fast %K line has crossed above the slow %D line in the oversold zone, indicating momentum is shifting to the upside.
🔊 VOLUME SURGE:
Heavy volume during breakout confirms strong buying pressure and likely institutional participation.
🎯 TRADE SETUP:
✅ PROFIT TARGET : ₹1307
❌ STOP LOSS: ₹1221
📌 CONCLUSION:
All indicators align for a potential bullish rally. With pattern confirmation, momentum support, and volume validation, this setup looks promising. Watch for follow-through price action and volume consistency.

KAYNES TECHNOLOGY IND LTD – Technical Analysis________________________________________
🧠 KAYNES TECHNOLOGY IND LTD – Technical Analysis
Ticker: NSE:KAYNES | Sector: EMS & Semiconductors
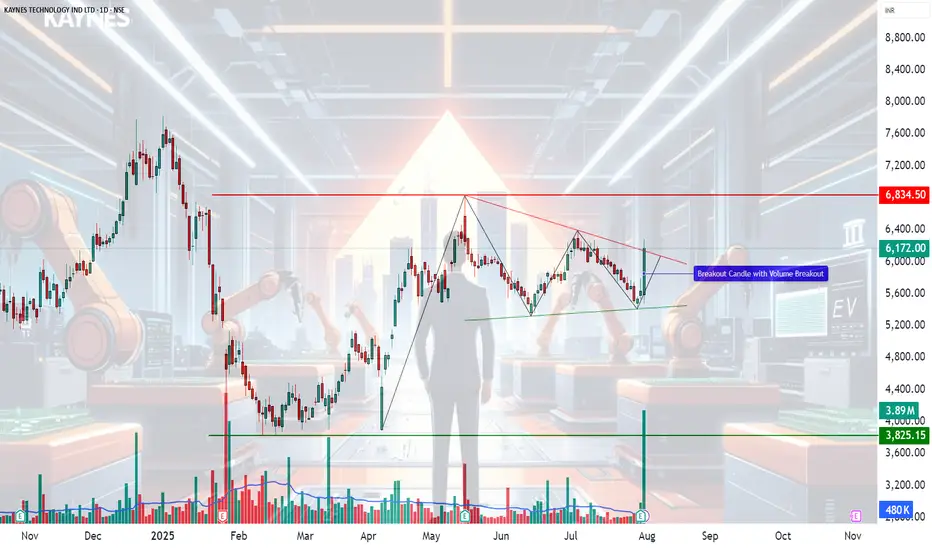
Current Price: 6,172.00 ▲ (+9.5% on July 31, 2025)
Technical View: ⭐⭐⭐⭐ | Chart Pattern: Falling Wedge Breakout
________________________________________
📈 Technical Overview
🔹 Chart Pattern Formed: Falling Wedge Breakout with extremely high volume confirmation
🔹 Breakout Zone: 6,000–6,050
🔹 Momentum Signals:
— RSI breakout above 60
— Strong bullish candle with rising volume
— VWAP and SuperTrend aligned bullish
🔹 Support Trendline Held on multiple touchpoints
🔹 Breakout Candle marked by heavy institutional volume
________________________________________
📰 Key Fundamental Developments
✅ Q1 FY26 PAT up ~50% YoY to 74.6 Cr
✅ Gross margin expanded to 41%, EBITDA margin to 16.8%
✅ Strategic acquisitions from Fujitsu (85 Cr domestic + 118 Cr JV with L&T)
✅ Strong order book visibility (~7,400 Cr)
✅ Raised 1,600 Cr via QIP to fund growth
________________________________________
📊 Sentiment Analysis
Sentiment: ✅ Positive
— Strong earnings beat and margin expansion
— Global expansion through Fujitsu JV
— Bullish commentary from major brokerages
— Institutional confidence via QIP and upgrades
________________________________________
🔼 Resistance Levels
6,400 – Immediate breakout target
6,834 – Top of consolidation range
7,285 – Medium-term resistance (historic supply zone)
🔽 Support Levels
5,970 – Breakout retest zone
5,700 – Structure base
5,170 / 4,864 – Deep support for longer-term invalidation
________________________________________
📌 What’s Catching Our Eye
🔹 Volume spike confirms genuine breakout
🔹 RSI, SuperTrend, VWAP – all flashing bullish
🔹 Back-to-back bullish closes after a 10 day contraction breakout
🔹 Volume & price action aligned across multiple timeframes
________________________________________
👀 What We’re Watching For
🔸 Follow-through momentum toward 6,400+
🔸 Whether breakout holds above 5,970 in coming sessions
🔸 Semiconductor line execution progress
🔸 Margin trends in upcoming quarters
________________________________________
⚠️ Risks to Monitor
⚠️ Rich valuations (~130x P/E) – limited room for disappointment
⚠️ Execution risk on new lines and acquisitions
⚠️ Global slowdown in electronics & macro headwinds
⚠️ Any delay in semiconductor segment scale-up
________________________________________
🔮 What to Expect Next
🔹 Retest of breakout zone (~6,000–6,050) possible
🔹 If held, expect momentum toward 6,400–6,800
🔹 Sideways consolidation likely if volumes taper
🔹 Strong close above 6,400 could initiate fresh uptrend leg
________________________________________
📈 Strategy Insight (For Educational Purposes Only)
— Aggressive Traders: Watch level of 6284
— Momentum Traders: Watch 6,050 retest for low-risk entry
— Risk Management: Position sizing + Capital risk – as per individual preference
________________________________________
💬 Why It’s On Our Watchlist
Kaynes blends EMS scale with high-margin ODM design and semiconductor upside. Rare in India’s listed space. Strong revenue visibility, global expansions, and balance sheet strength make it a high-conviction long-term story.
________________________________________
📉 If Price Comes Down…
5,700–5,800 is a critical support zone. Breakdown below this with volume = trend weakness. 5,400 is final demand zone before structural damage.
________________________________________
🪙 Educational Insight for Learners
This chart is a real-world example of a falling wedge breakout confirmed by volume. The key takeaway: price alone is not enough—watch volume, RSI, and structure. Never chase momentum without a plan. Always pair conviction with discipline.
________________________________________
🚨 Reminder: No stock is a “sure thing.” Use proper risk management. Stay rational when others get emotional.
________________________________________
⚠️ Disclaimer (Please Read Carefully):
This content is shared strictly for educational and research purposes only.
I am not a SEBI-registered investment advisor, and no buy or sell recommendations are being made.
All views expressed are based on personal market analysis and experience. They are not intended as financial advice.
Trading — especially in derivatives like options — involves significant financial risk. Losses can exceed your initial investment.
👉 Always do your own research and consult a certified SEBI-registered advisor before making any investment or trading decisions.
👉 Use proper risk management and only trade with capital you can afford to lose.
The author assumes no responsibility or liability for any trading losses incurred from acting on this content.
By engaging with this material, you agree to these terms.
________________________________________
💬 Found this helpful?
Drop your thoughts, questions, or insights in the comments below ⬇️ — let’s learn together!
🔁 Share this post with your trading friends and community — help them discover clean charts, structured setups, and zone-based learning.
✅ Follow simpletradewithpatience for clear setups, educational content, and a no-nonsense approach to price action, supply-demand zones, and risk-managed trades.
🚀 Trade with patience. Trust your charts. Stay clear-headed.
Because the goal is not just to trade — it's to trade better.
Be Self-Reliant | Trade with Patience | Learn with Charts & Zones 📊
Rising Wedge Breakdown — 54,252 in Sight?#BankNifty View:
CMP: 56,528
BankNifty has broken down from a Rising Wedge pattern — a bearish signal. After a brief retest of the breakdown level, price has resumed its downward move. Daily close below 56,205 will gather fresh momentum.
🔑 A daily close below 56,205 could trigger fresh downside momentum.
🔻 Support Zones:
• 56,283 – 56,080
• 55,580 – 55,530
• 🔑 Key Supports: 54,470 – 54,375 & 53,600 – 53,580
🔺 Resistance Zone:
• 57,312 – 57,365
🎯 Pattern Target: 54,252
This aligns with the key support zone at 54,470 – 54,375 , strengthening its significance.
📌 Disclaimer: This analysis is shared for educational purposes only. It is not a buy/sell recommendation. Please do your own research before making any trading decisions.
#TechnicalAnalysis | #PriceAction | #RisingWedge | #ChartPatterns

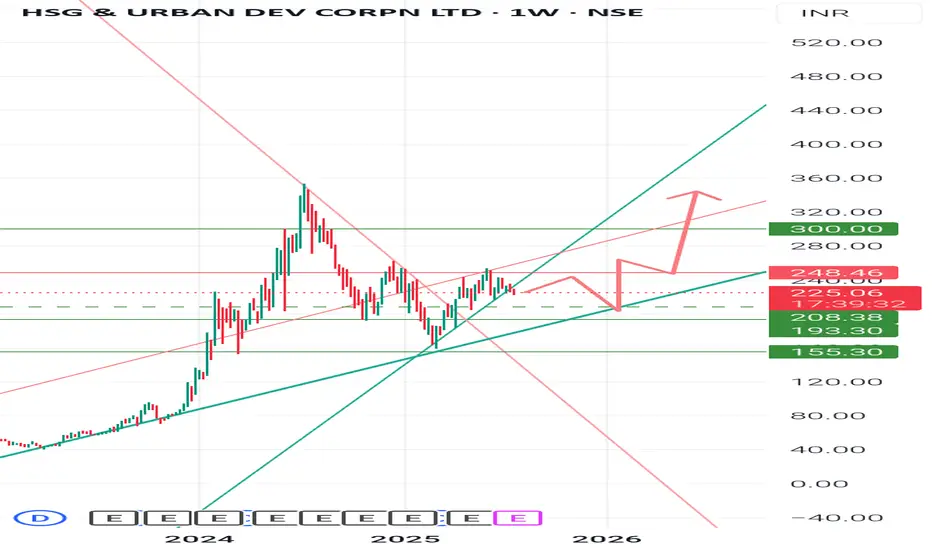
Hudco : Long with support 210 to 360Keep adding small quantity on every dip of Hudco for 1-2 years.. It will touch 360 .
There is support and demand zone 240-210.. Stock will consolidate in this range for few months, so have patience, good things take time. 👍
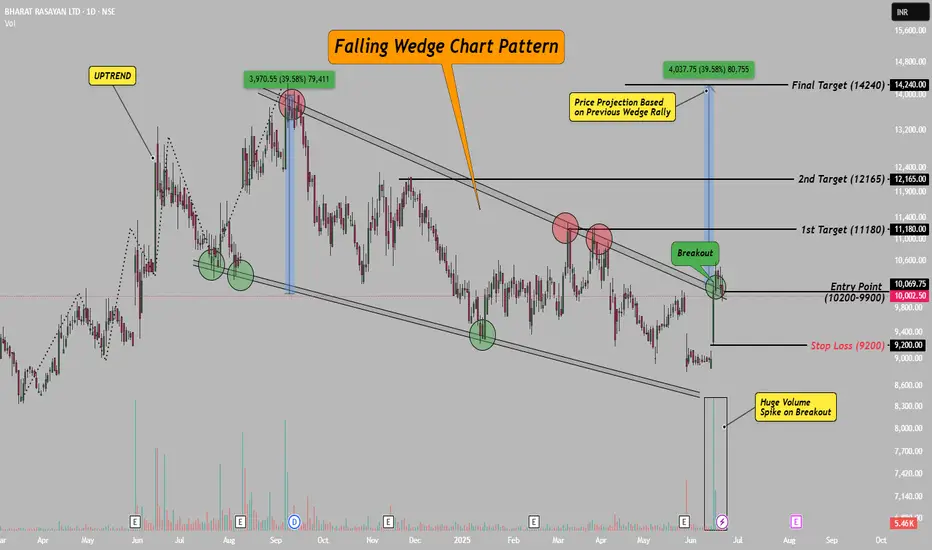
Bharat Rasayan–Falling Wedge Breakout with 39% Upside Potential!Hello Everyone, i hope you all will be doing good in your life and your trading as well! Today i have brought a post which is on Bharat Rasayan – a classic case of a falling wedge breakout.
After staying in a falling wedge pattern for nearly 10 months, the stock has finally broken out with a strong bullish candle and a clear volume spike. This breakout zone (9900–10200) also aligns with the downtrend line, making it even more valid.
The best part? This has participated in rally yet, means there is a lot remain in this stock, please check chart above for entry, stop loss and targets.
This setup is based on price action, chart structure, and previous pattern behavior. If you’re a swing or positional trader, this one’s worth watching!
If you liked this idea, don’t forget to LIKE & FOLLOW for more clean, technical setups.
Disclaimer: This idea is for educational purposes only. Do your own research before taking any trade.
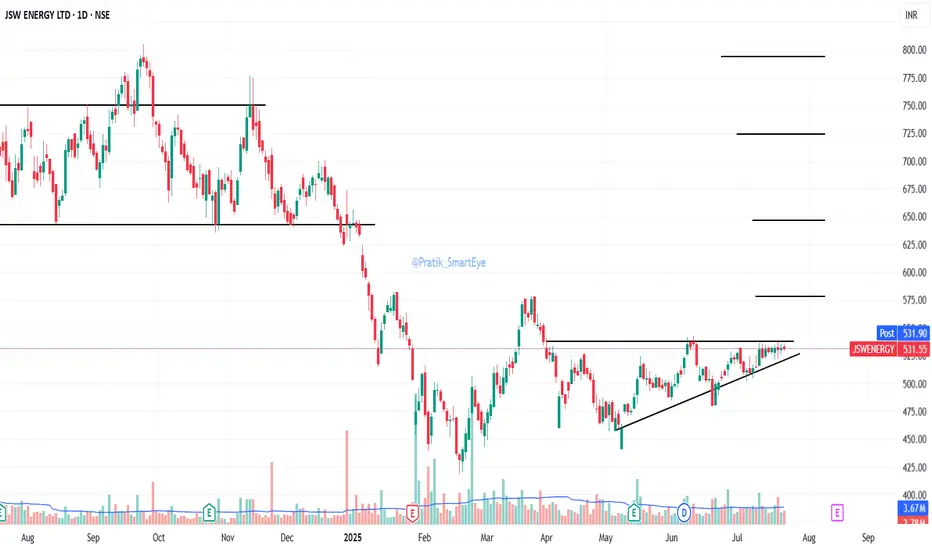
JSW Energy: forming a ascending triangleJSW Energy: forming a ascending triangle. CMP 531.
Breakout at sustained close above 540.
Resistance 578/646/724/794
Support 515/508
Earnings expected on 14Aug25
A Bullish Continuation Wedge + Elliott WaveIn NSE:ZENTEC the upward movement is likely to resume.
PLEASE NOTE THAT:
This chart analysis is only for reference purpose.
This is not buying or selling recommendations.
I am not SEBI registered.
Please consult your financial advisor before taking any trade

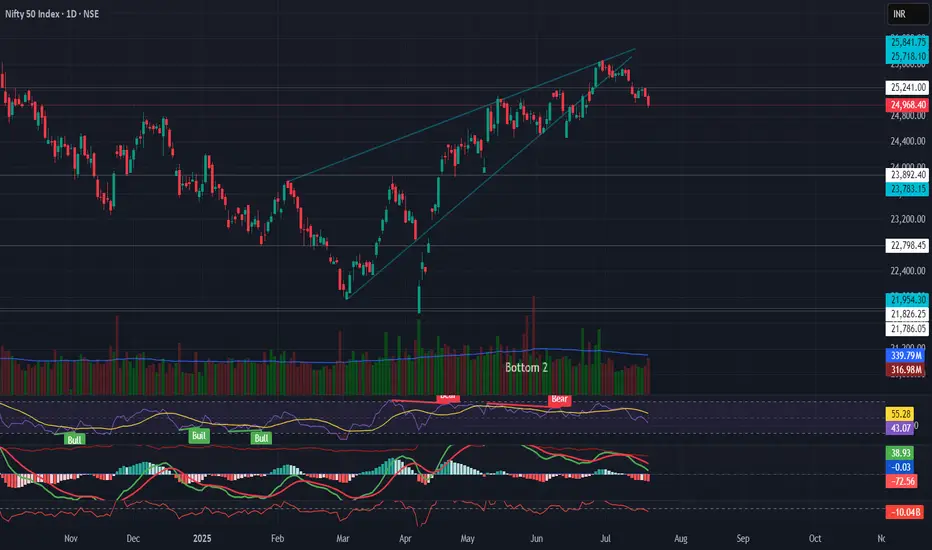
NIFTY Technical Breakdown – Rising Wedge Pattern🔻 NIFTY Technical Breakdown – Rising Wedge Pattern
The Nifty 50 has broken down from a rising wedge pattern on the daily timeframe, a bearish reversal formation that often signals distribution at the top.
📉 Key Observations:
Rising wedge breakdown after extended rally
RSI bearish divergence confirming weakness
MACD crossover turning negative
Volume gradually decreasing during the rise, indicating exhaustion
ADX flattening, showing weakening trend strength
📌 Support Levels to Watch:
23,783 – Key swing support
22,798 – Previous breakout zone
📌 Sectoral Rotation:
Defensive sectors like Pharma & FMCG are gaining strength
FII selling pressure, rising DXY, and global uncertainty continue to weigh on sentiment
⚠️ Outlook:
Caution warranted in the short term. Watch for sustained close below 24,900 for further downside confirmation. Macro and global cues to play a key role ahead.
💬 What’s your view on Nifty's near-term direction?
#Nifty50 #TechnicalAnalysis #RisingWedge #MarketOutlook #TradingView #ChartStudy #IndiaMarkets #BearishSetup #NiftyBreakdown #Puneet0130
GOLD (XAUUSD) 4H Analysis – Breakout Imminent from Rising Wedge!Gold is currently trading at 3353.39 after completing a well-defined ABCDE rising wedge structure on the 4H chart. The market is showing signs of exhaustion near the 3353–3373 resistance zone, with a potential bearish rejection likely to follow.
🔍 Key Highlights:
Pattern: Rising Wedge (ABCDE complete) – a classic bearish reversal setup.
Sell Zone: 3353.88 to 3371.62 – Expect high volatility and sharp rejection.
Target: 3296.36 – Marked as the first major support zone.
Risk Management: Strong R:R setup with invalidation above 3373.93.
Heikin Ashi candles show weakening bullish momentum near the top.
📉 What to Watch: If price confirms rejection below 3353 with bearish pressure, a sharp fall toward the 3296 level could follow. Breakout traders and swing traders should stay alert – this could be a textbook move.
📌 Professional Insight: This setup is not just a pattern – it's a psychological battlefield between bulls pushing exhaustion and bears waiting to strike. The next few candles could define the mid-term gold trend.
🚨 Don’t miss this potential opportunity. Mark your levels. Stay disciplined.
#GoldAnalysis #XAUUSD #ForexTrading #SwingTrade #TechnicalAnalysis #HeikinAshi #BreakoutSetup #SmartTrading #RiskReward #TradingEdge

Bank nifty correction start now?Bank Nifty
Current Price: 56,791.95 (Spot)
Bank Nifty has reversed lower from the resistance trendline, confirming selling pressure near higher levels.
A Dark Cloud Cover candlestick pattern combined with an emerging M-top formation indicates potential short-term bearish sentiment.
It can short here or any bounce use as shorting opportunity for target 56,056
Major resistance is 57,400-57,700
The index is forming a rising wedge pattern, a bearish structure suggesting potential for deeper correction if key support levels are breached.
Key Support Levels:
Immediate support is identified at 56,056 (trendline support).
A decisive close below 56,056 may accelerate selling pressure, opening downside targets toward: 55,342 , 53,908

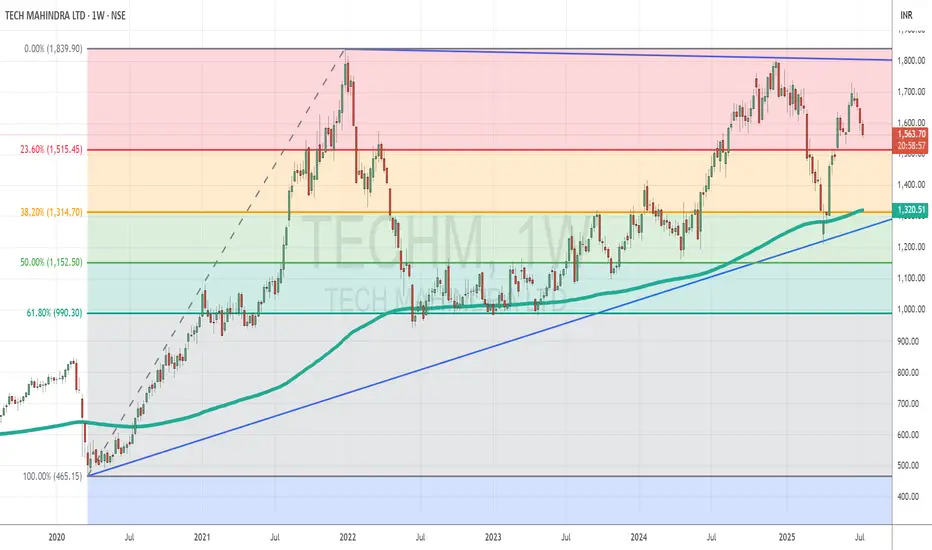
Tech Mahindra Consolidates in a Wedge After Strong Support at KeTopic Statement:
TechM has been stuck in a consolidation zone, rebounding from strong support levels and forming a wedge pattern that may signal an upcoming breakout.
Key Points:
* The stock corrected up to the 30% Fibonacci retracement level, finding strong support around 1314
* It touched the 200-day moving average, which acted as a support and triggered a rebound
* The candlestick formation resembles a wedge, clearly marked on the chart with blue trend lines, indicating potential for a decisive move ahead
CAMS – Rising Wedge in Focus ________________________________________________________________________________
📈 CAMS – Rising Wedge in Focus
🕒 Chart Type: Daily
________________________________________________________________________________
What’s Catching Our Eye:
CAMS is forming a Rising Wedge, a technical structure that often leads to strong directional moves. The price is nearing the upper boundary of the wedge, indicating possible breakout or reversal. This contraction in range is typically followed by expansion — and smart traders are watching closely.
________________________________________________________________________________
What We’re Watching For:
Price holding above ₹4201.40 could trigger interest from early participants. On the flip side, a breakdown below ₹4090.50 may signal failure of the wedge structure. For more confirmation-driven entries, one may wait for a proper breakout or breakdown candle with volume.
________________________________________________________________________________
Volume Footprint Analysis:
As expected in wedge formations, volume has compressed. A breakout supported by volume expansion could validate the move and offer confidence in continuation. Volume is the key trigger to watch once the wedge resolves.
________________________________________________________________________________ Option Structure Insight:
For educational purposes, one could observe a neutral hedge approach using options:
– Buy 4200 CE
– Buy 4100 PE
This can potentially help capture a sharp move in either direction. Once the move confirms, the opposite leg can be exited to ride the trend with managed risk.
Price Action Logic:
Rising wedge formations typically form after a directional up-move and narrow into a tightening range. This is often followed by an impulsive expansion phase. CAMS is showing that exact setup. The price is sandwiched between key resistance at ₹4200+ and demand near ₹3880.
________________________________________________________________________________
💼 Sector Tailwinds:
CAMS, operating within the mutual fund RTA space, benefits from India's rising retail participation and SIP growth. The digitalisation of mutual fund flows, compliance demand, and data-based services lend long-term support to this sector. These factors offer fundamental strength to this technical setup.
________________________________________________________________________________
⚠️ Risks to Watch:
– A close below ₹4085 could invalidate the bullish wedge setup
– Current price behavior reflects compression, but indicators like Stochastic may suggest near-term overbought conditions
– Avoid chasing — wait for confirmation via breakout + volume or a proper retest candle
– Do not over-leverage in a low-volume wedge structure — focus on proper R:R and sizing
________________________________________________________________________________
🔮 What to Expect Next:
If the wedge breaks upward and sustains above ₹4201.40 with volume, price expansion may be observed toward ₹4330–₹4450 zone. On the downside, a breakdown below ₹4090.50 may trigger a move toward the ₹3950–₹3880 support cluster. Watch for confirmation in the next 2–3 sessions before taking directional exposure.
________________________________________________________________________________
🧠 How to Trade CAMS (For Educational Use Only):
🔹 Breakout Trade Plan
• Entry: Above ₹4201.40
• Stop Loss: Below ₹4090.50 (closing basis preferred)
• Pullback Entry: If price returns to ₹4095–₹4105 zone and shows bounce confirmation
• Risk-Reward: Start with 1:1, trail for 1:2+
• Position Sizing: Based on risk, never overexpose in a wedge
🔹 Options Strategy (Educational View)
• Buy CAMS 4200 CE
• Buy CAMS 4100 PE
• Exit the losing leg once direction confirms with price + volume breakout
________________________________________________________________________________
📍 Levels to Keep an Eye On:
The first key level to observe is ₹4201.40 — a break above this may attract early interest from aggressive participants as it represents the upper boundary of the rising wedge. On the downside, ₹4090.50 acts as the breakdown level; if breached, it could suggest structural weakness and a potential shift in trend.
In case of an upward breakout, we are closely monitoring the ₹4330–₹4450 zone as a possible price expansion area. If the breakdown plays out instead, the ₹3950–₹3880 zone becomes important as a potential reaction area or demand test.
Historically, the ₹3880–₹3950 range has shown signs of buyer interest and may act as a demand zone if retested. On the upside, ₹4320–₹4400 has acted as supply in the past and could present resistance if the price extends higher.
A close below ₹4085 would invalidate the bullish wedge structure and may require a reassessment of directional bias.
________________________________________________________________________________
⚠️ Disclaimer (Please Read):
• This chart is shared for educational purposes only and is not investment advice.
• I am not a SEBI-registered advisor.
• The information provided here is based on personal market observation.
• No buy/sell recommendations are being made.
• Please do your own research or consult a registered financial advisor before making any trading decisions.
• Trading involves risk. Always use proper risk management.
________________________________________________________________________________
💬 Found this helpful?
How would you prefer to approach this — breakout entry or pullback into zone?
Drop your thoughts or questions in the comments below ⬇️
🔁 Share this post with your trading community.
✅ Follow @SimpleTradeWithPatience for price-action backed technical setups.
🚀 Let’s trade with patience, logic, and clarity!
Be Self-Reliant | Trade with Patience | Learn with Logic
________________________________________________________________________________

Bank nifty trading As per the current scenario of Bank Nifty chart as shown there is a rising wedge and Bank Nifty is running on the top resistance of this page. A fair possibility that it can cross the top resistance of a this wedge and proceed for new high.
Suppose it didn't, then the fall estimate will be off more than 3000 to 4000 points
So be cautious...wait for confirmation retracemet and change in polarity.

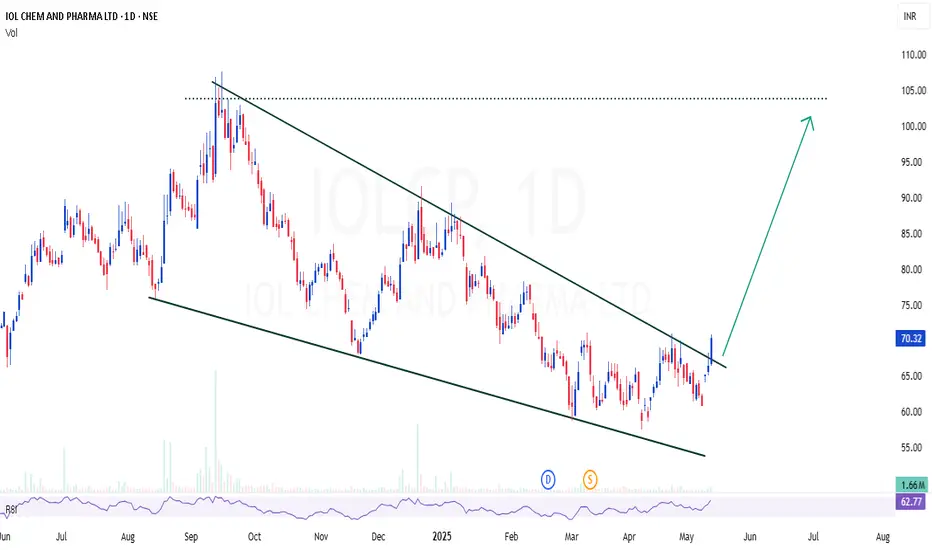
IOLCP | Perfect channel / wedge breakout - Looks good for 50%IOLCP | Perfect channel / wedge breakout - Looks good for 50%
CMP : 70
SL : 60
Target : 100
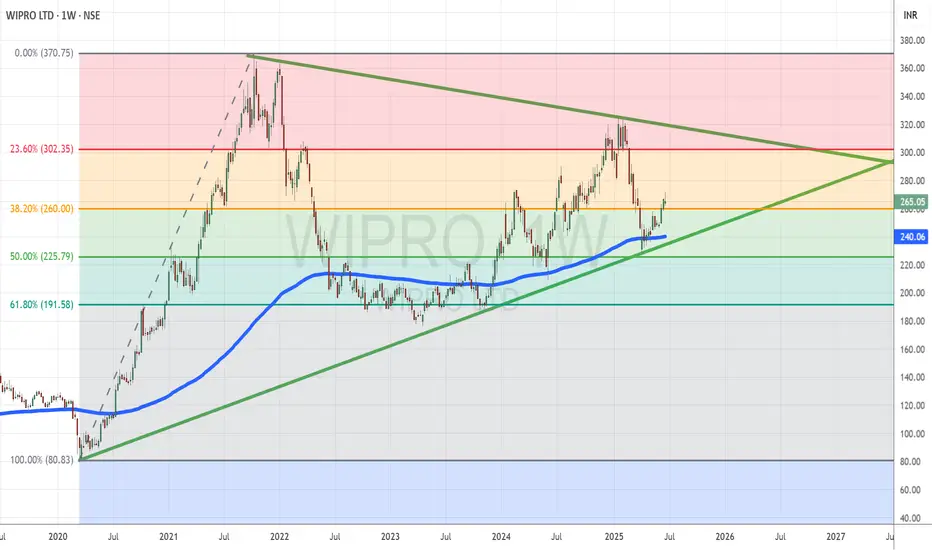
Wipro Trades in a Tight Wedge After Support-Led ReversalTopic Statement:
Wipro, a lagging IT stock, has shown signs of reversal after strong support at the 50% retracement level, with a wedge pattern hinting at a decisive breakout ahead.
Key Points:
* The stock retraced to the 50% Fibonacci level at 225, where it found strong support and reversed
* Price had dipped below the 180-day EMA during the correction, further reinforcing the significance of the support zone
* A wedge pattern is now forming, and a breakout on either side could define the next major move
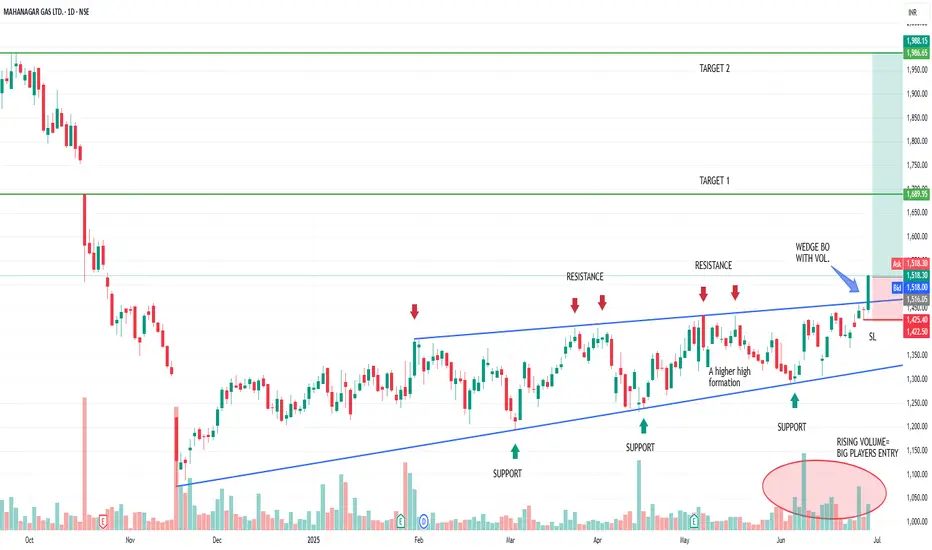
MGL: A study on wedge BO with 1:5 RR• MGL was consolidating in a tight range for the last 7 months.
• It has formed a rising wedge.
• Last 1 months showing significant volume buildup confirming big boys already entered in the trade.
• Today it broke out the wedge with significant volume and strong hourly closing.
• A massive 480 points move is possible in positional bases.
• All the T1 (gap border 1689) and T2 (1986) mentioned in the chart.
• SL for position should be 1425.
• Currently a RR opportunity of 1:5.
• Please note the daily candle yet not closed. Wait for a daily candle closure and make a decision.
• Idea is for educational purpose and explore the price action learning with trading psychology.
• Have fun traders!!! 😊
Silver retest and breakout looking for big targetsascending pattern plus breakout retested hold with small sl
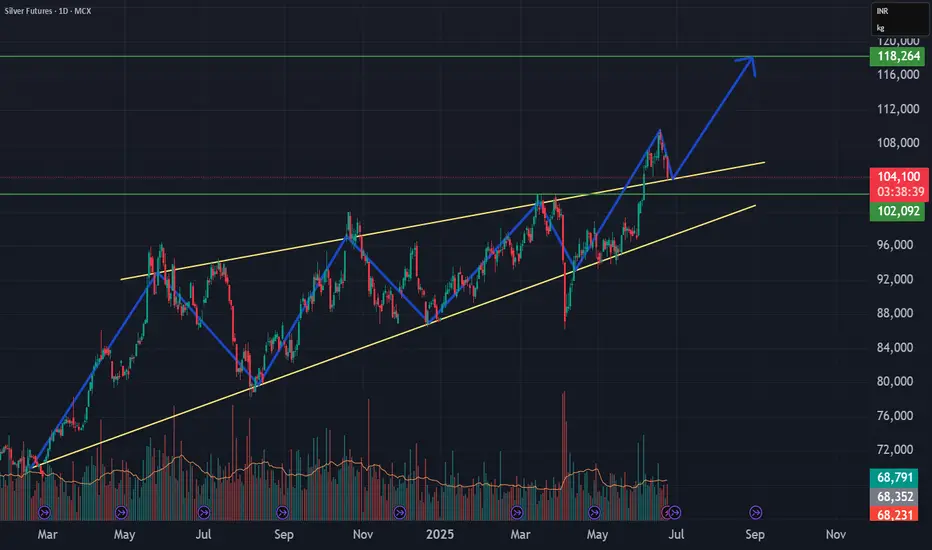
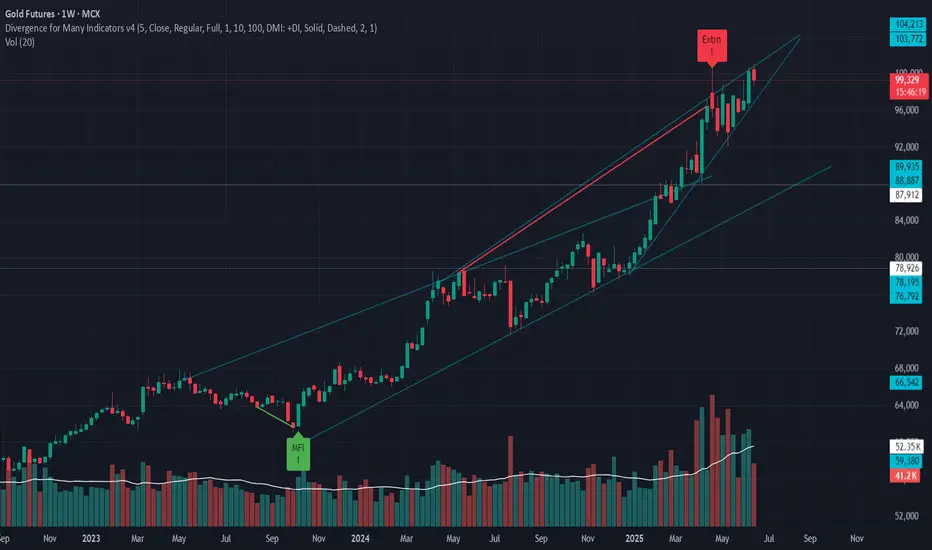
Gold Futures is forming a rising wedge with weakening momentum.
Gold is currently testing a rising trendline on the daily/weekly chart.
A trendline breakdown could signal a shift from bullish to corrective phase.
If the trendline breaks, the structure suggests:
Stop-loss: ₹101,000
Target 1: ₹90,000
Target 2: ₹86,000
This aligns with a potential retracement before the next macro wave (e.g., Fed rate cut cycle or global risk-off).
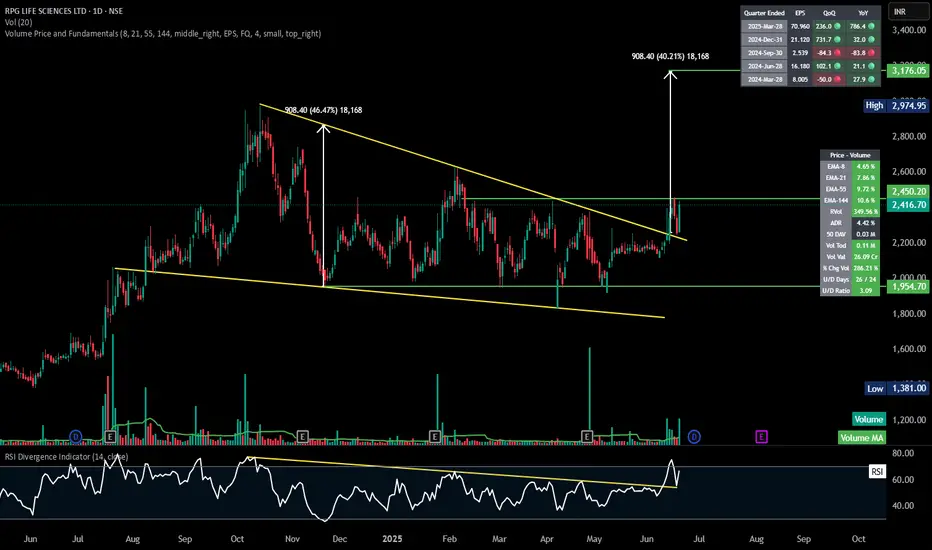
RPGLIFE | Falling wedge breakout ### 📊 **RPG Life Sciences Ltd - Technical Analysis Summary (Daily Chart)**
#### ⚡ **Breakout Observed**
* **Pattern**: Falling wedge breakout
* **Breakout Candle**: Strong bullish candle with \~6.88% gain on significant volume (107.98K)
* **Resistance Line Broken**: The upper descending trendline has been convincingly breached
#### 🎯 **Target Projection**
* **Measured Move**: ₹908.40 (from widest part of wedge)
* **Breakout Target**:
**Breakout Point**: ₹2,260 approx
**Target Price**: ₹2,260 + ₹908 = **₹3,176**
#### 📌 **Key Price Levels**
* **Current Price**: ₹2,416.70
* **Support**: ₹1,954 (recent base support)
* **Resistance/Target**: ₹3,176
* **Stop Loss Suggestion**: Below ₹2,100 or the wedge's upper line retest zone
#### 📈 **Indicators & Volume**
* **Volume**: Spike confirms breakout strength
* **RSI**: 66.28 – bullish with breakout above descending RSI trendline
* **EMA Confluence**:
* EMA-8: +4.65%
* EMA-21: +7.86%
* EMA-55: +9.72%
* EMA-144: +10.6%
#### 🧠 **Inference**
* A **bullish breakout** from a long consolidation zone.
* Volume and RSI confirmation add strength.
* Expected 30–40% upside from breakout level.
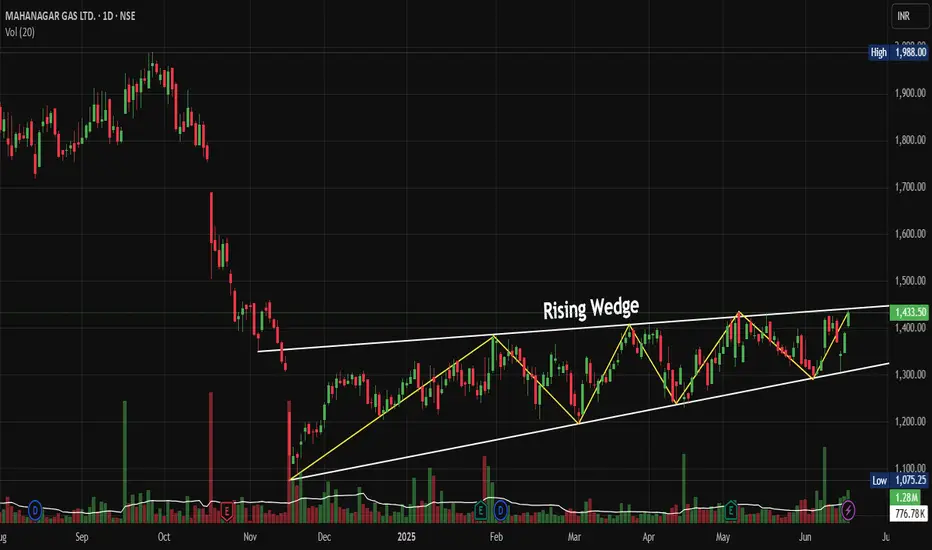
MGL: Rising Wedge Breakout Sets Stage for Explosive RallyNSE:MGL : Rising Wedge Breakout Sets Stage for Explosive Rally after management guidance of double-digit volume growth for the next three to four years.
Price Action Analysis:
• Stock has formed a classic Rising Wedge pattern from November 2024 lows around 1,075 to current levels near 1,433
• The wedge shows converging trendlines with higher highs and higher lows, typical of consolidation before a breakout
• Recent breakout above the upper trendline around 1,400 levels confirms bullish momentum
• Price has rallied 33% from the wedge base, indicating strong underlying demand
Volume Spread Analysis:
• Volume spikes are visible during key breakout moments, particularly in recent sessions
• Higher volume on up days compared to down days suggests institutional accumulation
• Volume expansion during the wedge breakout confirms genuine buying interest
• Recent green volume bars indicate sustained buying pressure supporting the uptrend
Key Technical Levels:
Support Levels:
• Immediate support at 1,380-1,400 (previous resistance turned support)
• Secondary support at 1,300 (middle of the rising wedge)
• Major support at 1,200-1,250 (lower trendline of the wedge)
• Critical support at 1,075 (November 2024 lows)
Resistance Levels:
• Immediate resistance at 1,450-1,470 (psychological levels)
• Next resistance at 1,500 (round number resistance)
• Extended target at 1,600-1,650 based on wedge height projection
• 52-Week high resistance around 1,988 (historical peak)
Technical Patterns:
• Rising Wedge pattern near to completion with successful breakout
• Multiple higher highs and higher lows confirming uptrend structure
• Potential cup and handle formation on longer timeframes
• Bullish flag consolidation patterns within the broader uptrend
Trade Setup:
Entry Strategy:
• Primary entry on pullback to 1,400-1,420 levels (retest of breakout zone)
• Aggressive entry at the current market price of around 1,433 for momentum players
• Scale-in approach: 50% at 1,420, 25% at 1,380, 25% at 1,350
Exit Levels:
• First target: 1,500 (16% upside from current levels)
• Second target: 1,600 (22% upside potential)
• Extended target: 1,700-1,750 for long-term holders
• Trailing stop-loss strategy recommended above 1,500 levels
Stop-Loss Placement:
• Conservative stop-loss: 1,320 (below wedge support)
• Aggressive stop-loss: 1,380 (below immediate support)
• Risk-reward ratio of 1:2 to 1:3 depending on entry and exit points
Position Sizing and Risk Management:
• Allocate a maximum of 2-3% of the portfolio to a single position
• Use a 1% risk per trade rule based on stop-loss distance
• Consider partial profit booking at 1,500 levels
• Maintain position size discipline to avoid overexposure
Sectoral and Fundamental Backdrop:
Sector Analysis:
• City Gas Distribution (CGD) sector showing resilience amid energy transition
• The government push for clean fuel adoption, supporting the natural gas demand
• Infrastructure expansion in tier-2 and tier-3 cities benefiting CGD companies
• Regulatory environment remains supportive with steady tariff mechanisms
Fundamental Strengths:
• NSE:MGL operates in prime Mumbai and adjoining areas with stable demand
• Strong cash flows from residential and industrial customer base
• Consistent dividend-paying track record with healthy payout ratios
• Robust balance sheet with minimal debt and strong return on equity
• Expanding PNG and CNG network, providing growth visibility
Key Catalysts:
• Increasing vehicle conversion to CNG, supporting volume growth
• Industrial demand recovery post-pandemic is driving commercial sales
• Government policies favouring cleaner fuel alternatives
• Potential for geographical expansion into new license areas
Risk Factors:
• Crude oil price volatility is affecting input costs
• Competition from electric vehicles in the transportation segment
• Regulatory changes in gas pricing mechanisms
• Economic slowdown impacting industrial demand
My Take:
The technical setup suggests NSE:MGL is well-positioned for continued upward momentum following the rising wedge breakout. The combination of strong fundamentals, supportive sector dynamics, and bullish technical patterns creates an attractive risk-reward proposition for both swing and positional traders. However, traders should remain disciplined with position sizing and risk management given the stock's premium valuation at current levels.
Keep in the Watchlist.
NO RECO. For Buy/Sell.
📌Thank you for exploring my idea! I hope you found it valuable.
🙏FOLLOW for more
👍BOOST if you found it useful.
✍️COMMENT below with your views.
Meanwhile, check out my other stock ideas on the right side until this trade is activated. I would love your feedback.
Disclaimer: "I am not a SEBI REGISTERED RESEARCH ANALYST AND INVESTMENT ADVISER."
This analysis is intended solely for informational and educational purposes and should not be interpreted as financial advice. It is advisable to consult a qualified financial advisor or conduct thorough research before making investment decisions.
Aarti Drugs - Wedge BreakoutAarti Drugs looking to breakout in upcoming month. Wedge formation. Candle & RSI breakout nearby. Monthly chart looks good with big upside potential. Not a recommendation.

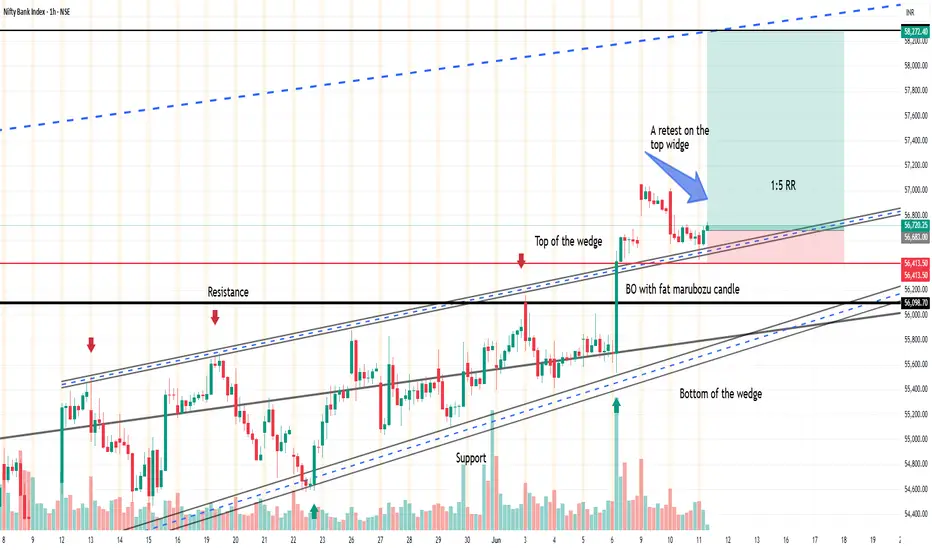
Banknifty : Rising wedge break out with liquidity trap• BN was trading in a rising wedge from 7th May.
• An event of liquidity trap for the sellers occurs on 9th of May when market traded below the wedge.
• A Marubozu candle on 12th May opening indicate the big boys wants to move the BN upward and grab all the seller's liquidity.
• A higher high pattern is clearly visible on the rising wedge with resistance and support trendline.
• A consolidation of approximately one month indicates accumulation phase.
• 06th of June opening candle broke the wedge.
• A retest happens in next 2 days.
• On 11th June a retest entry trigger on top of the wedge in opening hours.
• A trade with 1:5 RR with a target of long run channel mid point.
• Preferable a bull call spread due to recent volatility crash and high risk to reward.
• Game is on. Just for educational purpose post.